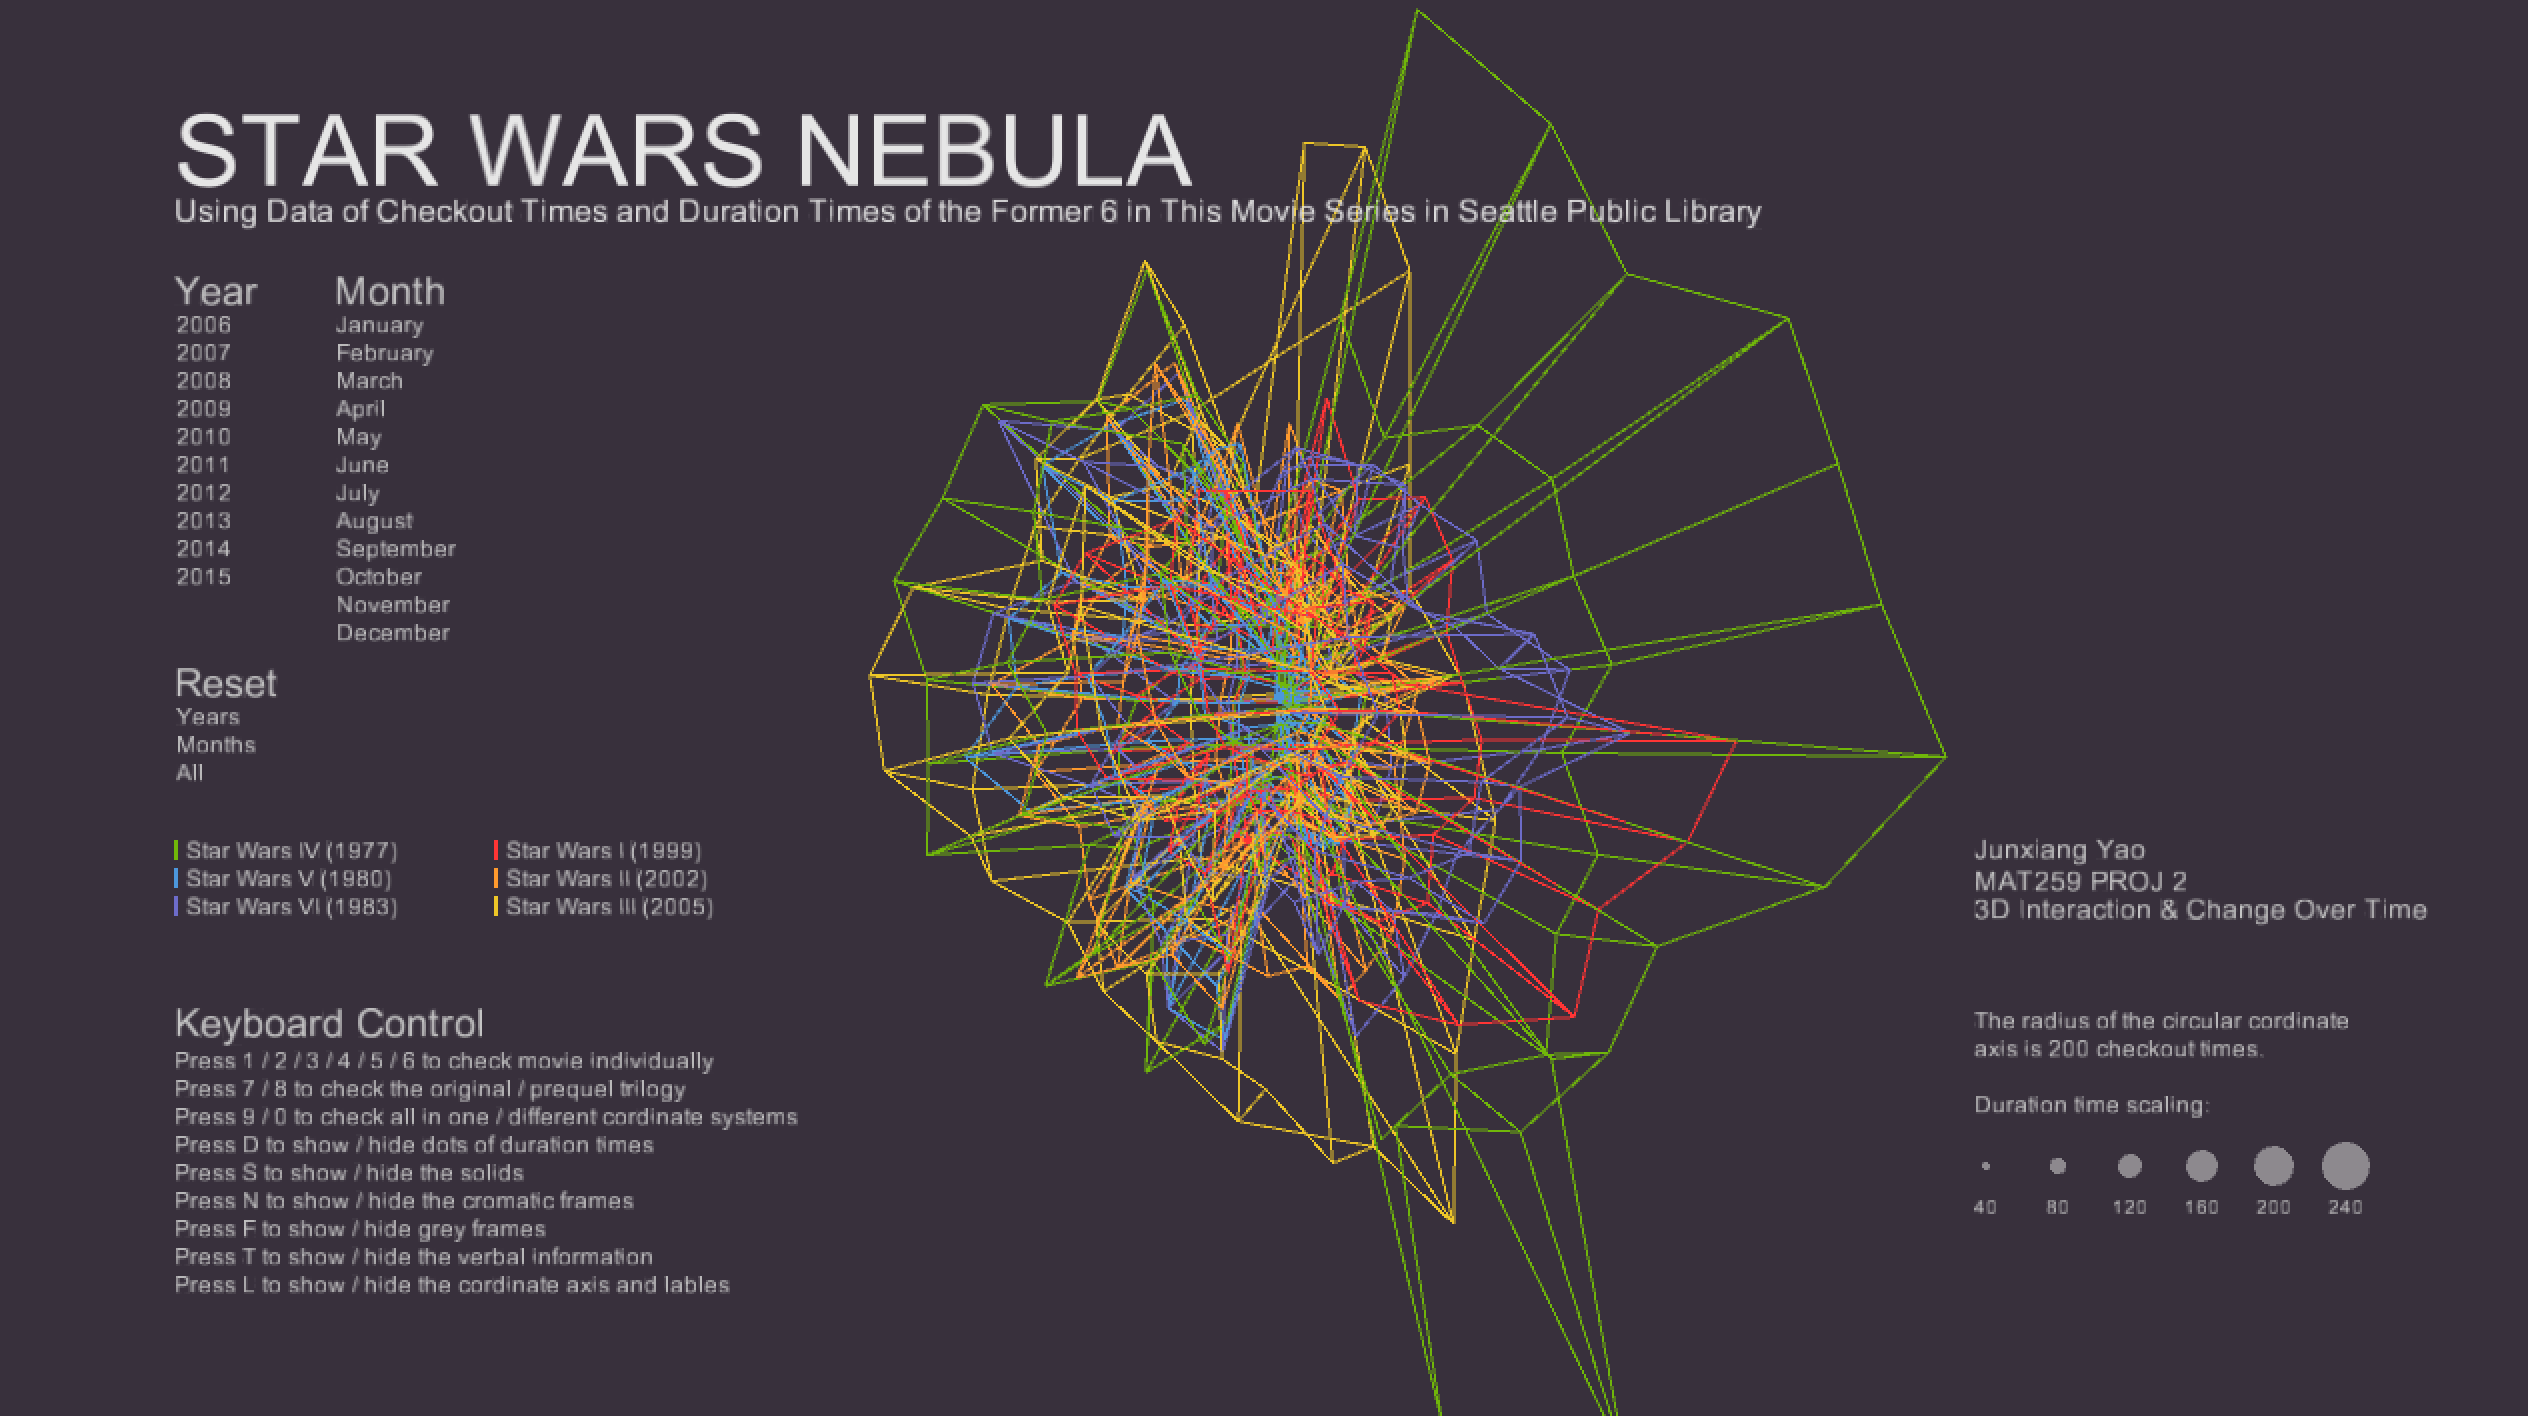
Star Wars Nebula
MAT 259, 2016
Junxiang Yao
Concept
In this project, I tried to dig deeper. I decided to find the data of a movie series or a novels series in SPL as the database. Since Star Wars 7 had just been released last Christmas, I was curious about the patterns of the former 6 movies in this movie series. And I chose years, months, movie titles, checkout times and duration times as the columns I used in the visualization. Basically, I calculated the total checkout times and the duration times, which is calculated using TIMESTAMPDIFF() function in MySQL, and sorted the data by the order of month and year.
Query
Here is the query of calculating checkout times:
Because the six queries which calculated duration time the six movies are very similar to each other. So I just show one of them here.
The query of calculating duration times of Star War 4, The New Hope:
Select YEAR(checkout) AS Year, MONTH(checkout) AS Month,

SUM(CASE

WHEN spl.title.title like '%The Phantom Menace%' Then 1

ELSE 0 END) AS 'StarWar1',

SUM(CASE

WHEN spl.title.title like '%Attack of the Clones%' Then 1

ELSE 0 END) AS 'StarWar2',

SUM(CASE

WHEN spl.title.title like '%Revenge of the Sith%' Then 1

ELSE 0 END) AS 'StarWar3',

SUM(CASE

WHEN spl.title.title like '%A New Hope%' Then 1

ELSE 0 END) AS 'StarWar4',

SUM(CASE

WHEN spl.title.title like '%The Empire Strikes Back%' Then 1

ELSE 0 END) AS 'StarWar5',

SUM(CASE

WHEN spl.title.title like '%Return of the Jedi%' Then 1

ELSE 0 END) AS 'StarWar6'

From spl._transactionsExploded, spl.title

WHERE spl._transactionsExploded.bibNumber = spl.title.bibNumber

AND YEAR(checkOut) >= '2006'

AND YEAR(checkOut) < '2016'

GROUP BY MONTH(checkOut) , YEAR(checkOut)

ORDER BY YEAR(checkOut) , MONTH(checkOut)
Because the six queries which calculated duration time the six movies are very similar to each other. So I just show one of them here.
The query of calculating duration times of Star War 4, The New Hope:
Select YEAR(checkOut) AS Year,

MONTH(checkOut) AS Month,

Count(TIMESTAMPDIFF(DAY,checkOut,checkIn))AS'starwas4duration'

From spl._transactionsExploded, spl.title

WHERE spl._transactionsExploded.bibNumber = spl.title.bibNumber

AND spl.title.title like '%A New Hope%'

AND YEAR(checkOut) >= '2006'

AND YEAR(checkOut) < '2016'

GROUP BY MONTH(checkOut) , YEAR(checkOut)

ORDER BY YEAR(checkOut) , MONTH(checkOut)
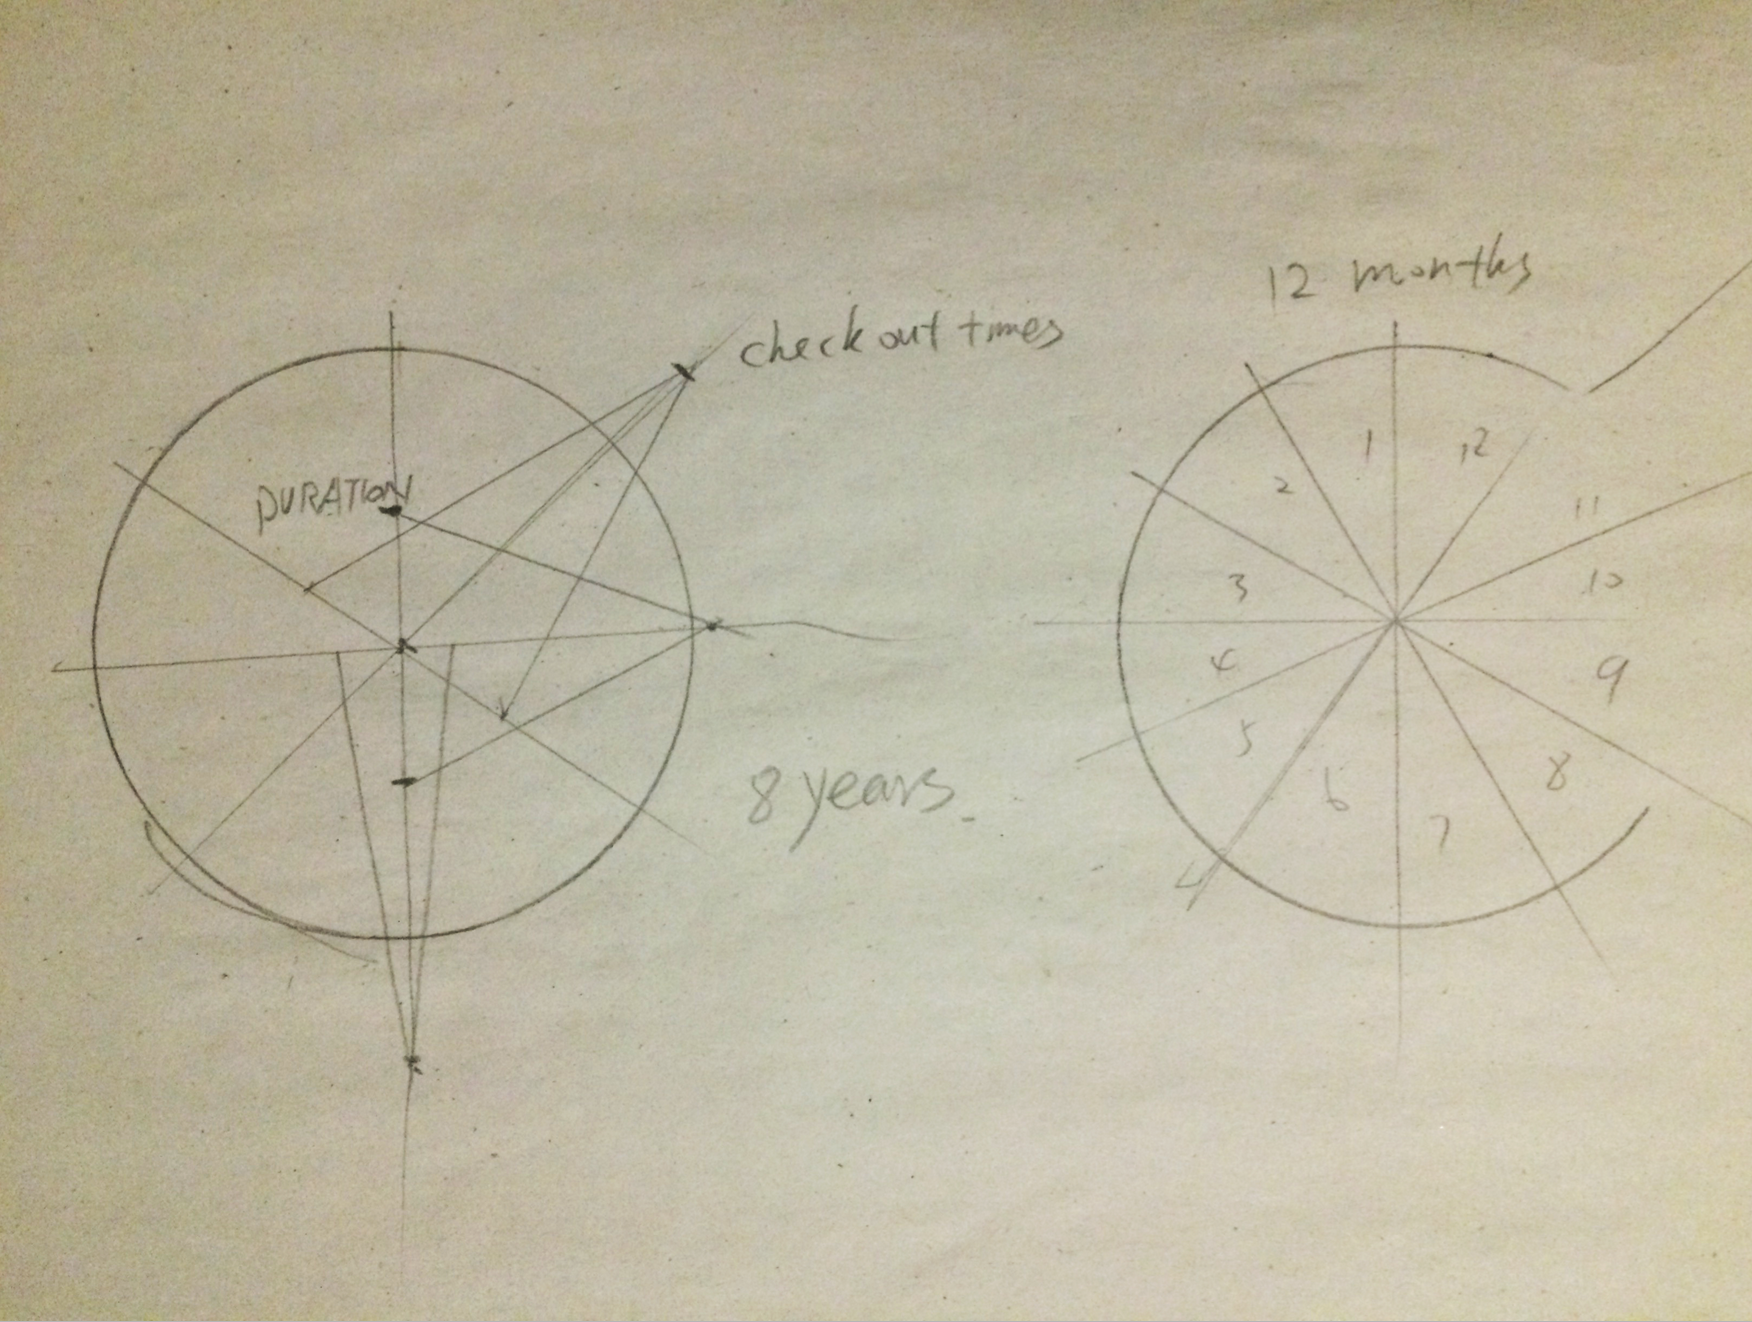
Preliminary sketches
At the beginning, I wanted to create a sphere like structure. The latitude of the structure represents the month, and the longitude of the structure represents the year. And I draw pyramids to display the data of each months in the data set. The height of the pyramid shows the checkout times in that month, and the width of the bottom edge of the pyramid shows the total duration time of the item in that month.
Process
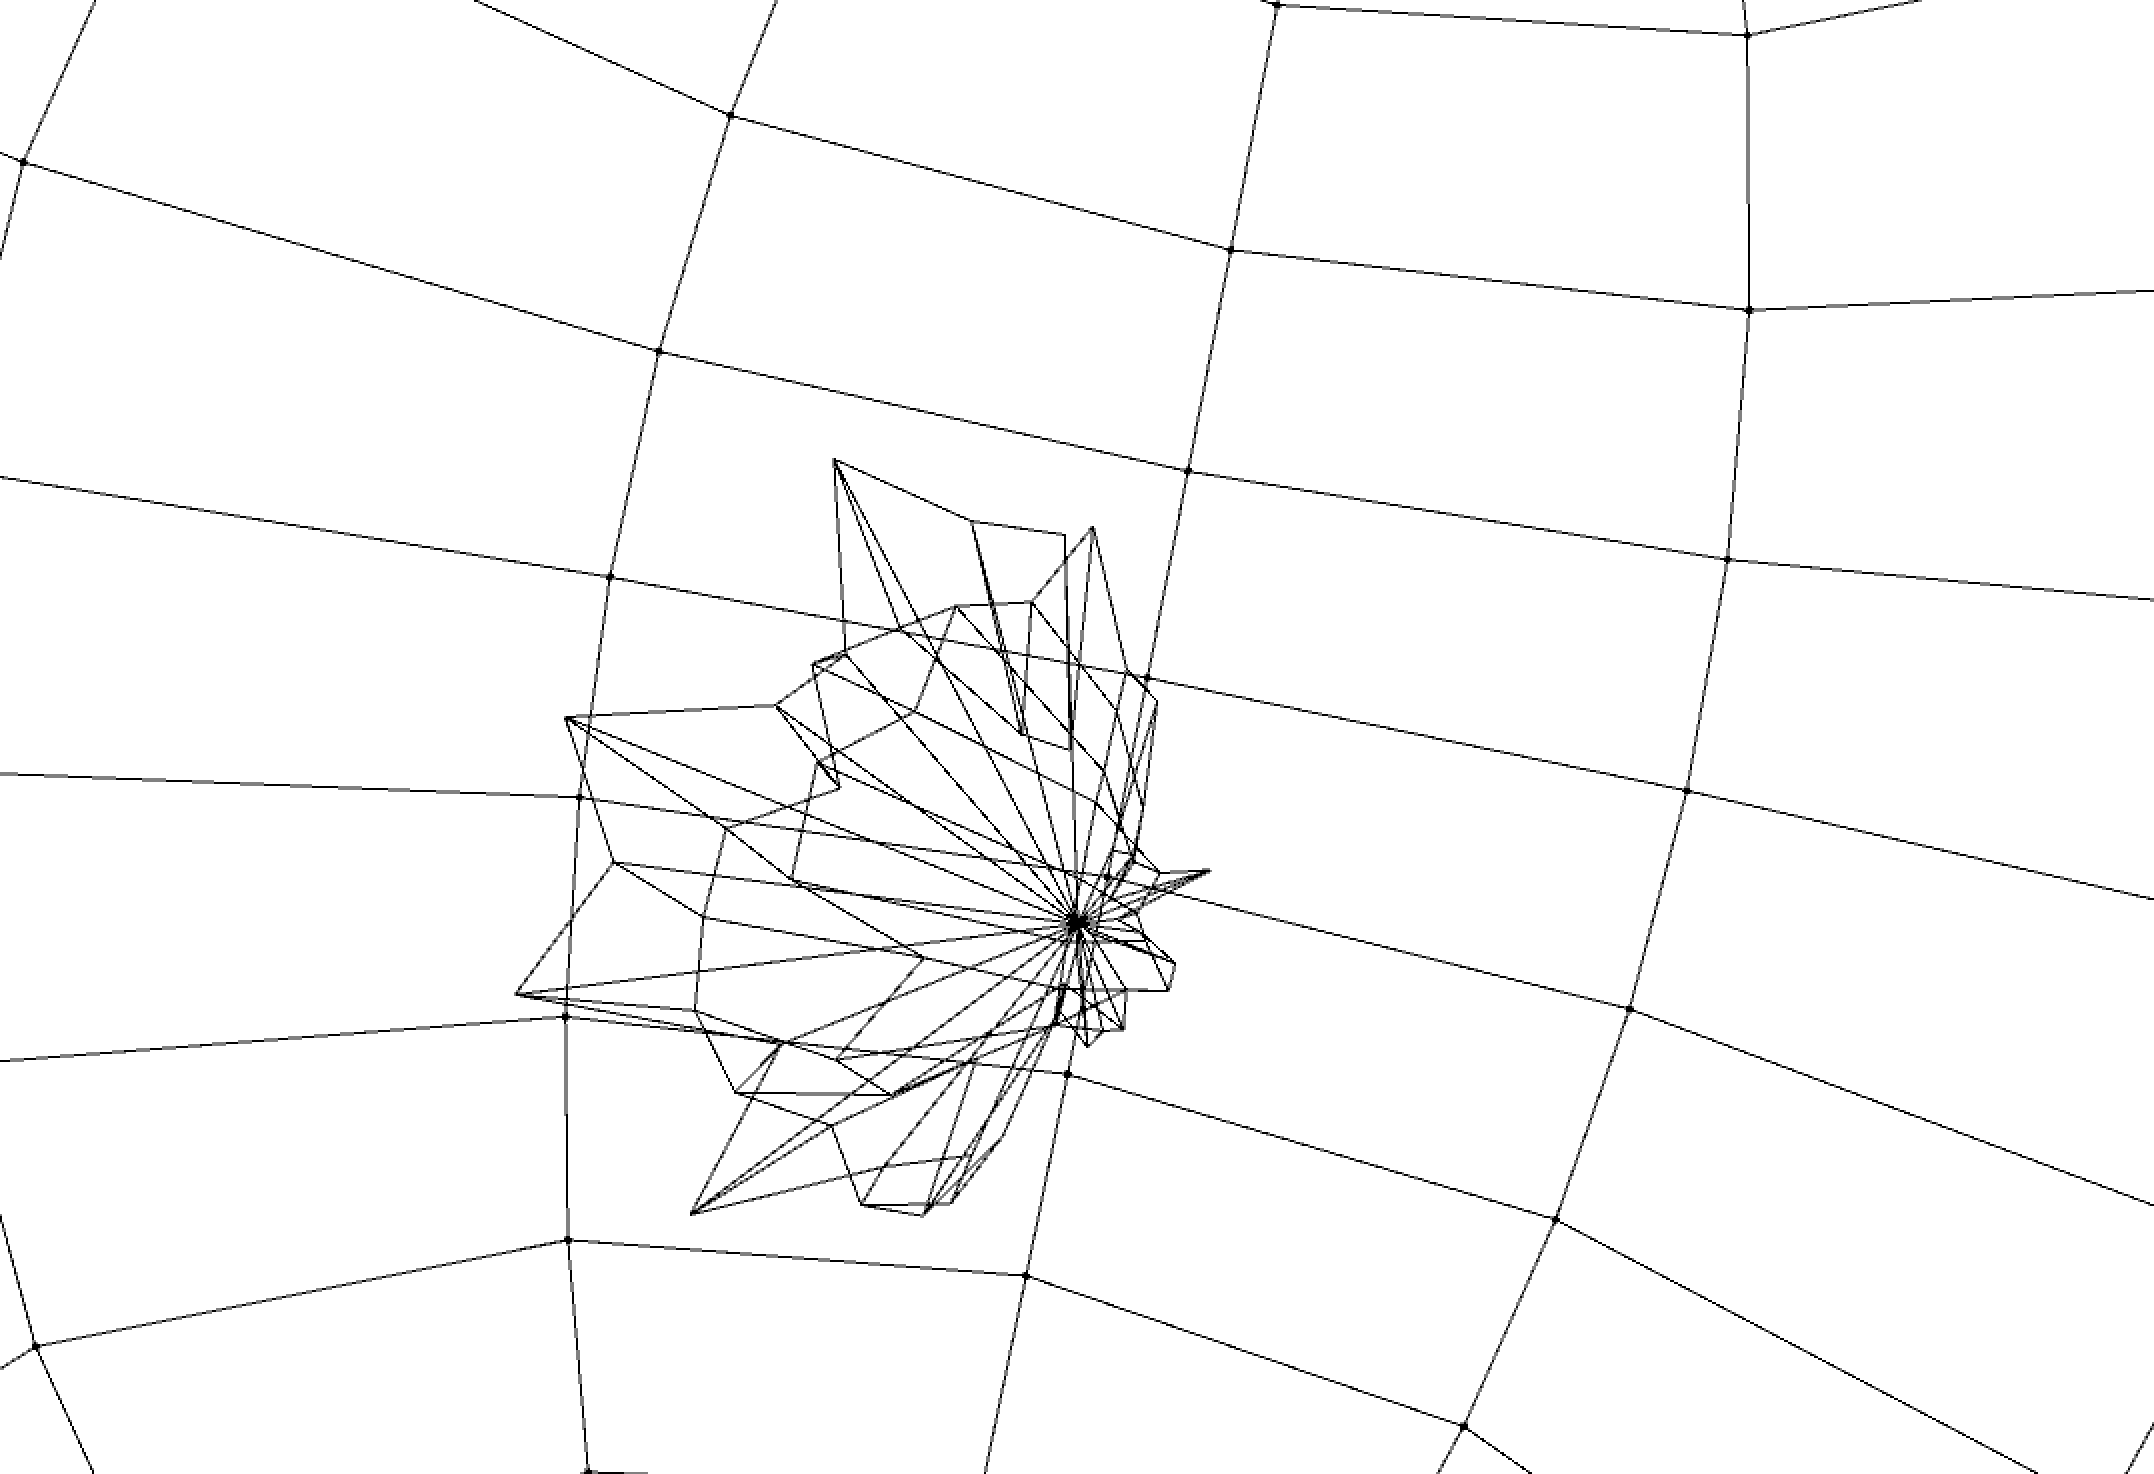
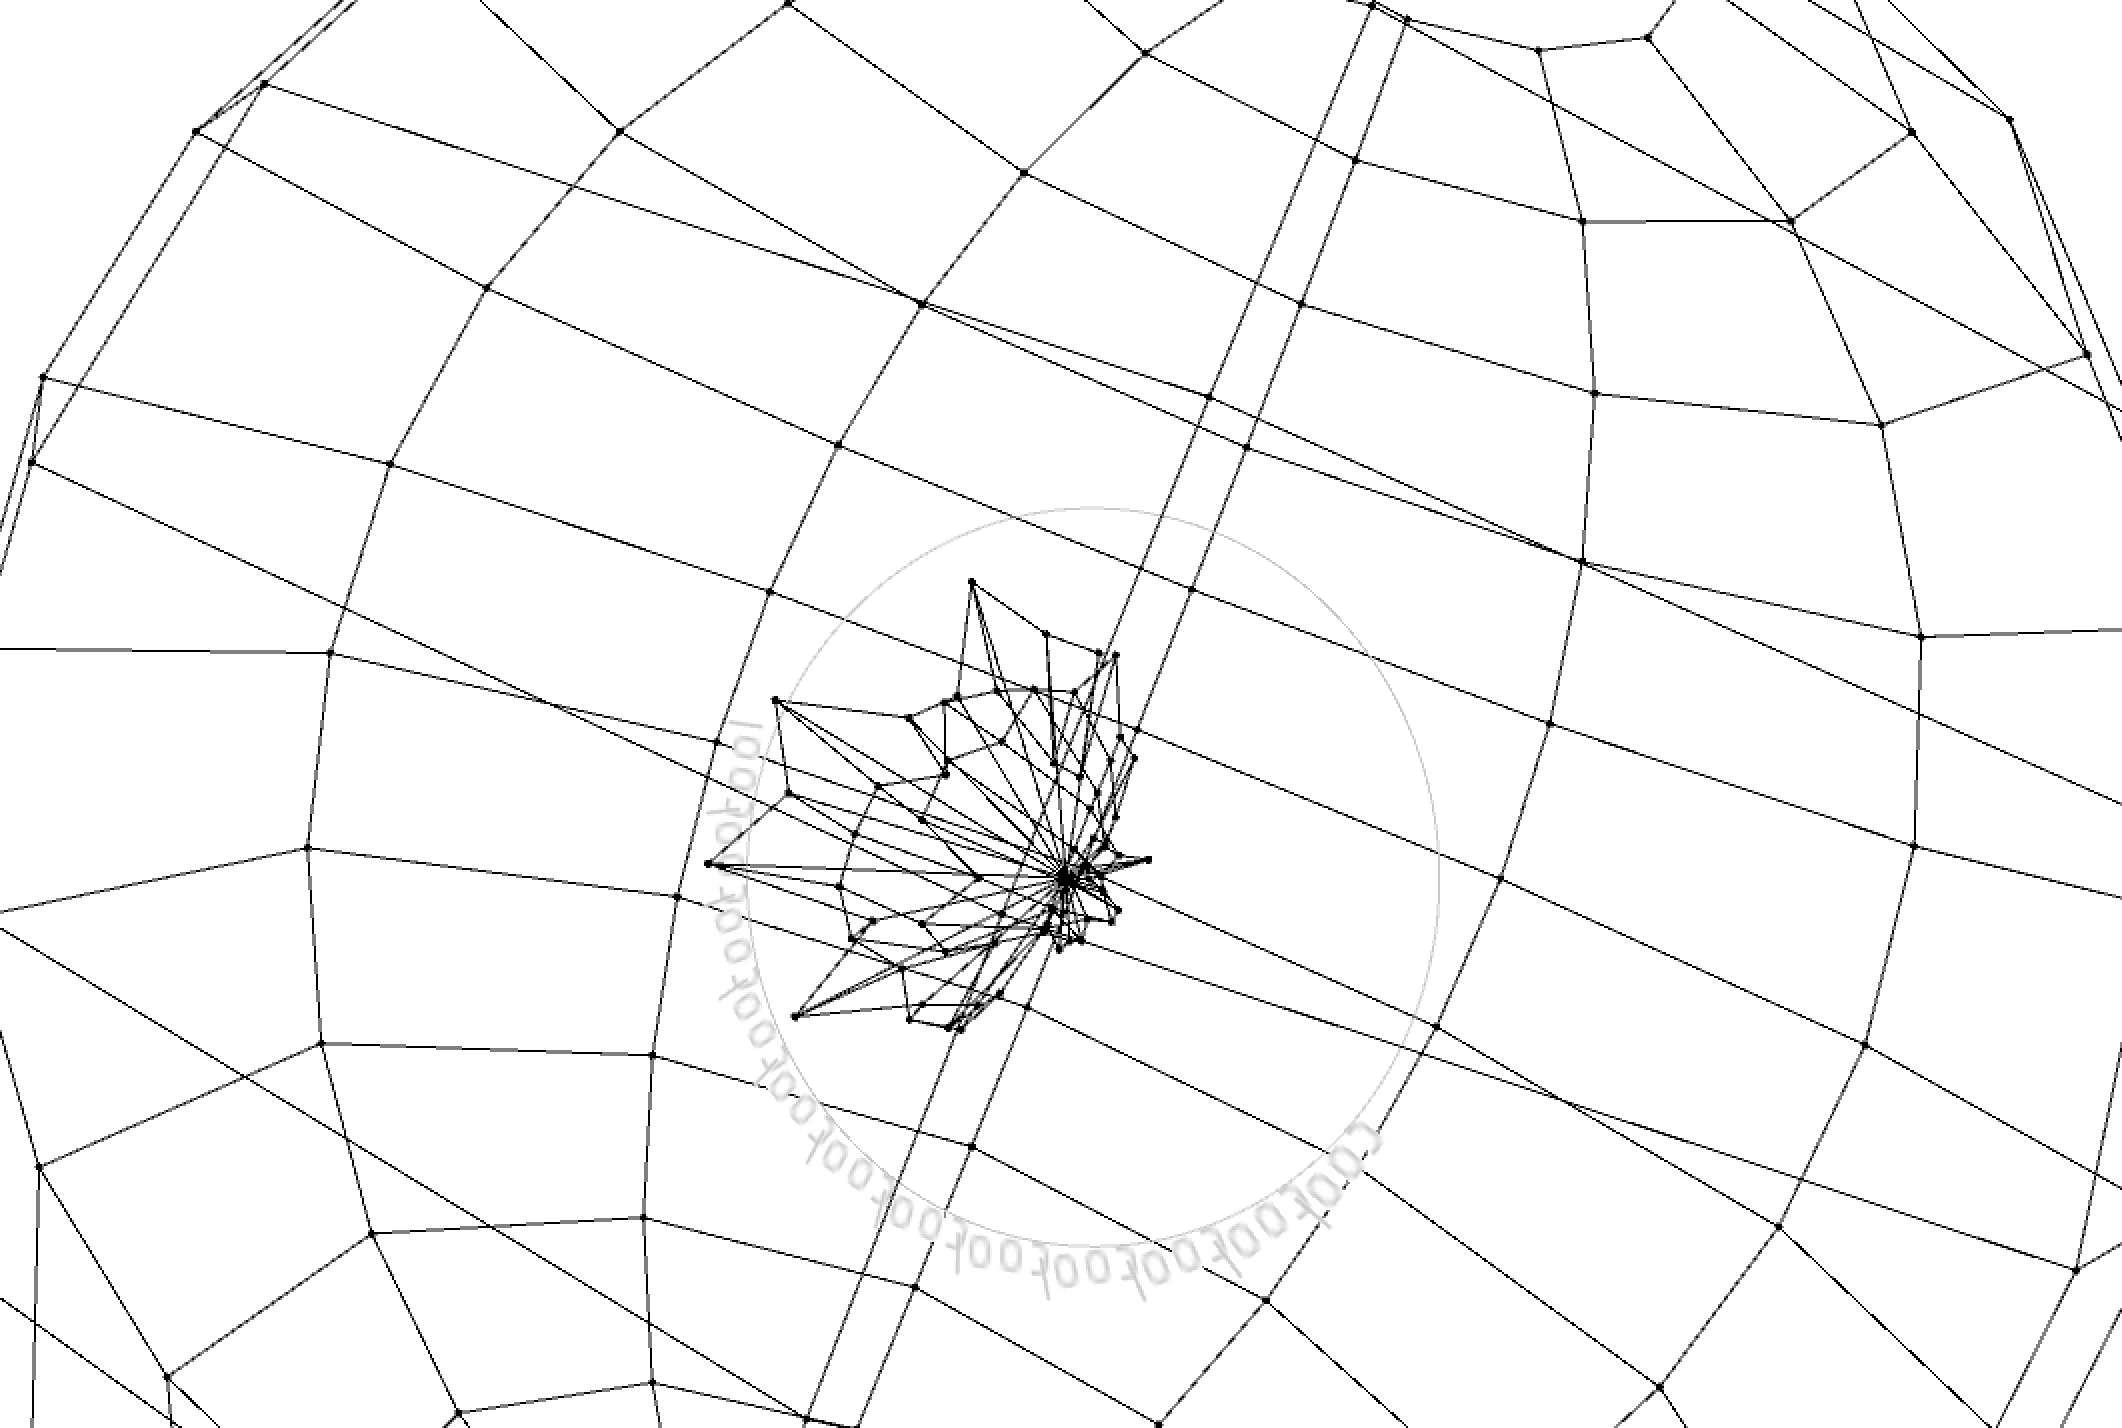
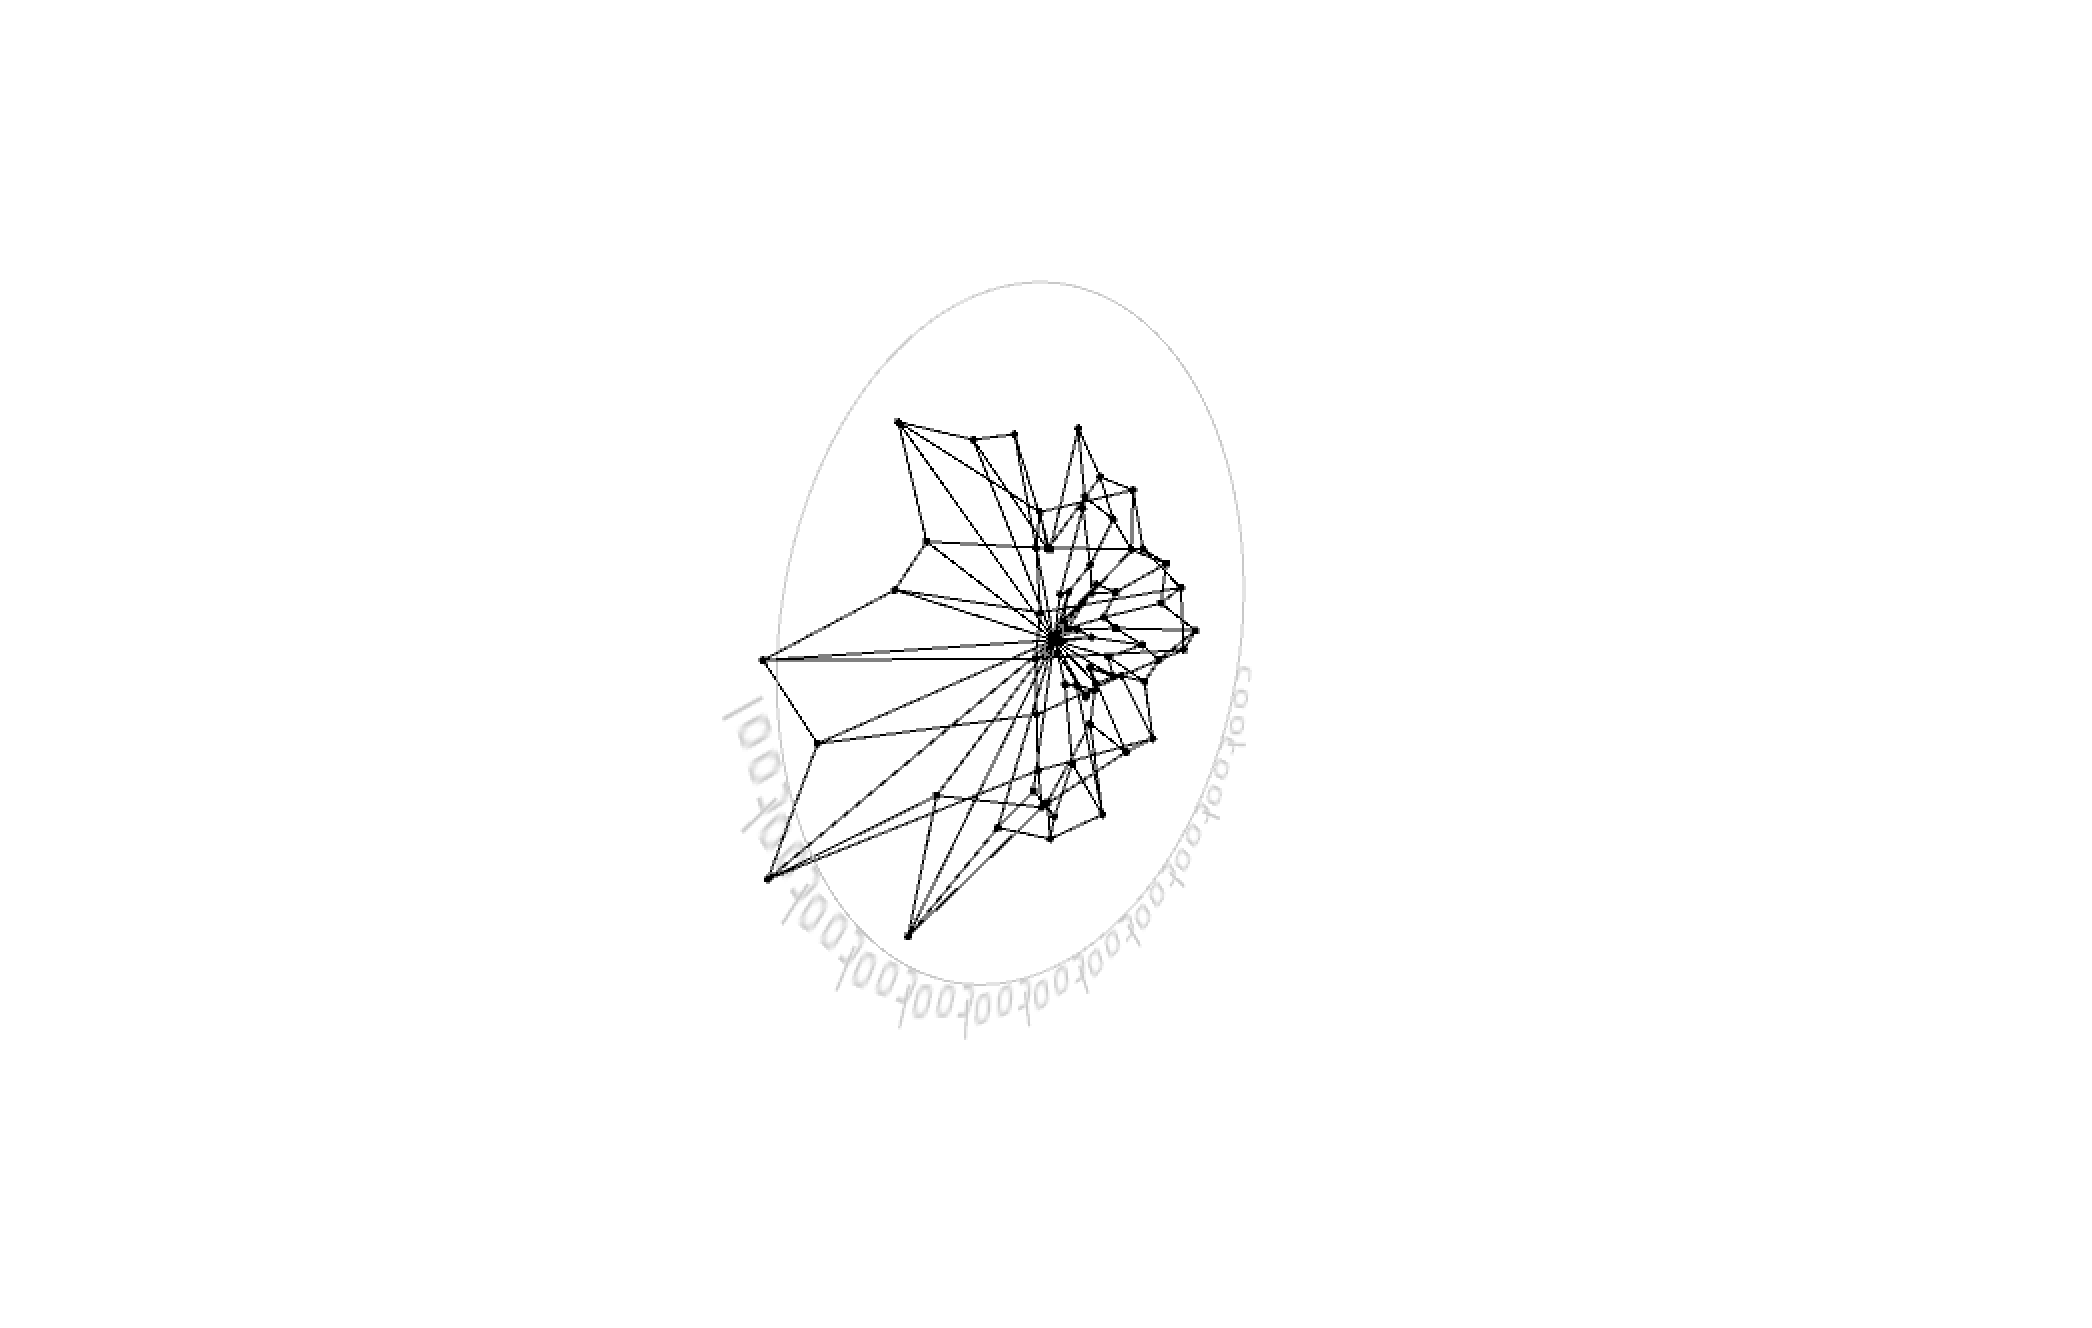
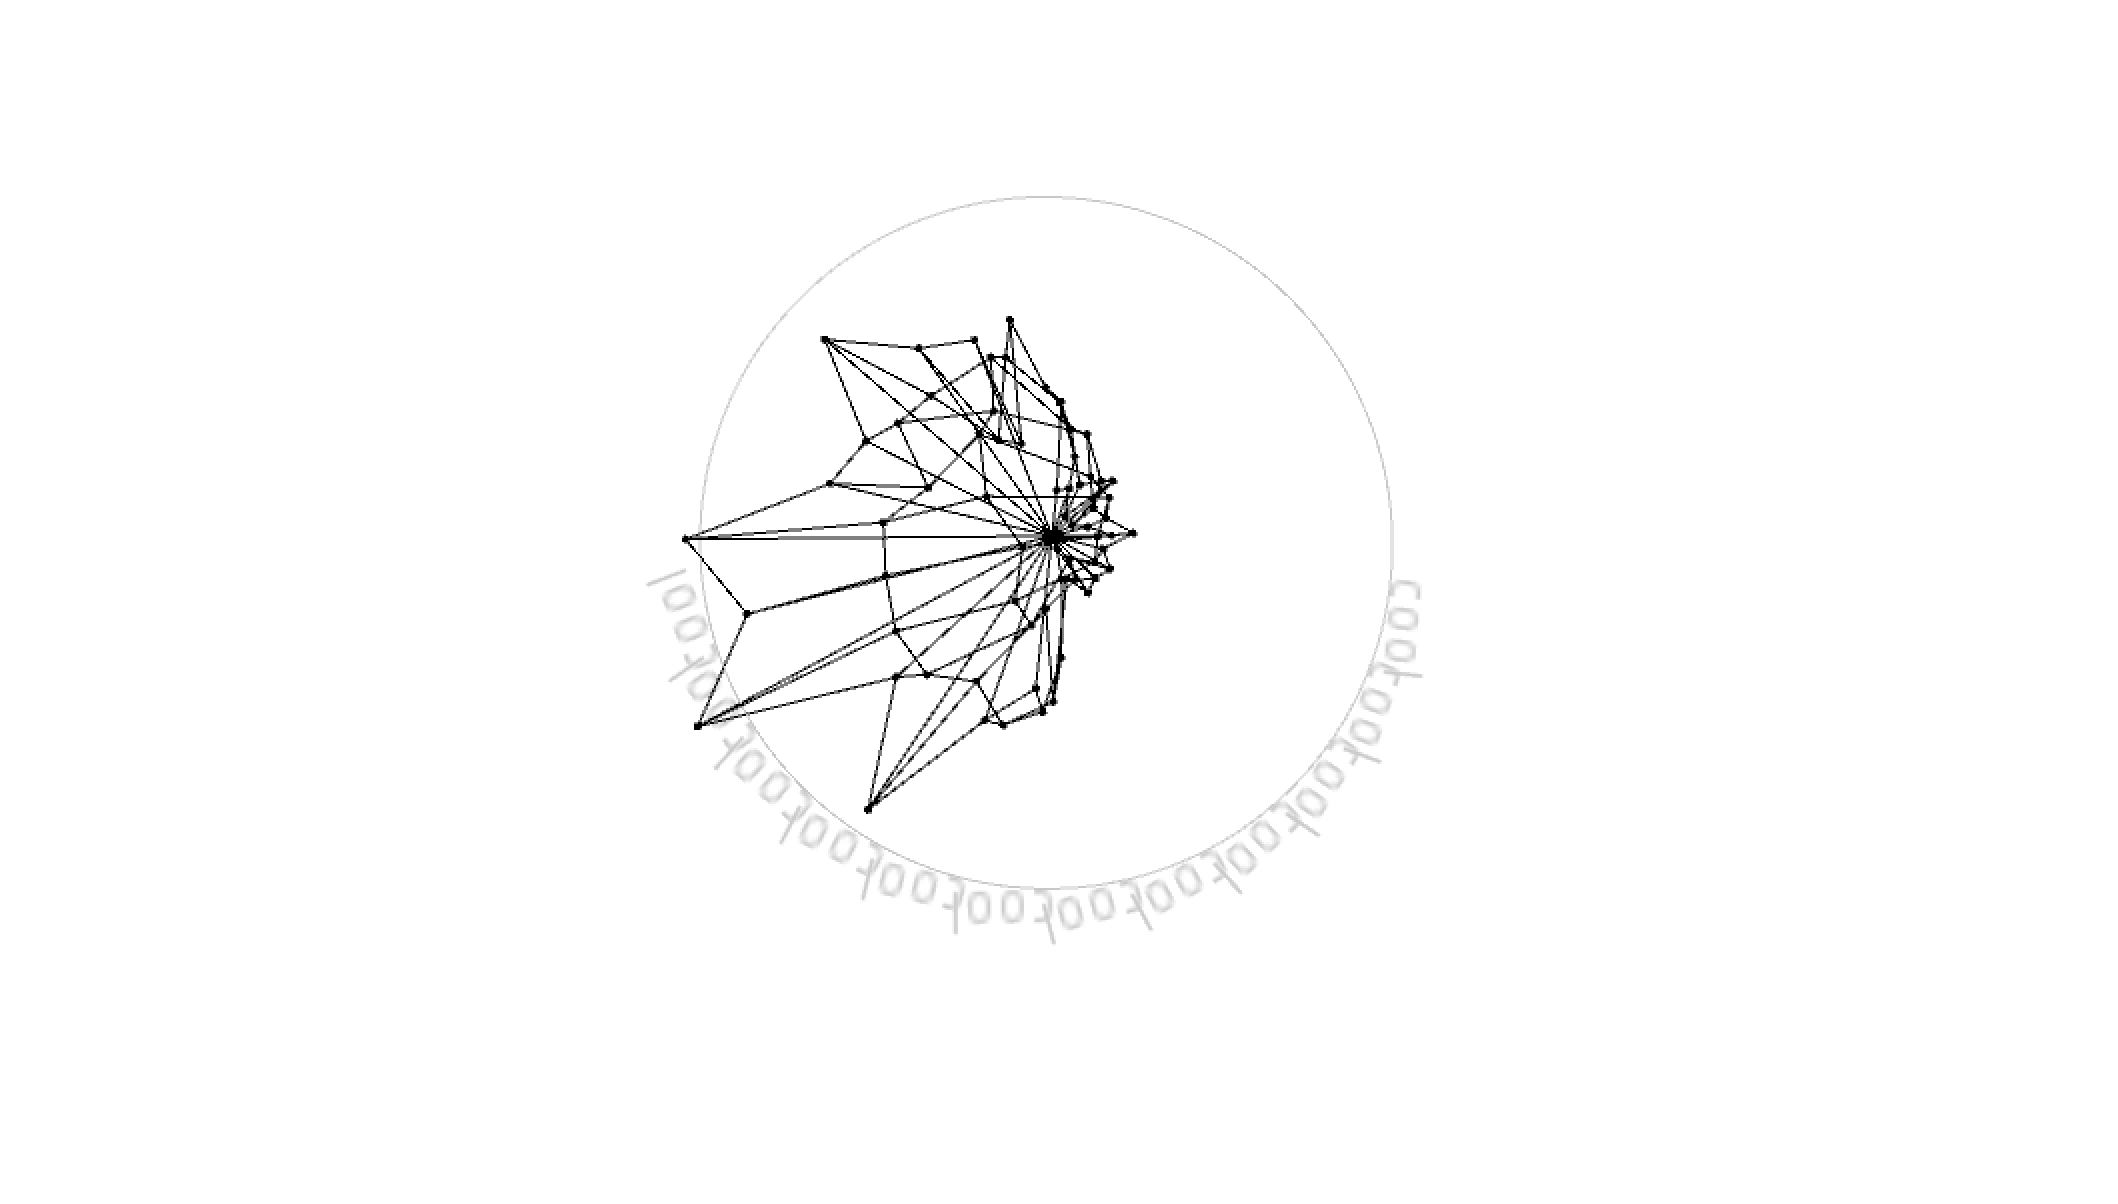
After I realizing my original idea, the result is not as clear as I would have expected. Although I didn't use the real data in drawing this prototype, I can imagine the final result. I decided to change it a little bit.
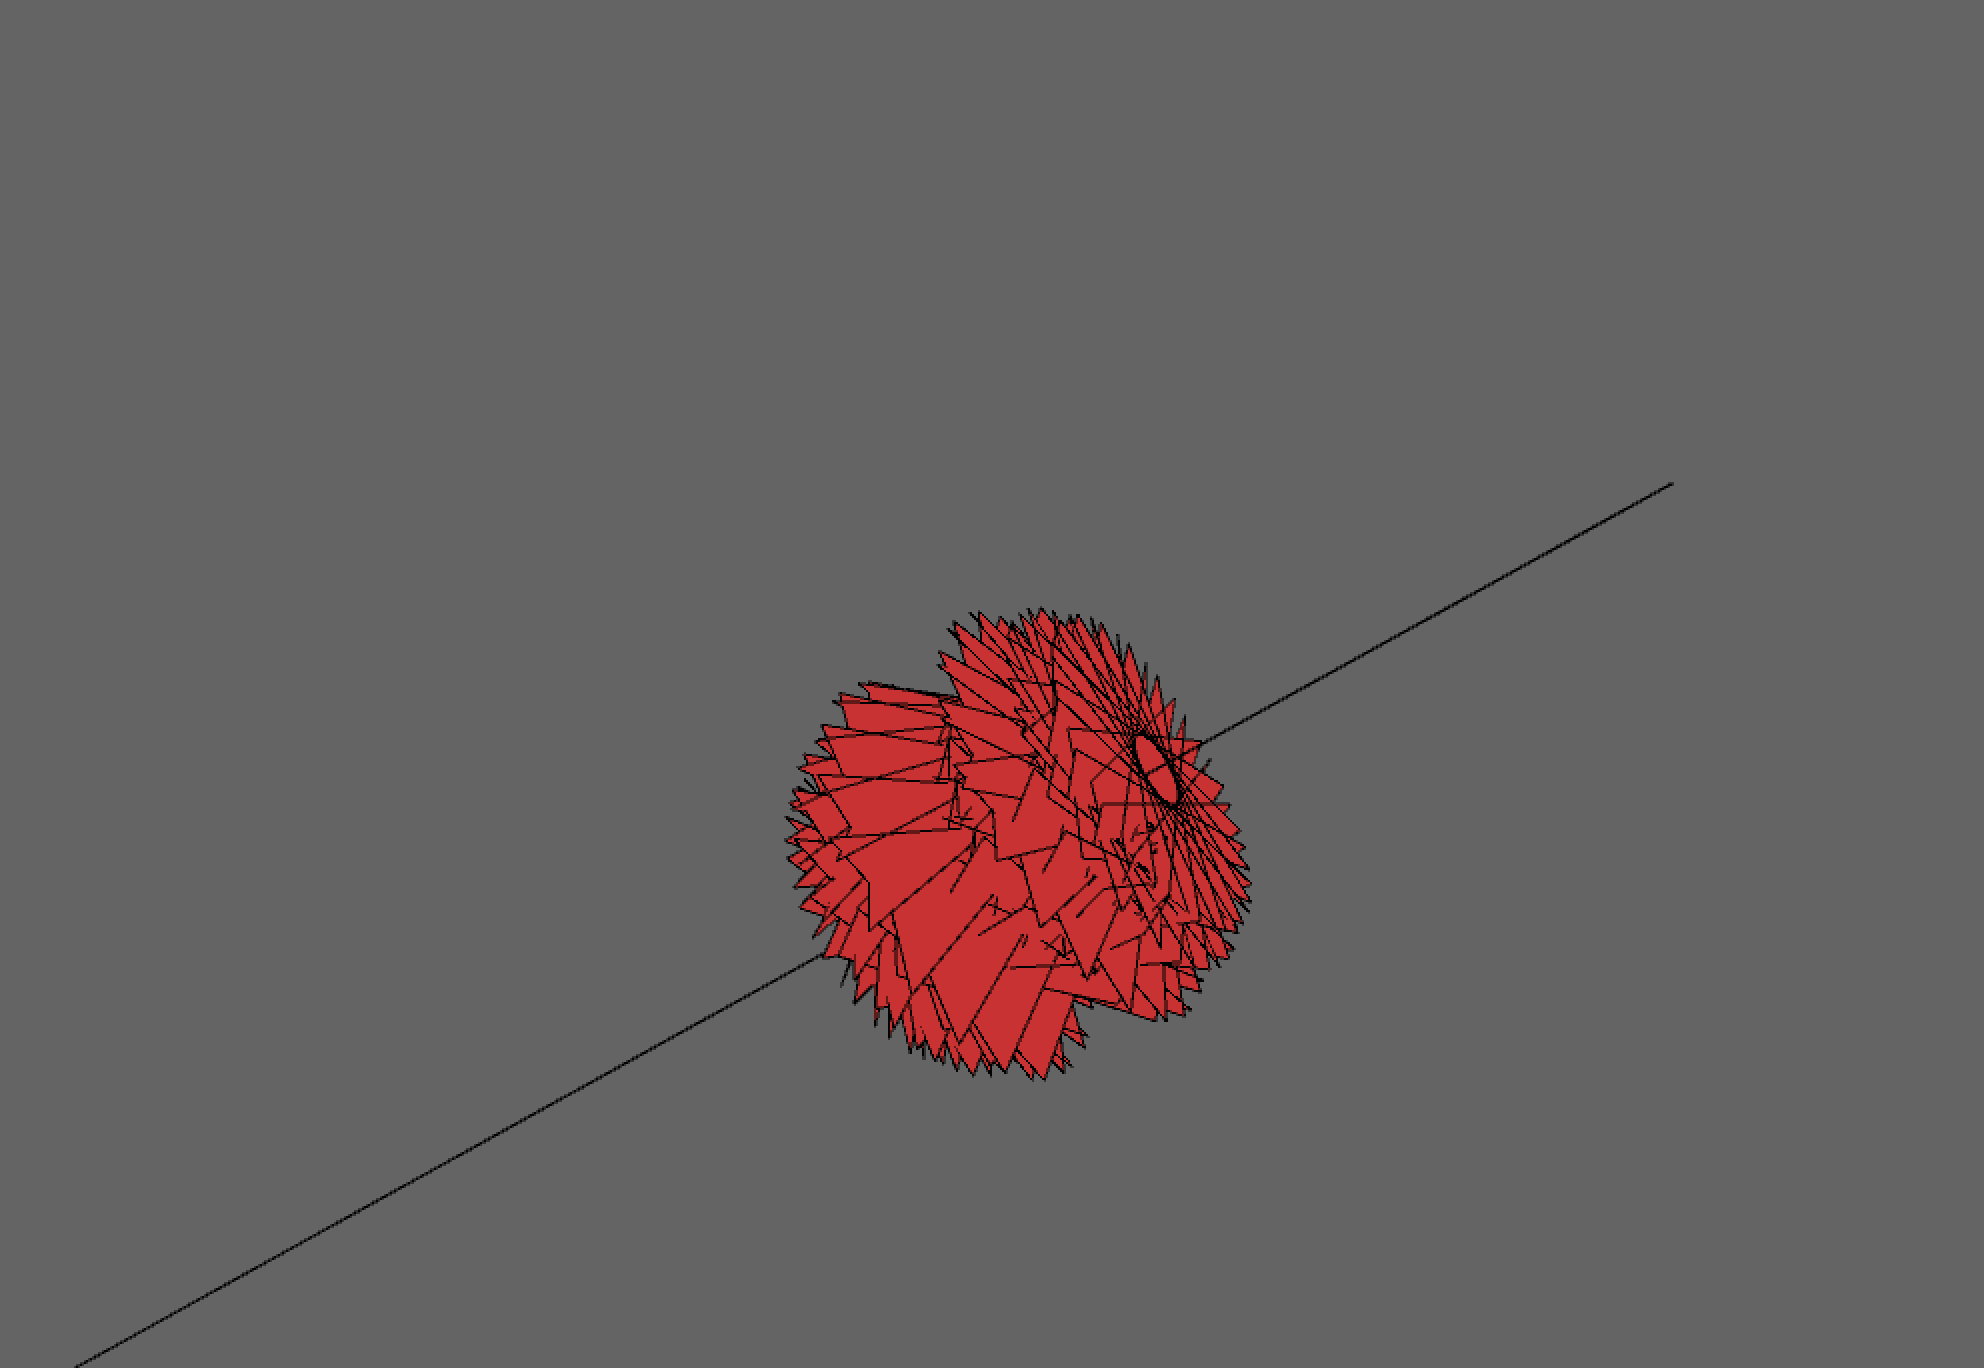
I reversed pyramids upside down because I think this may clarify the data and maybe beautify it. The result is still not good enough.
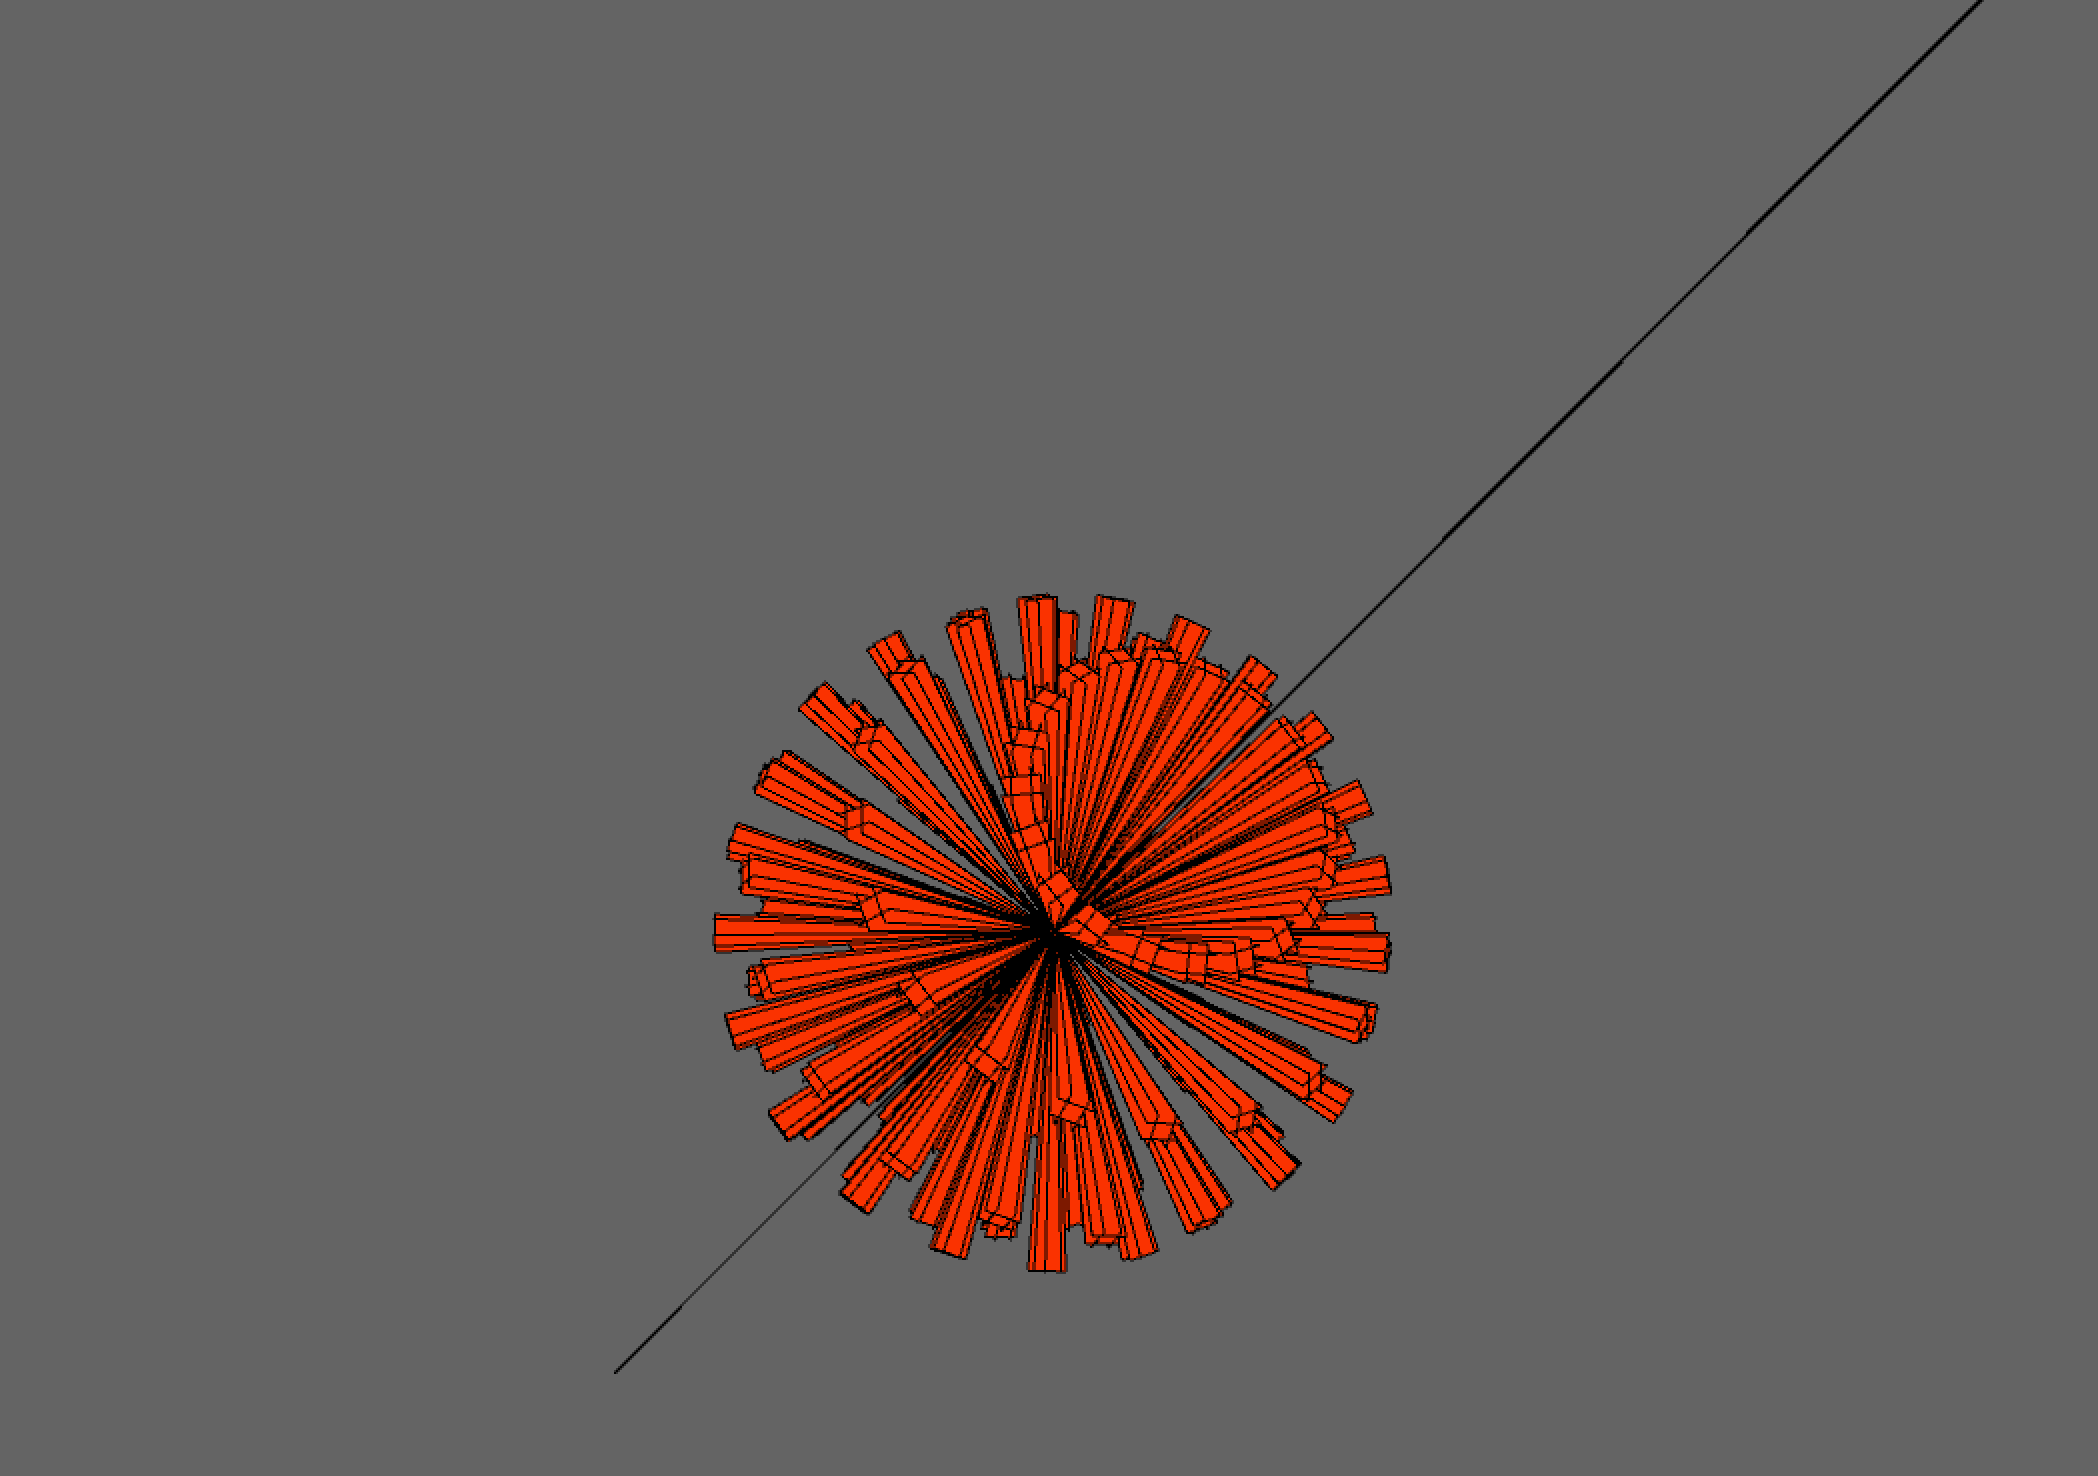
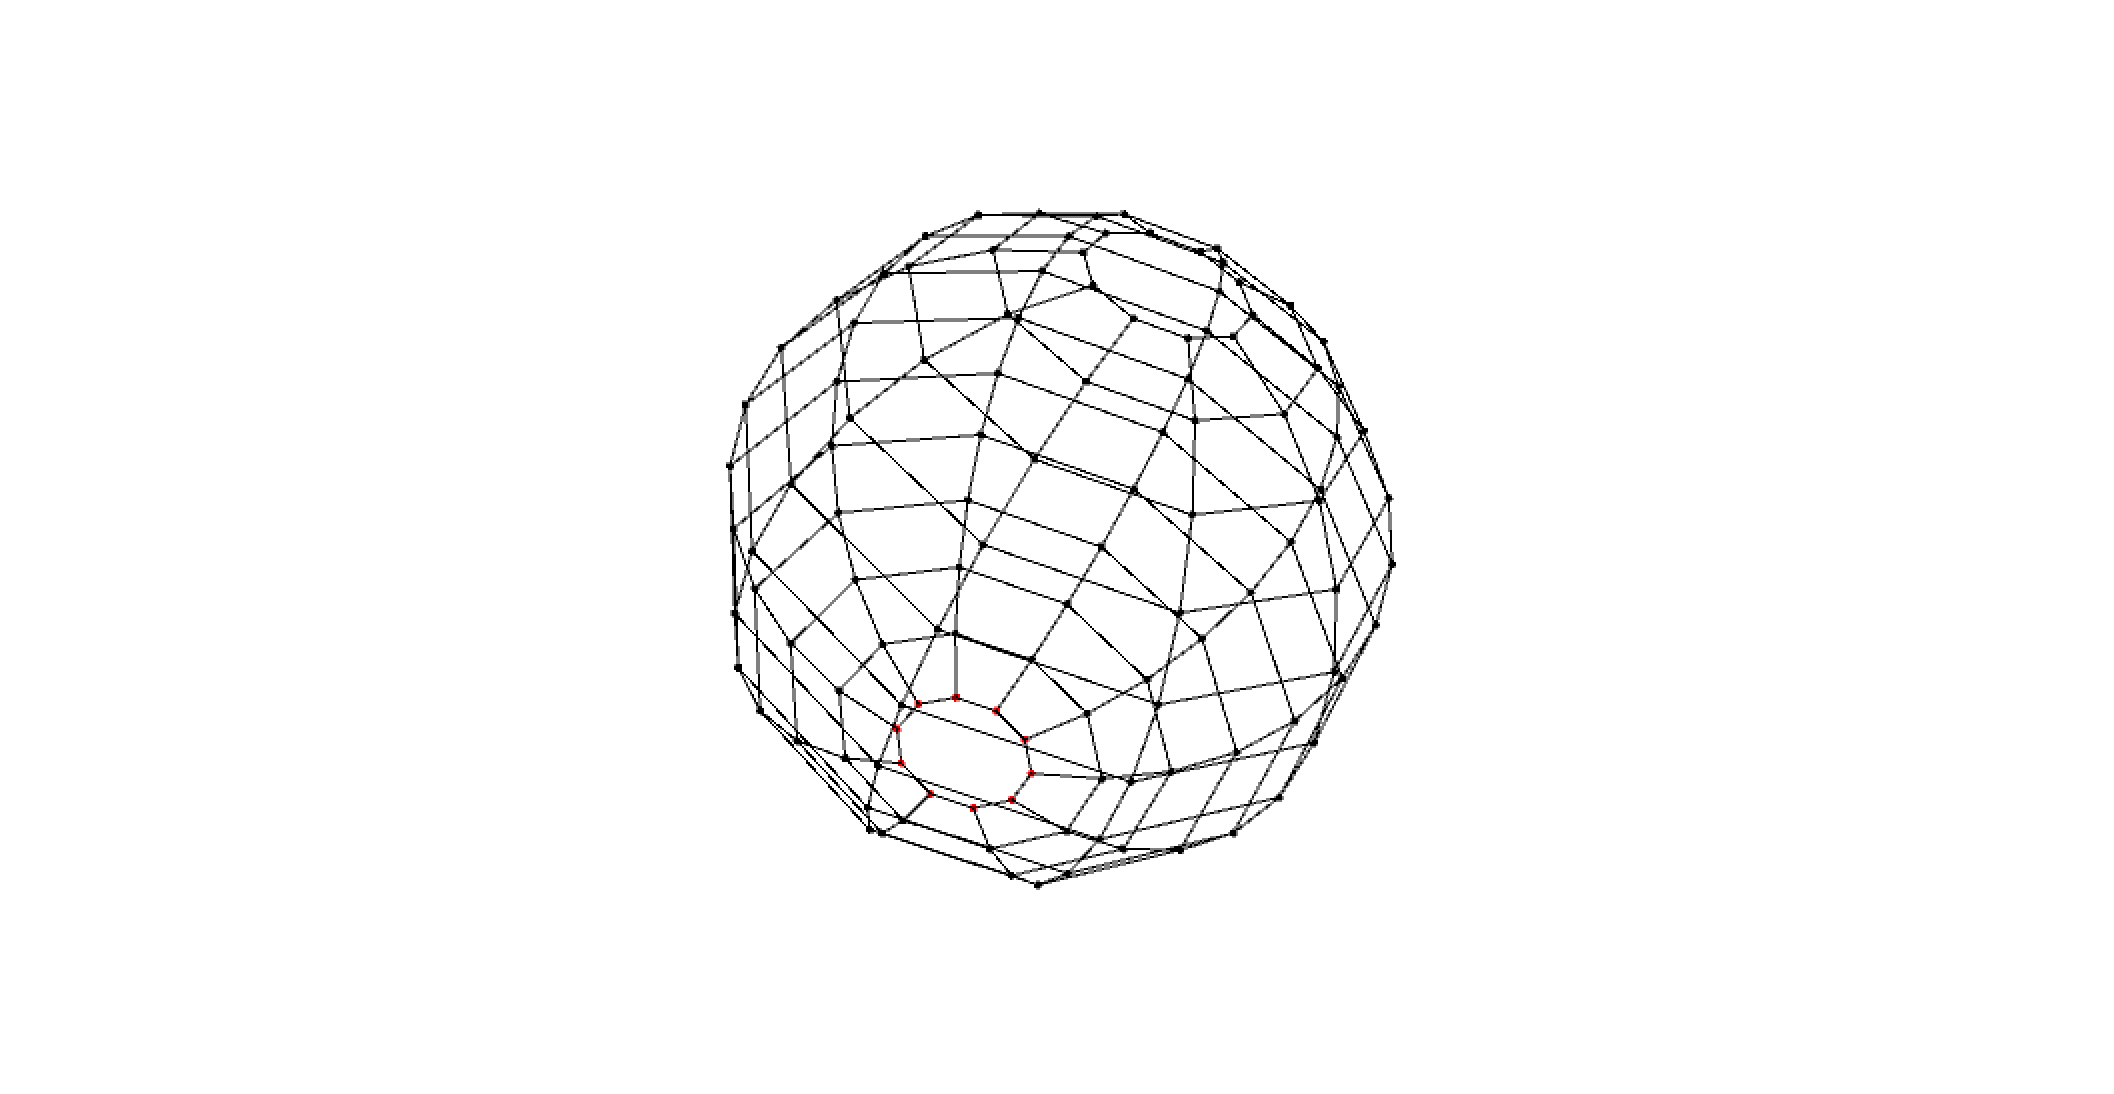
According to the suggestion from Rodger Luo, the TA of MAT259, I drew lines to connect the peak of the pyramid to four of its neighbors and deleted the pyramid. This time, the distance between the peak vertex and the center of the sphere represents the checkout times of one item in a certain month, and I drew a point at the peak vertex to represents the total duration time. The longger the duration time, the larger the point will be.
First, I map the peak vertex I need to the sphere by changing the spherical coordinates into rectangular coordinates.
Next, I imported the dataset.
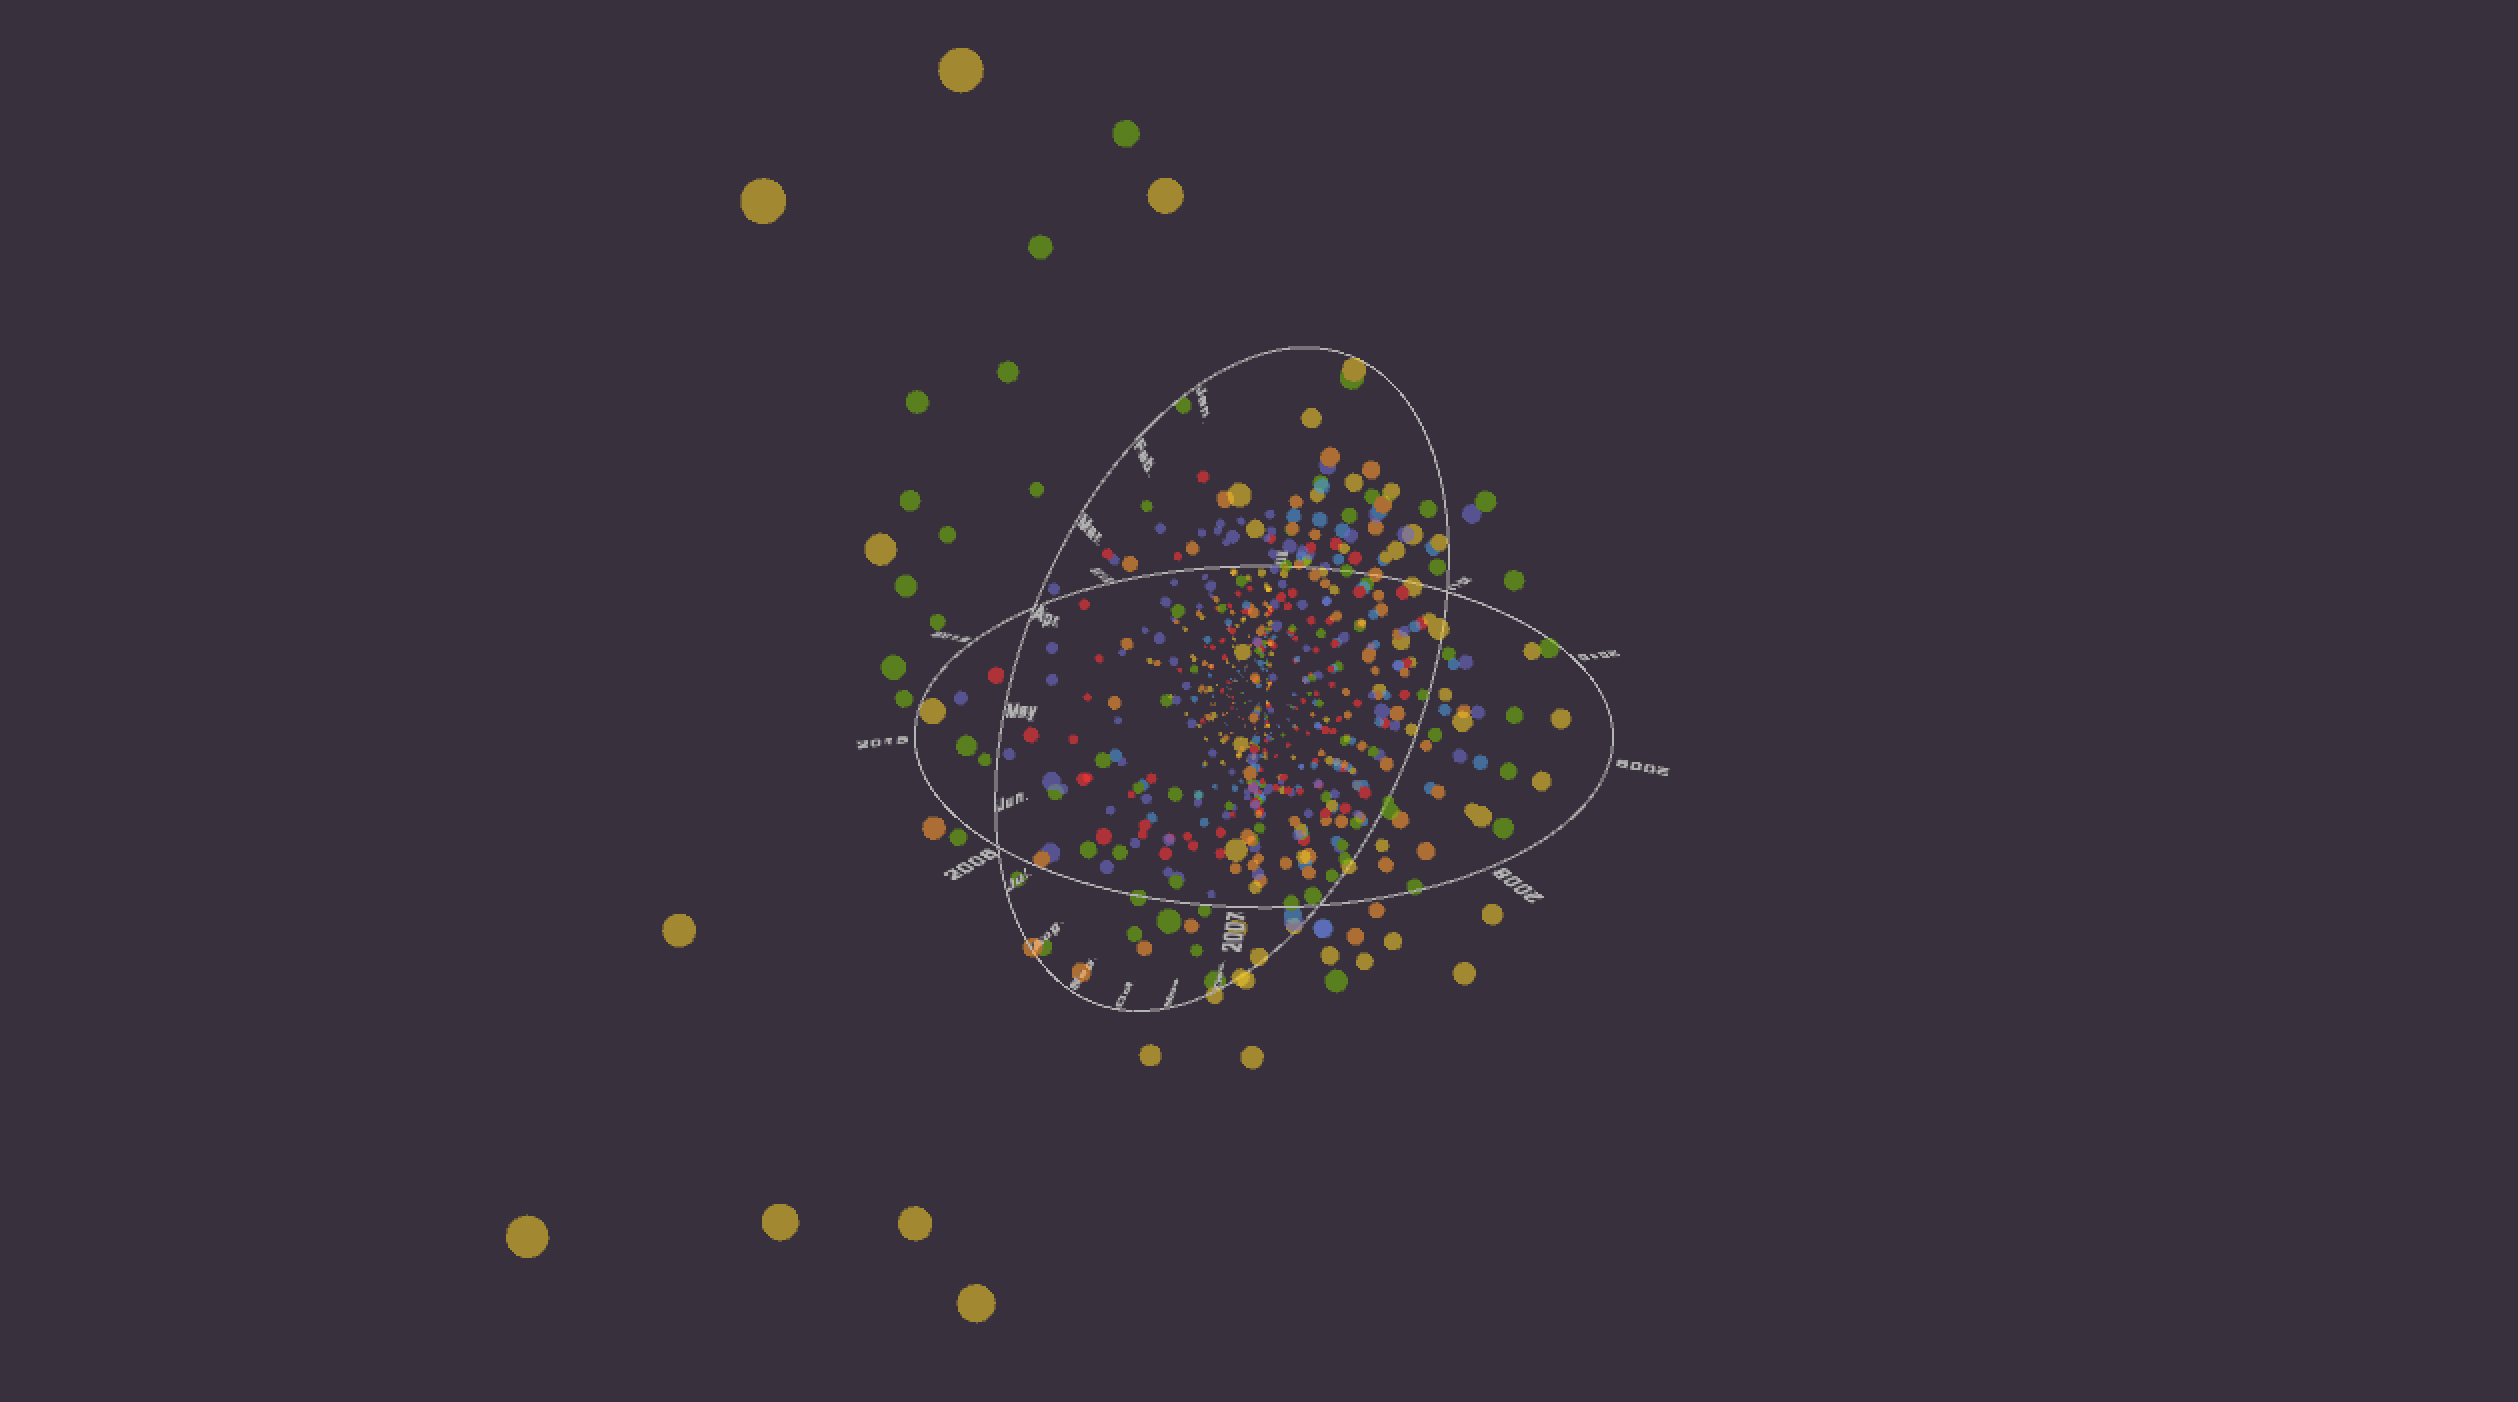
The distance between a peak vertex and the center of the structure represents the total checkout times in one month. And the redius of the dot on the peak vertex represents the total days the items had been borrowed.
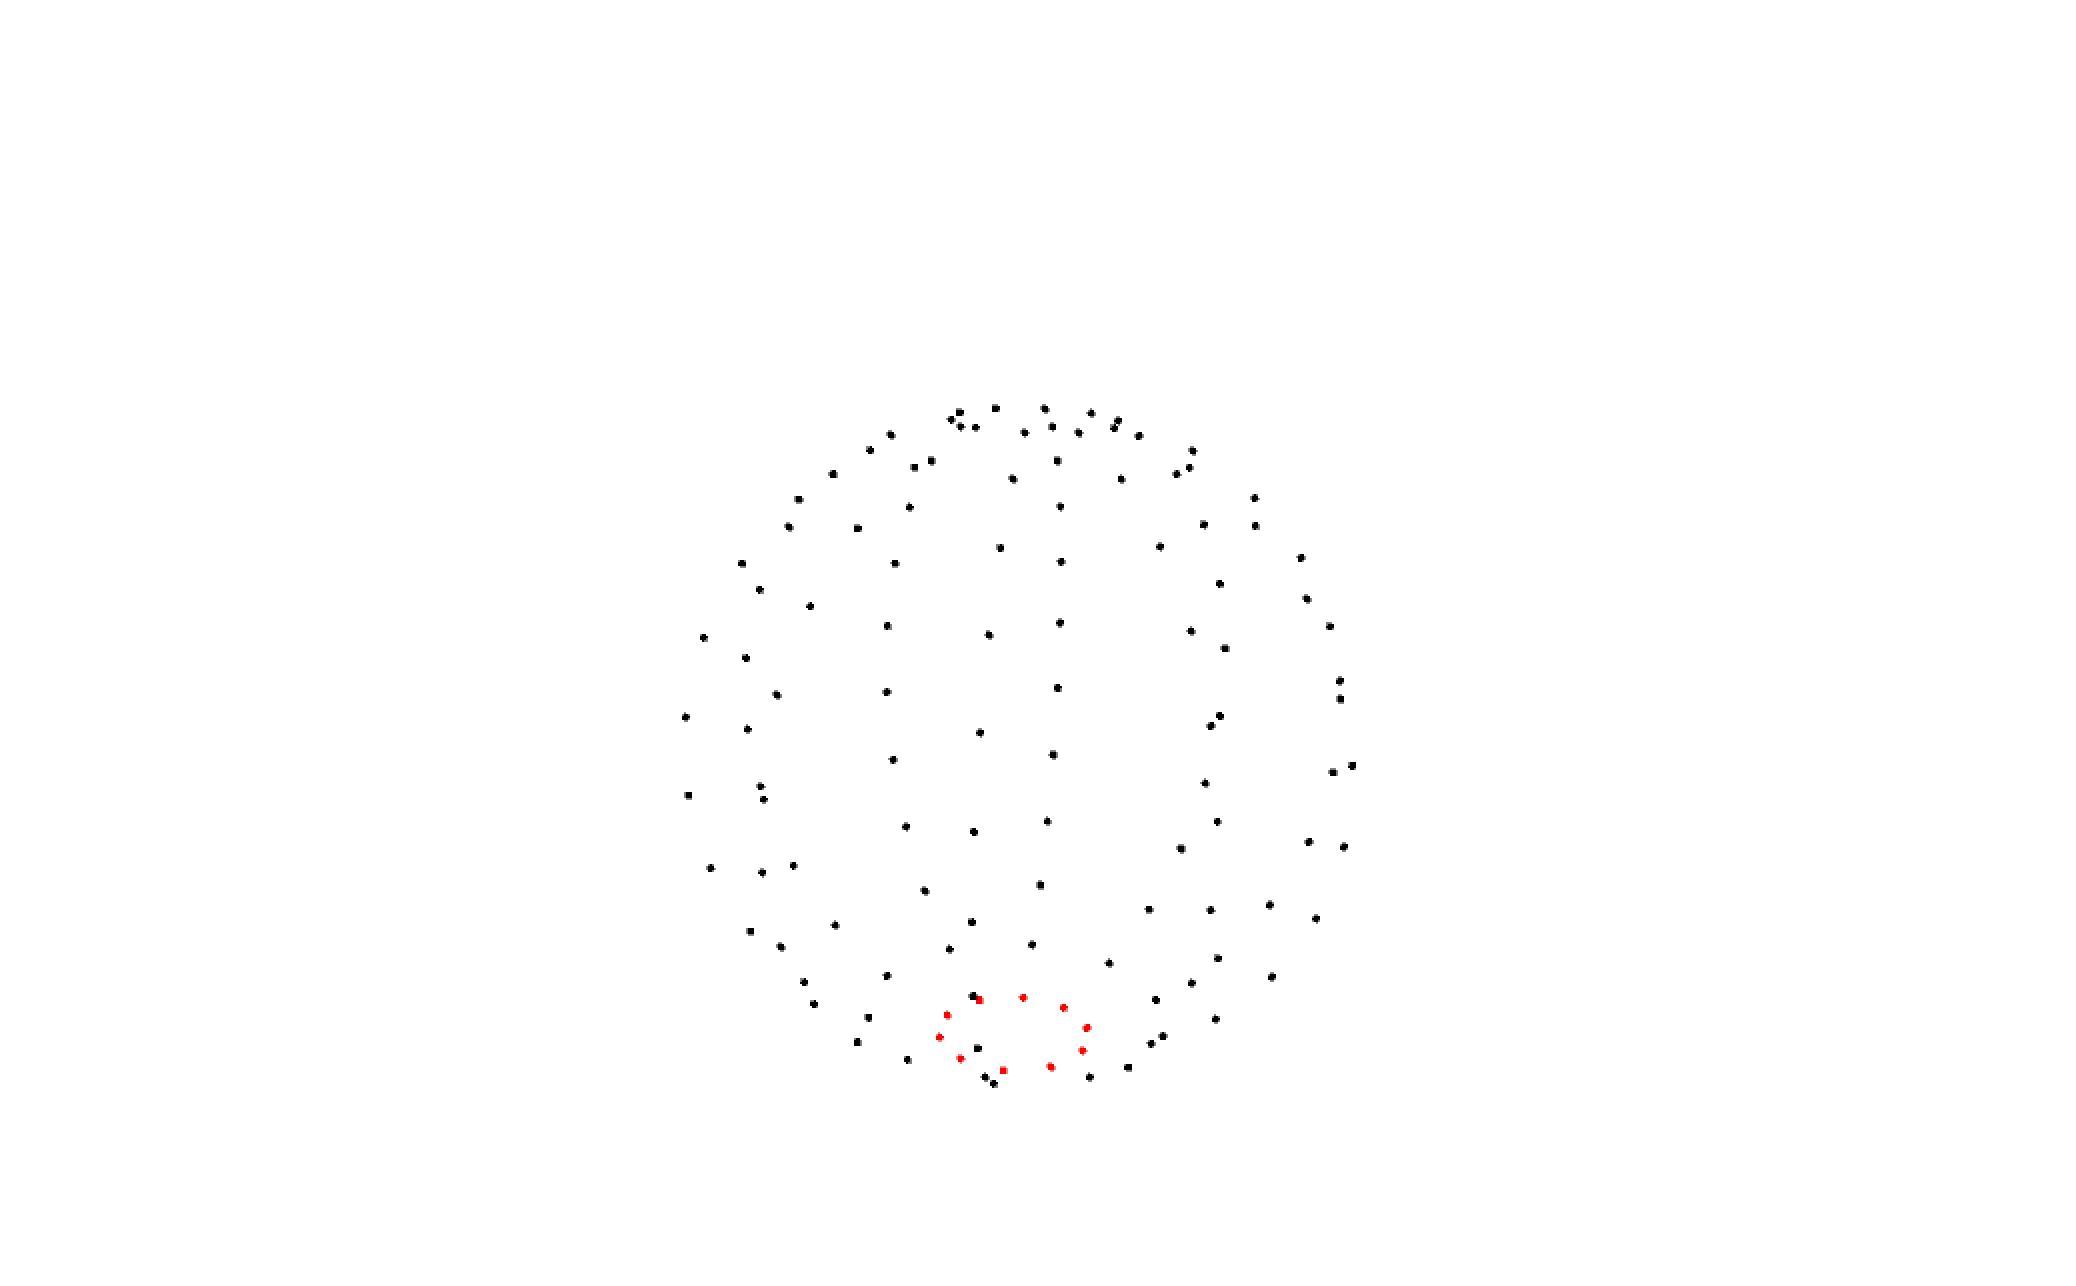
I added a circular cordinates and lables.
The final version of the prototype.
I reversed pyramids upside down because I think this may clarify the data and maybe beautify it. The result is still not good enough.
According to the suggestion from Rodger Luo, the TA of MAT259, I drew lines to connect the peak of the pyramid to four of its neighbors and deleted the pyramid. This time, the distance between the peak vertex and the center of the sphere represents the checkout times of one item in a certain month, and I drew a point at the peak vertex to represents the total duration time. The longger the duration time, the larger the point will be.
First, I map the peak vertex I need to the sphere by changing the spherical coordinates into rectangular coordinates.
Next, I imported the dataset.
The distance between a peak vertex and the center of the structure represents the total checkout times in one month. And the redius of the dot on the peak vertex represents the total days the items had been borrowed.
I added a circular cordinates and lables.
The final version of the prototype.
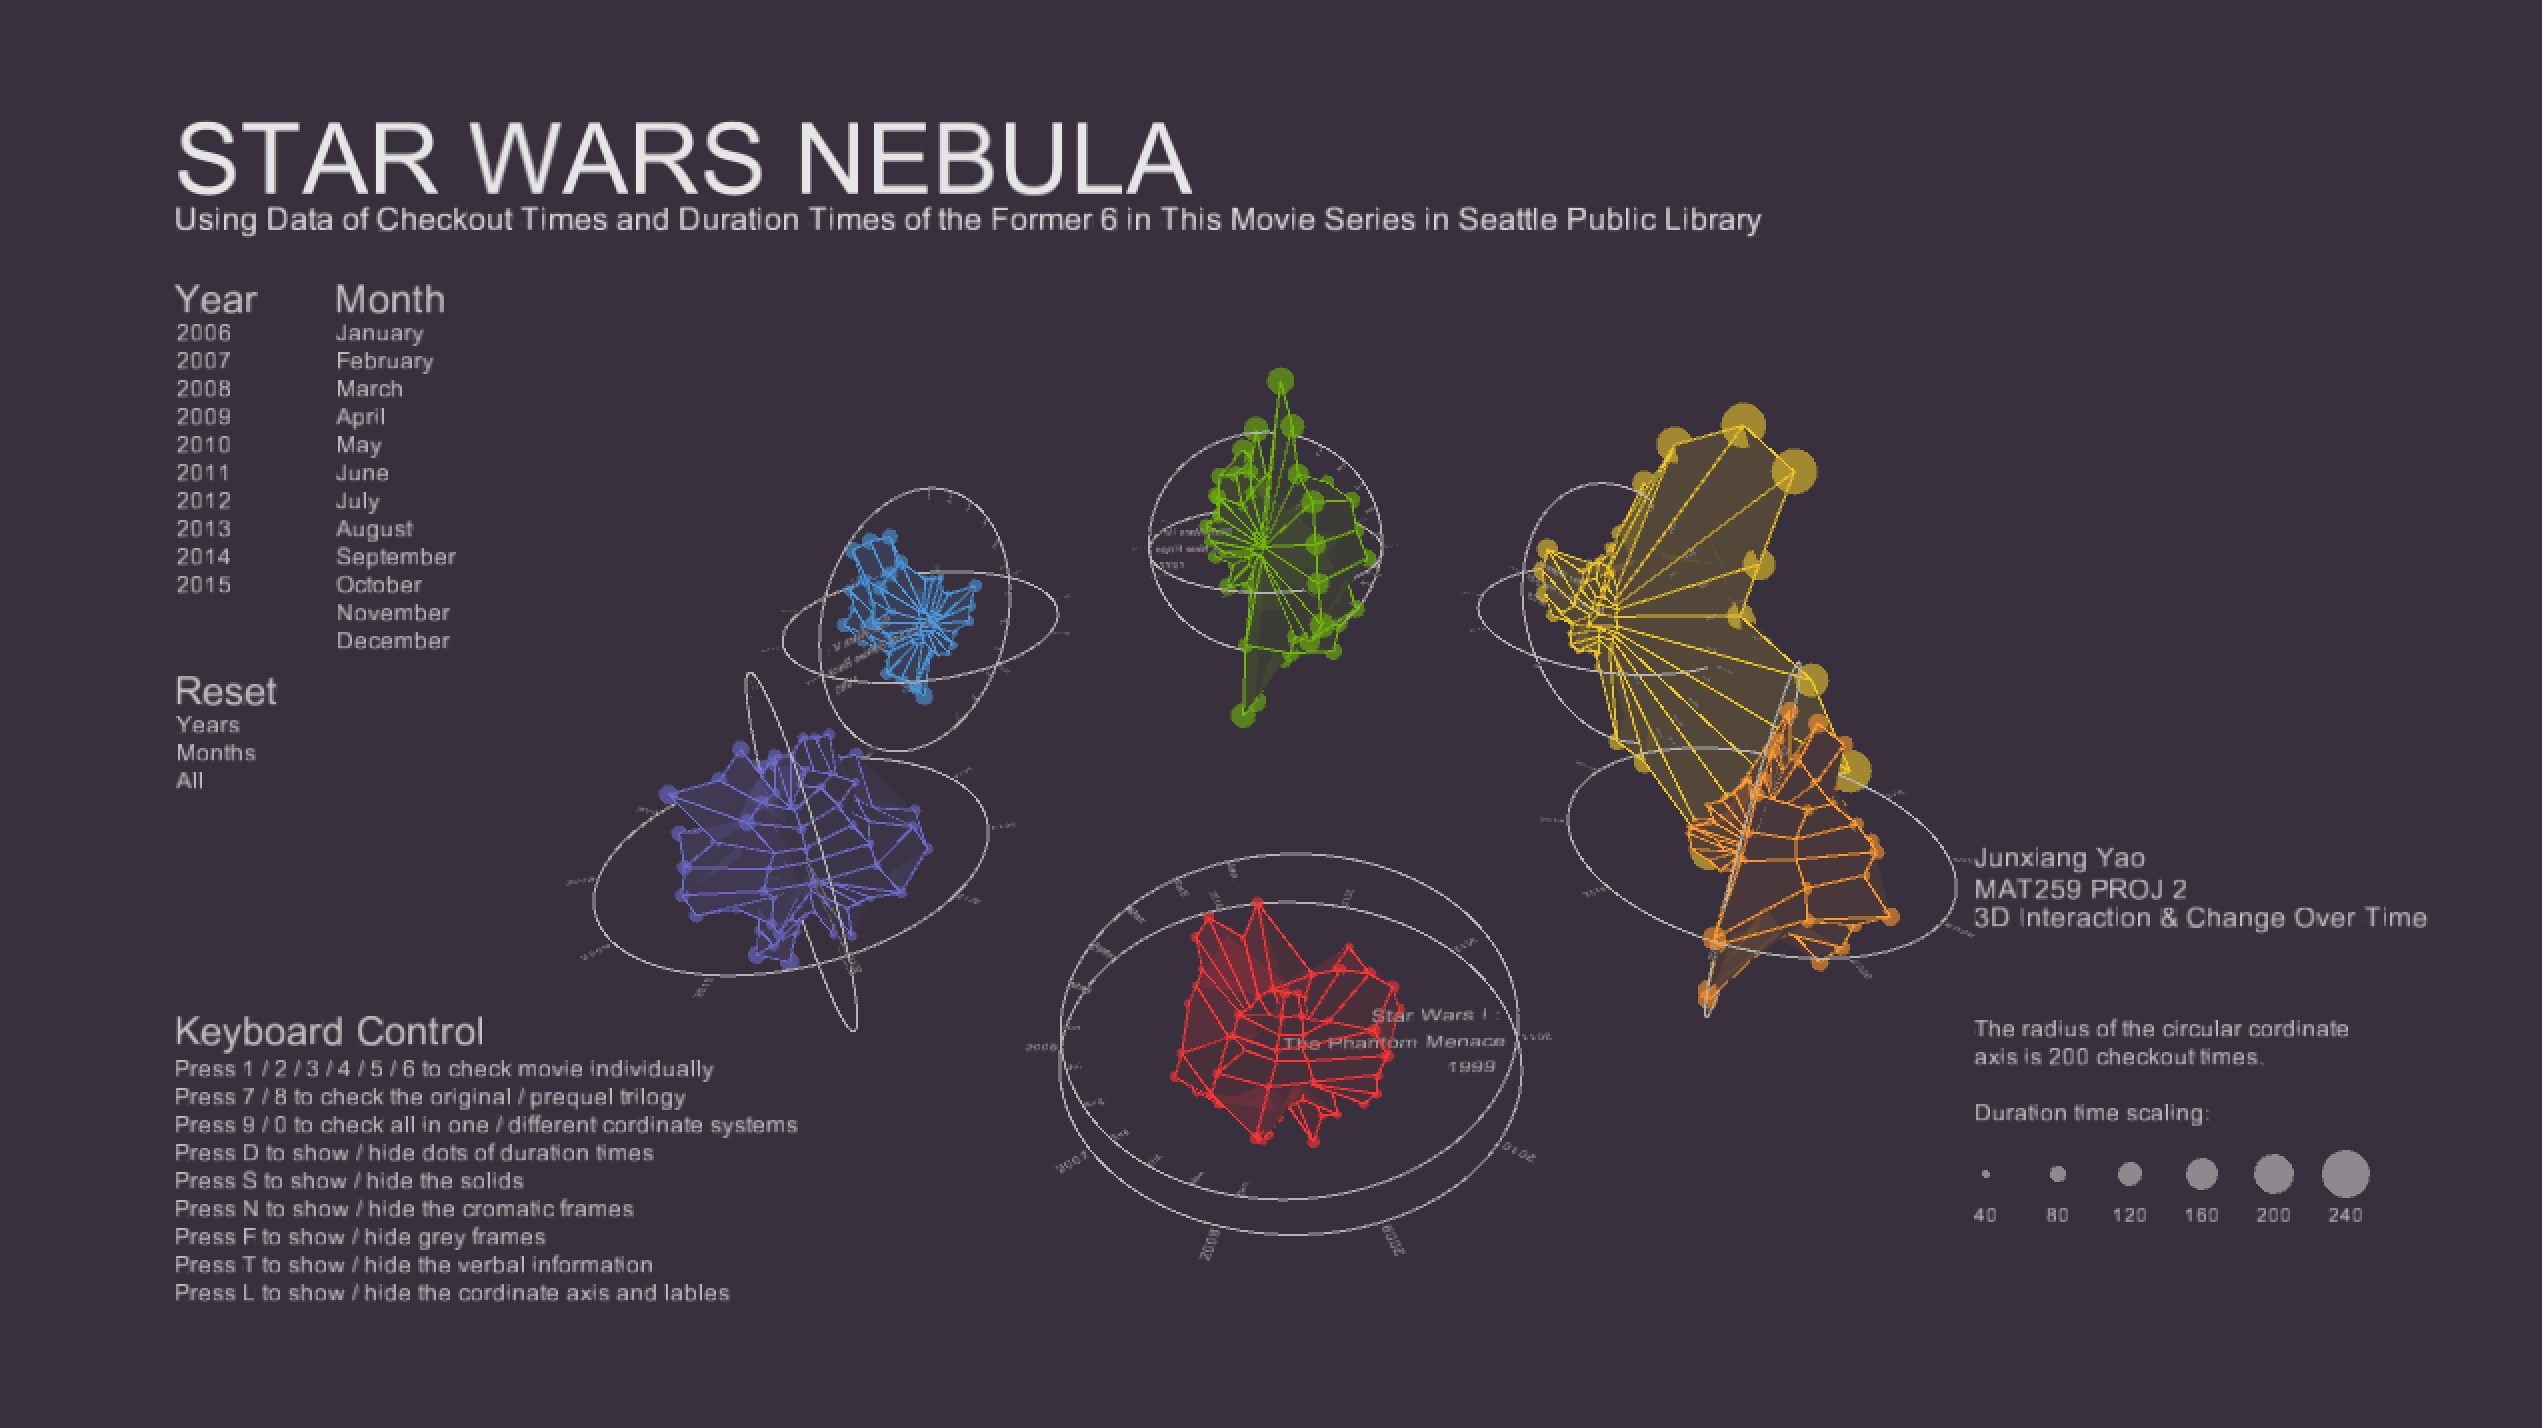
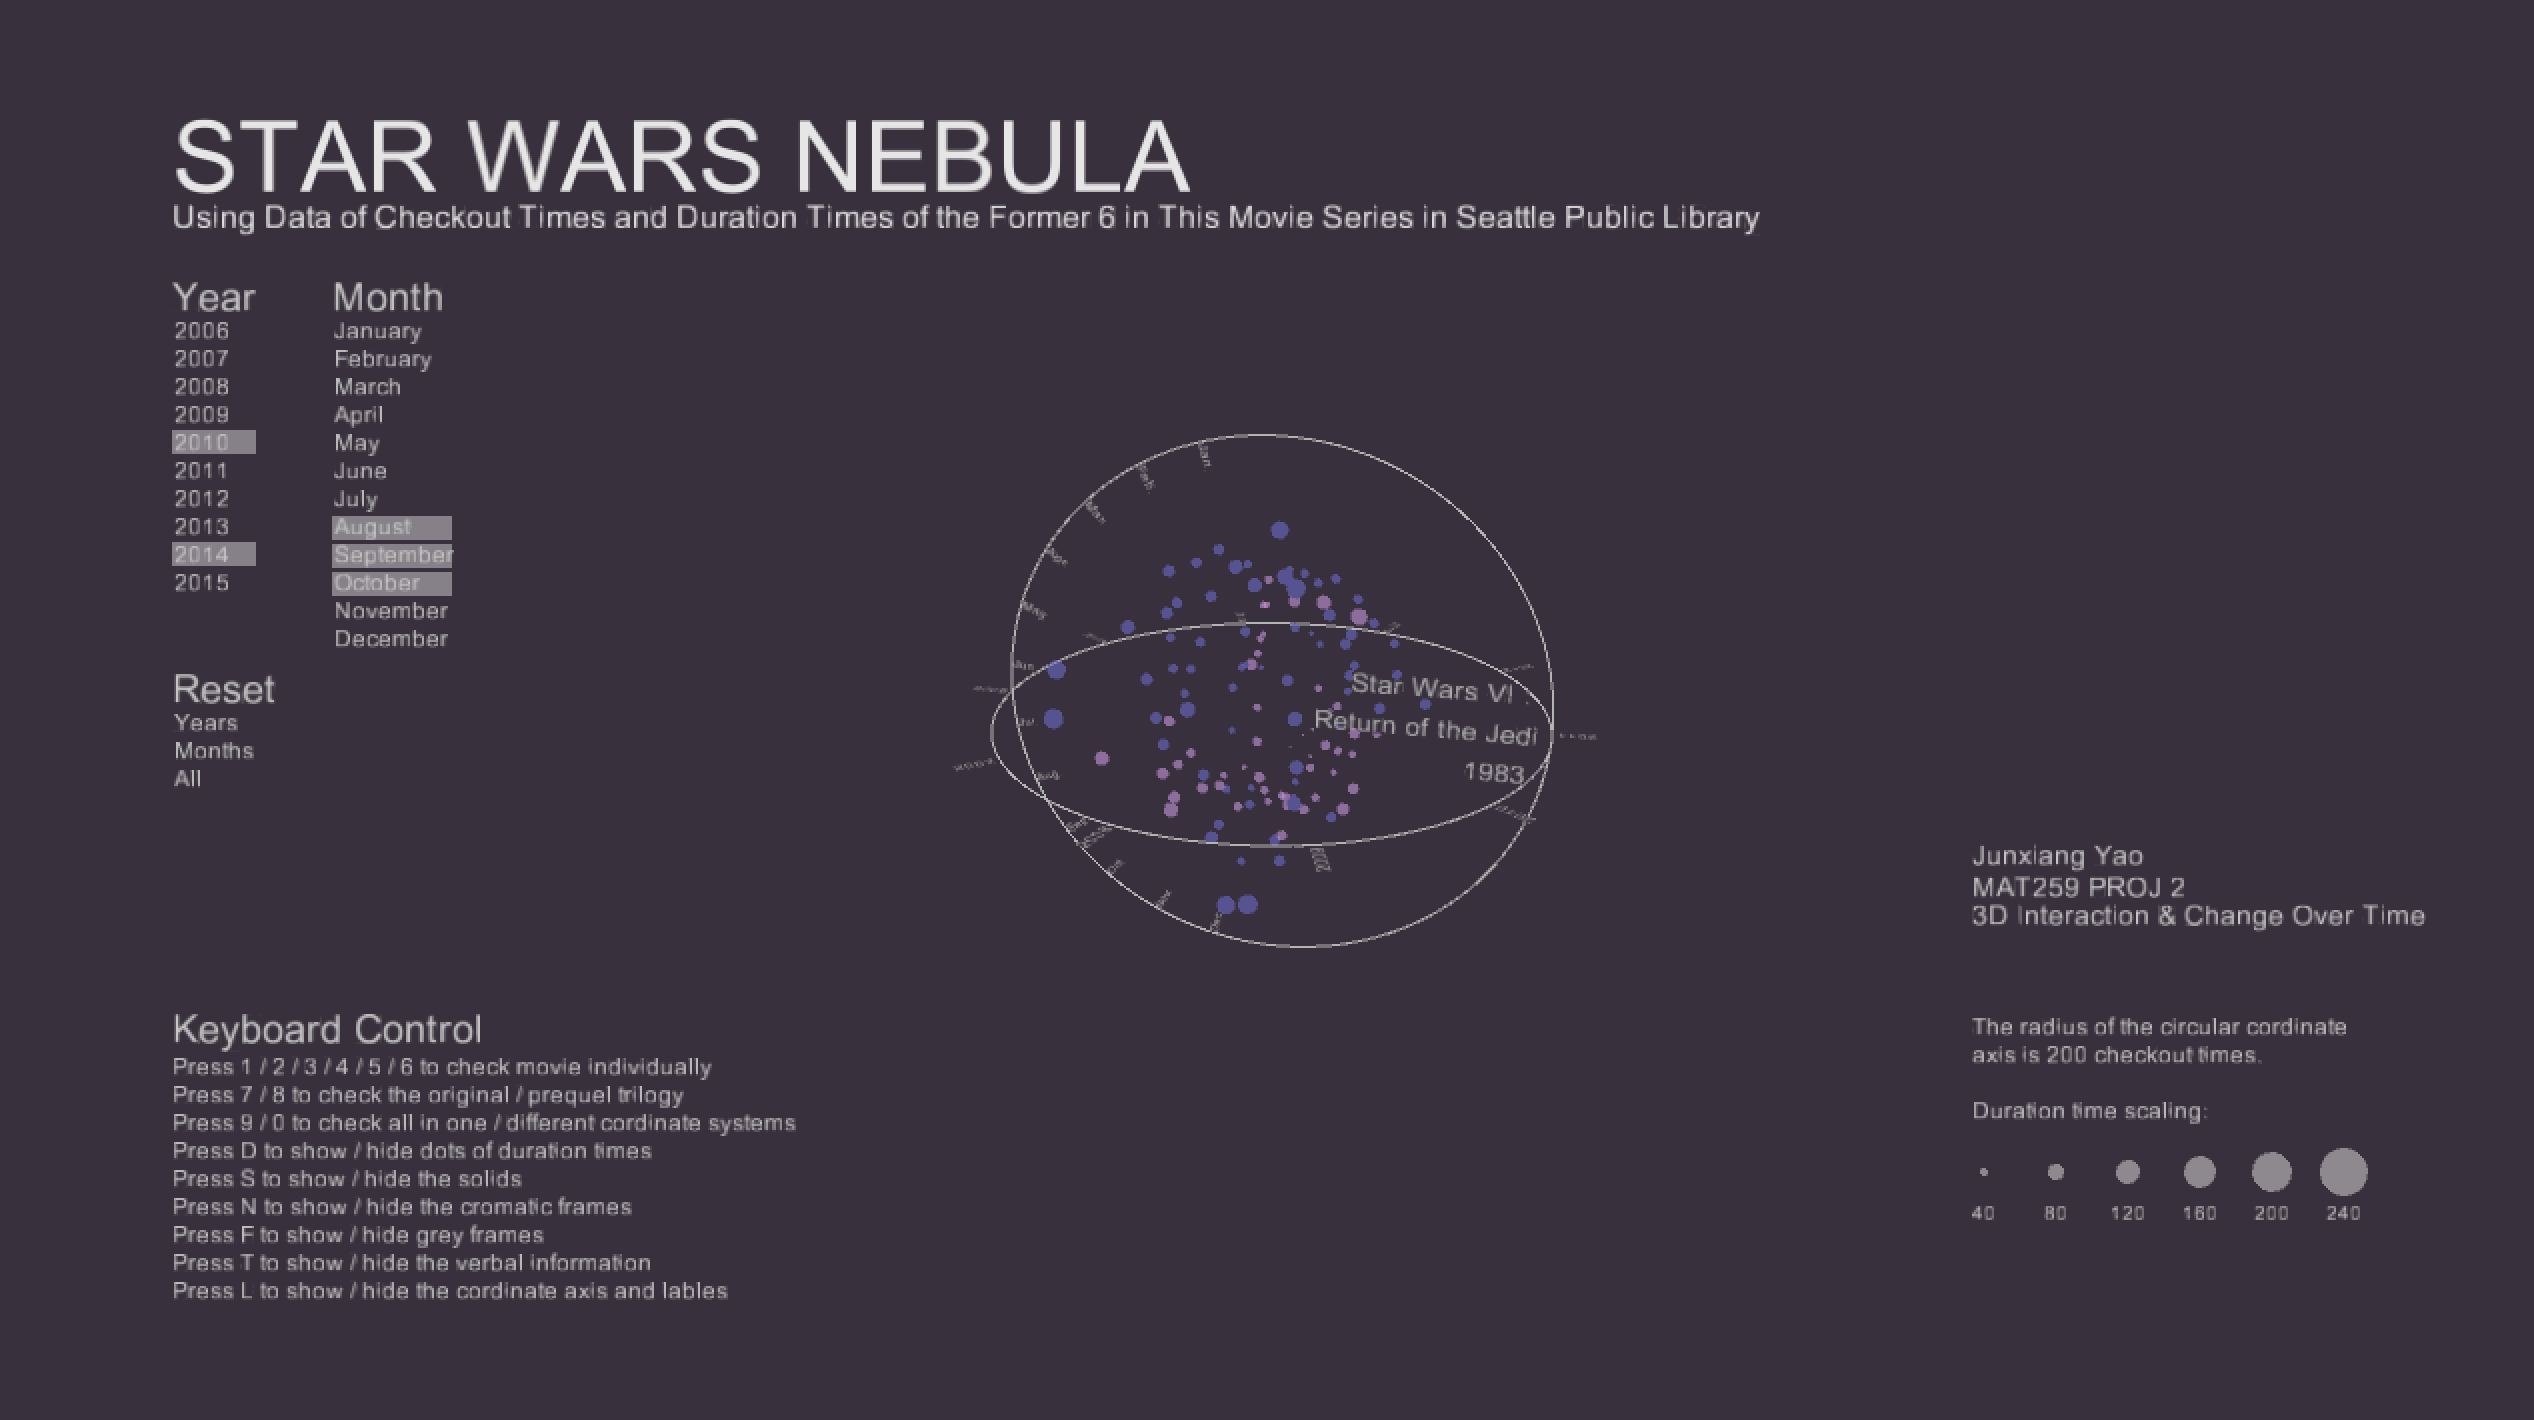
Final result
Usage:
* Press 1 / 2 / 3 / 4 / 5 / 6 to check movie individually.
* Press 7 / 8 to check the original / prequel trilogy.
* Press 9 / 0 to check all in one / different cordinate systems.
* Press D to show / hide dots of duration times.
* Press S to show / hide the solids.
* Press N to show / hide the cromatic frames.
* Press F to show / hide grey frames.
* Press T to show / hide the verbal information.
* Press L to show / hide the cordinate axis and lables.
* Press G to show / hide the grid system.
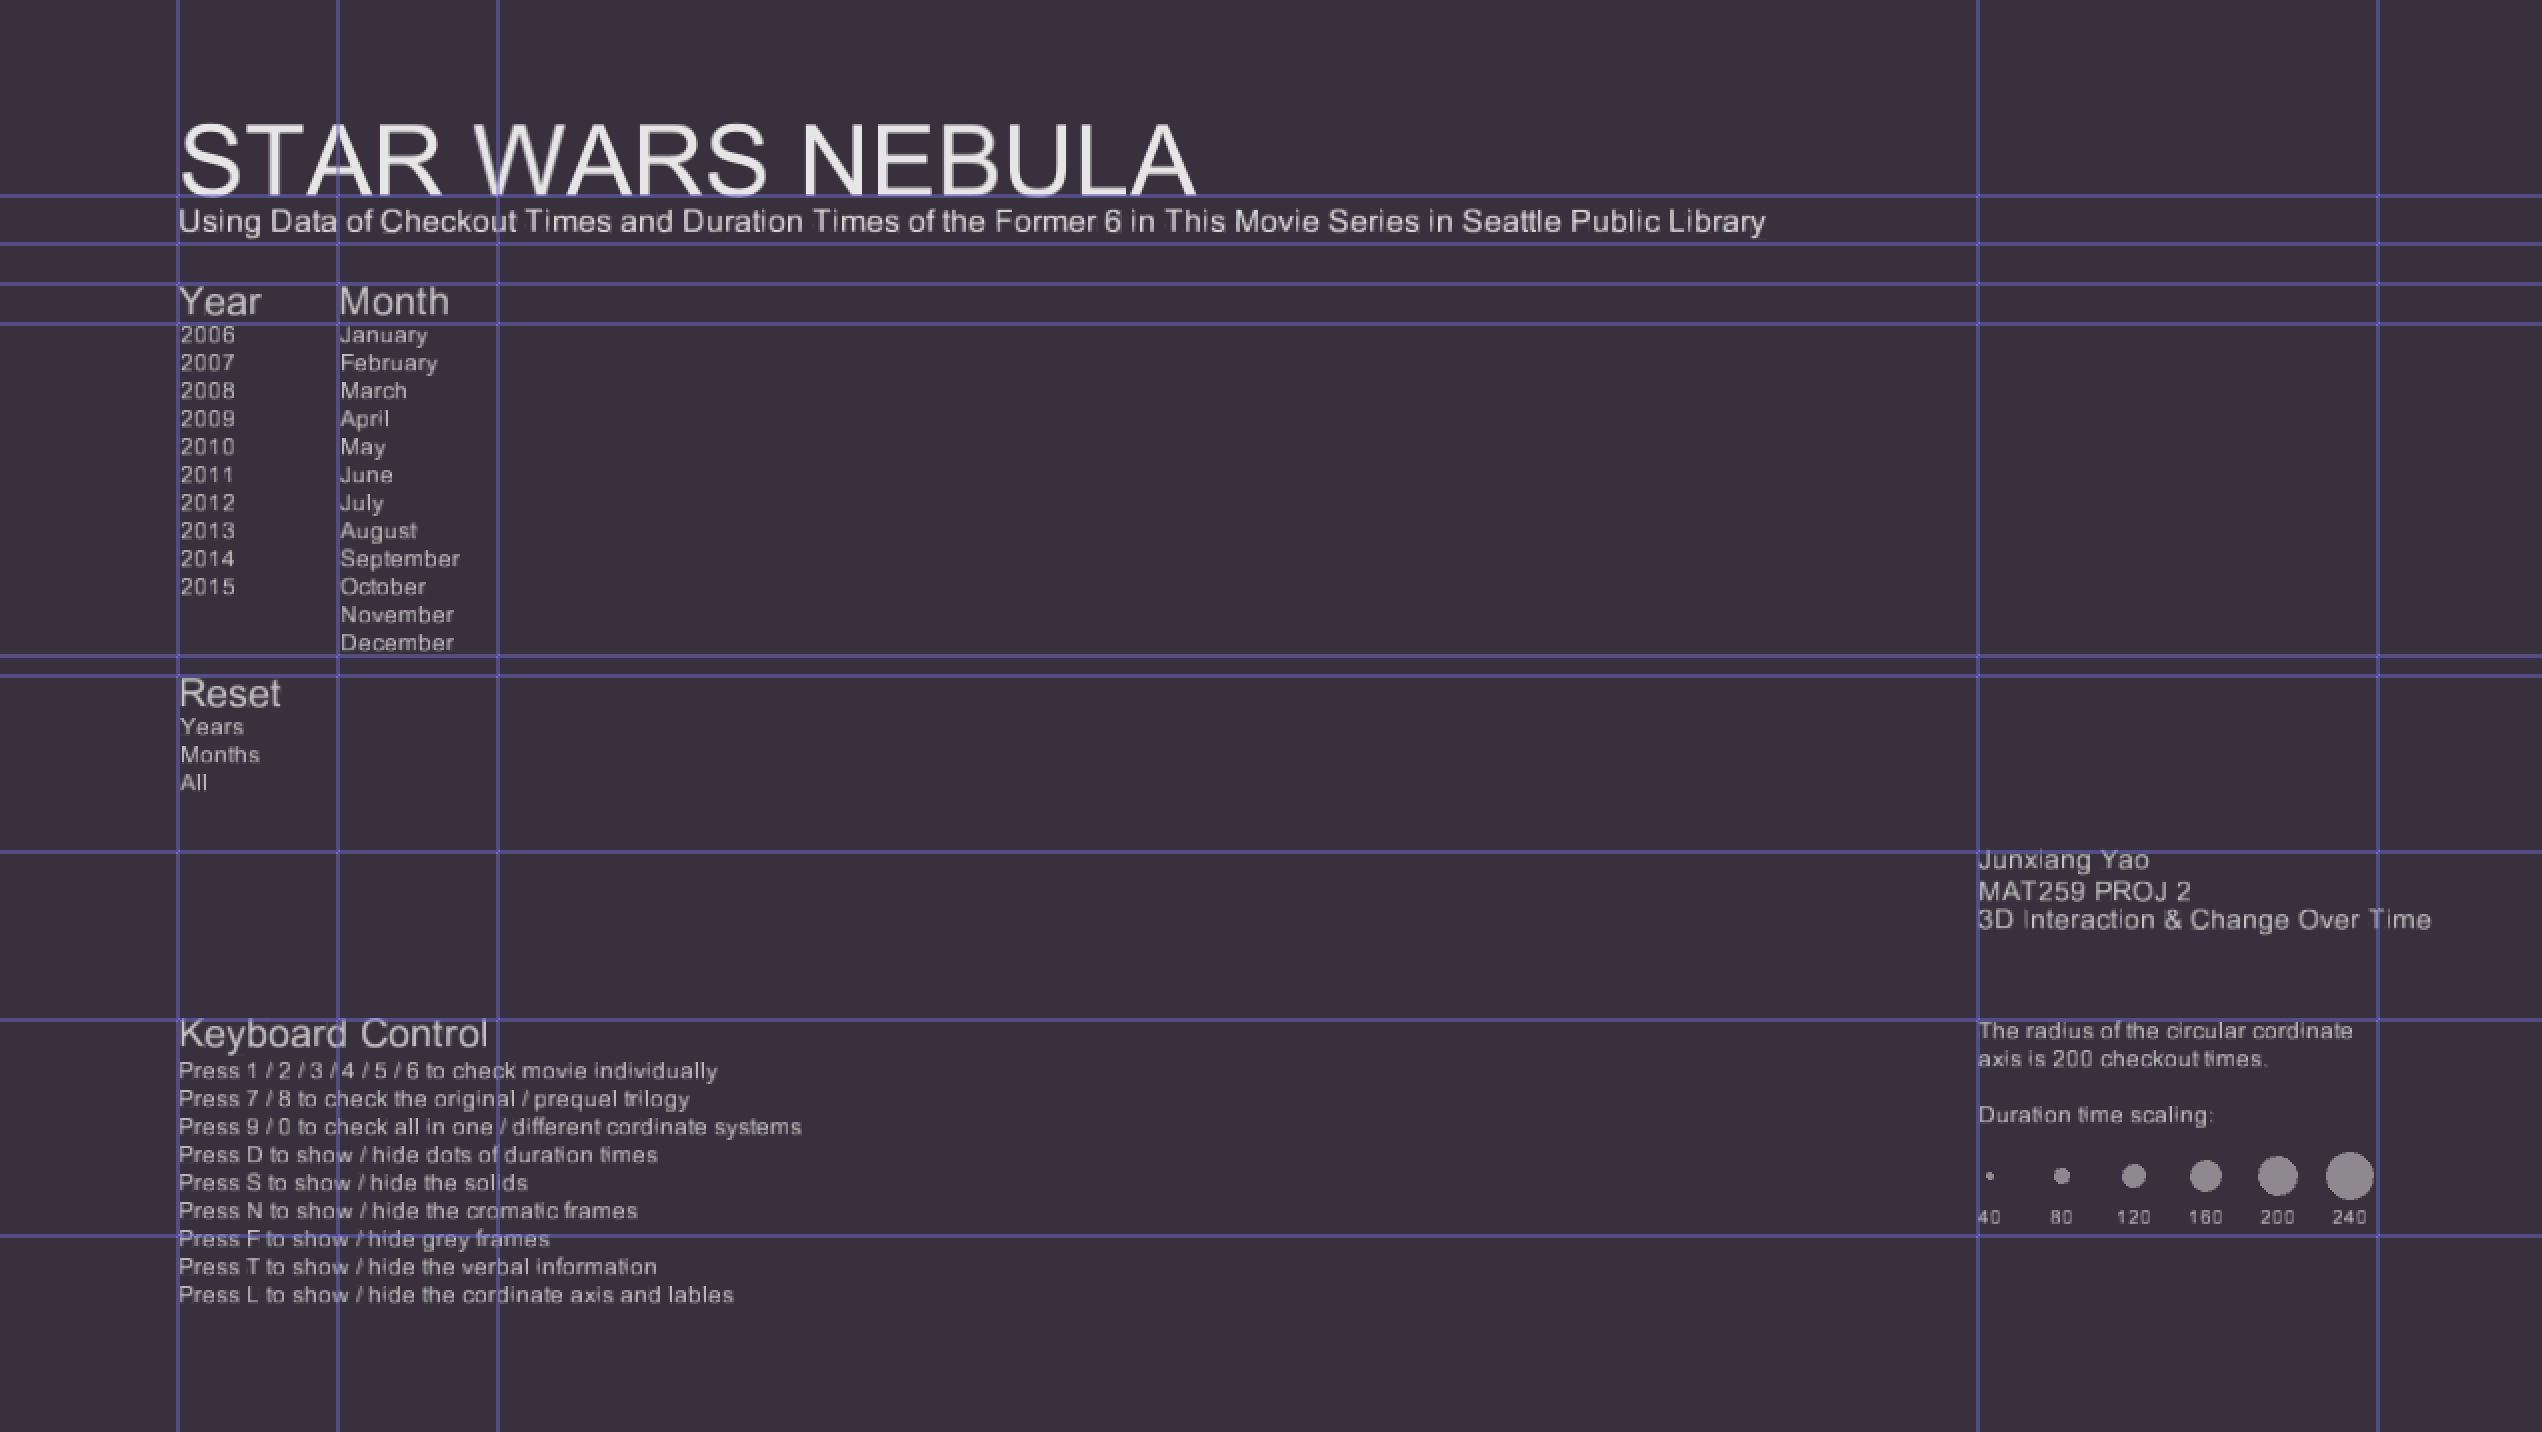
I used grid system to design the layout.
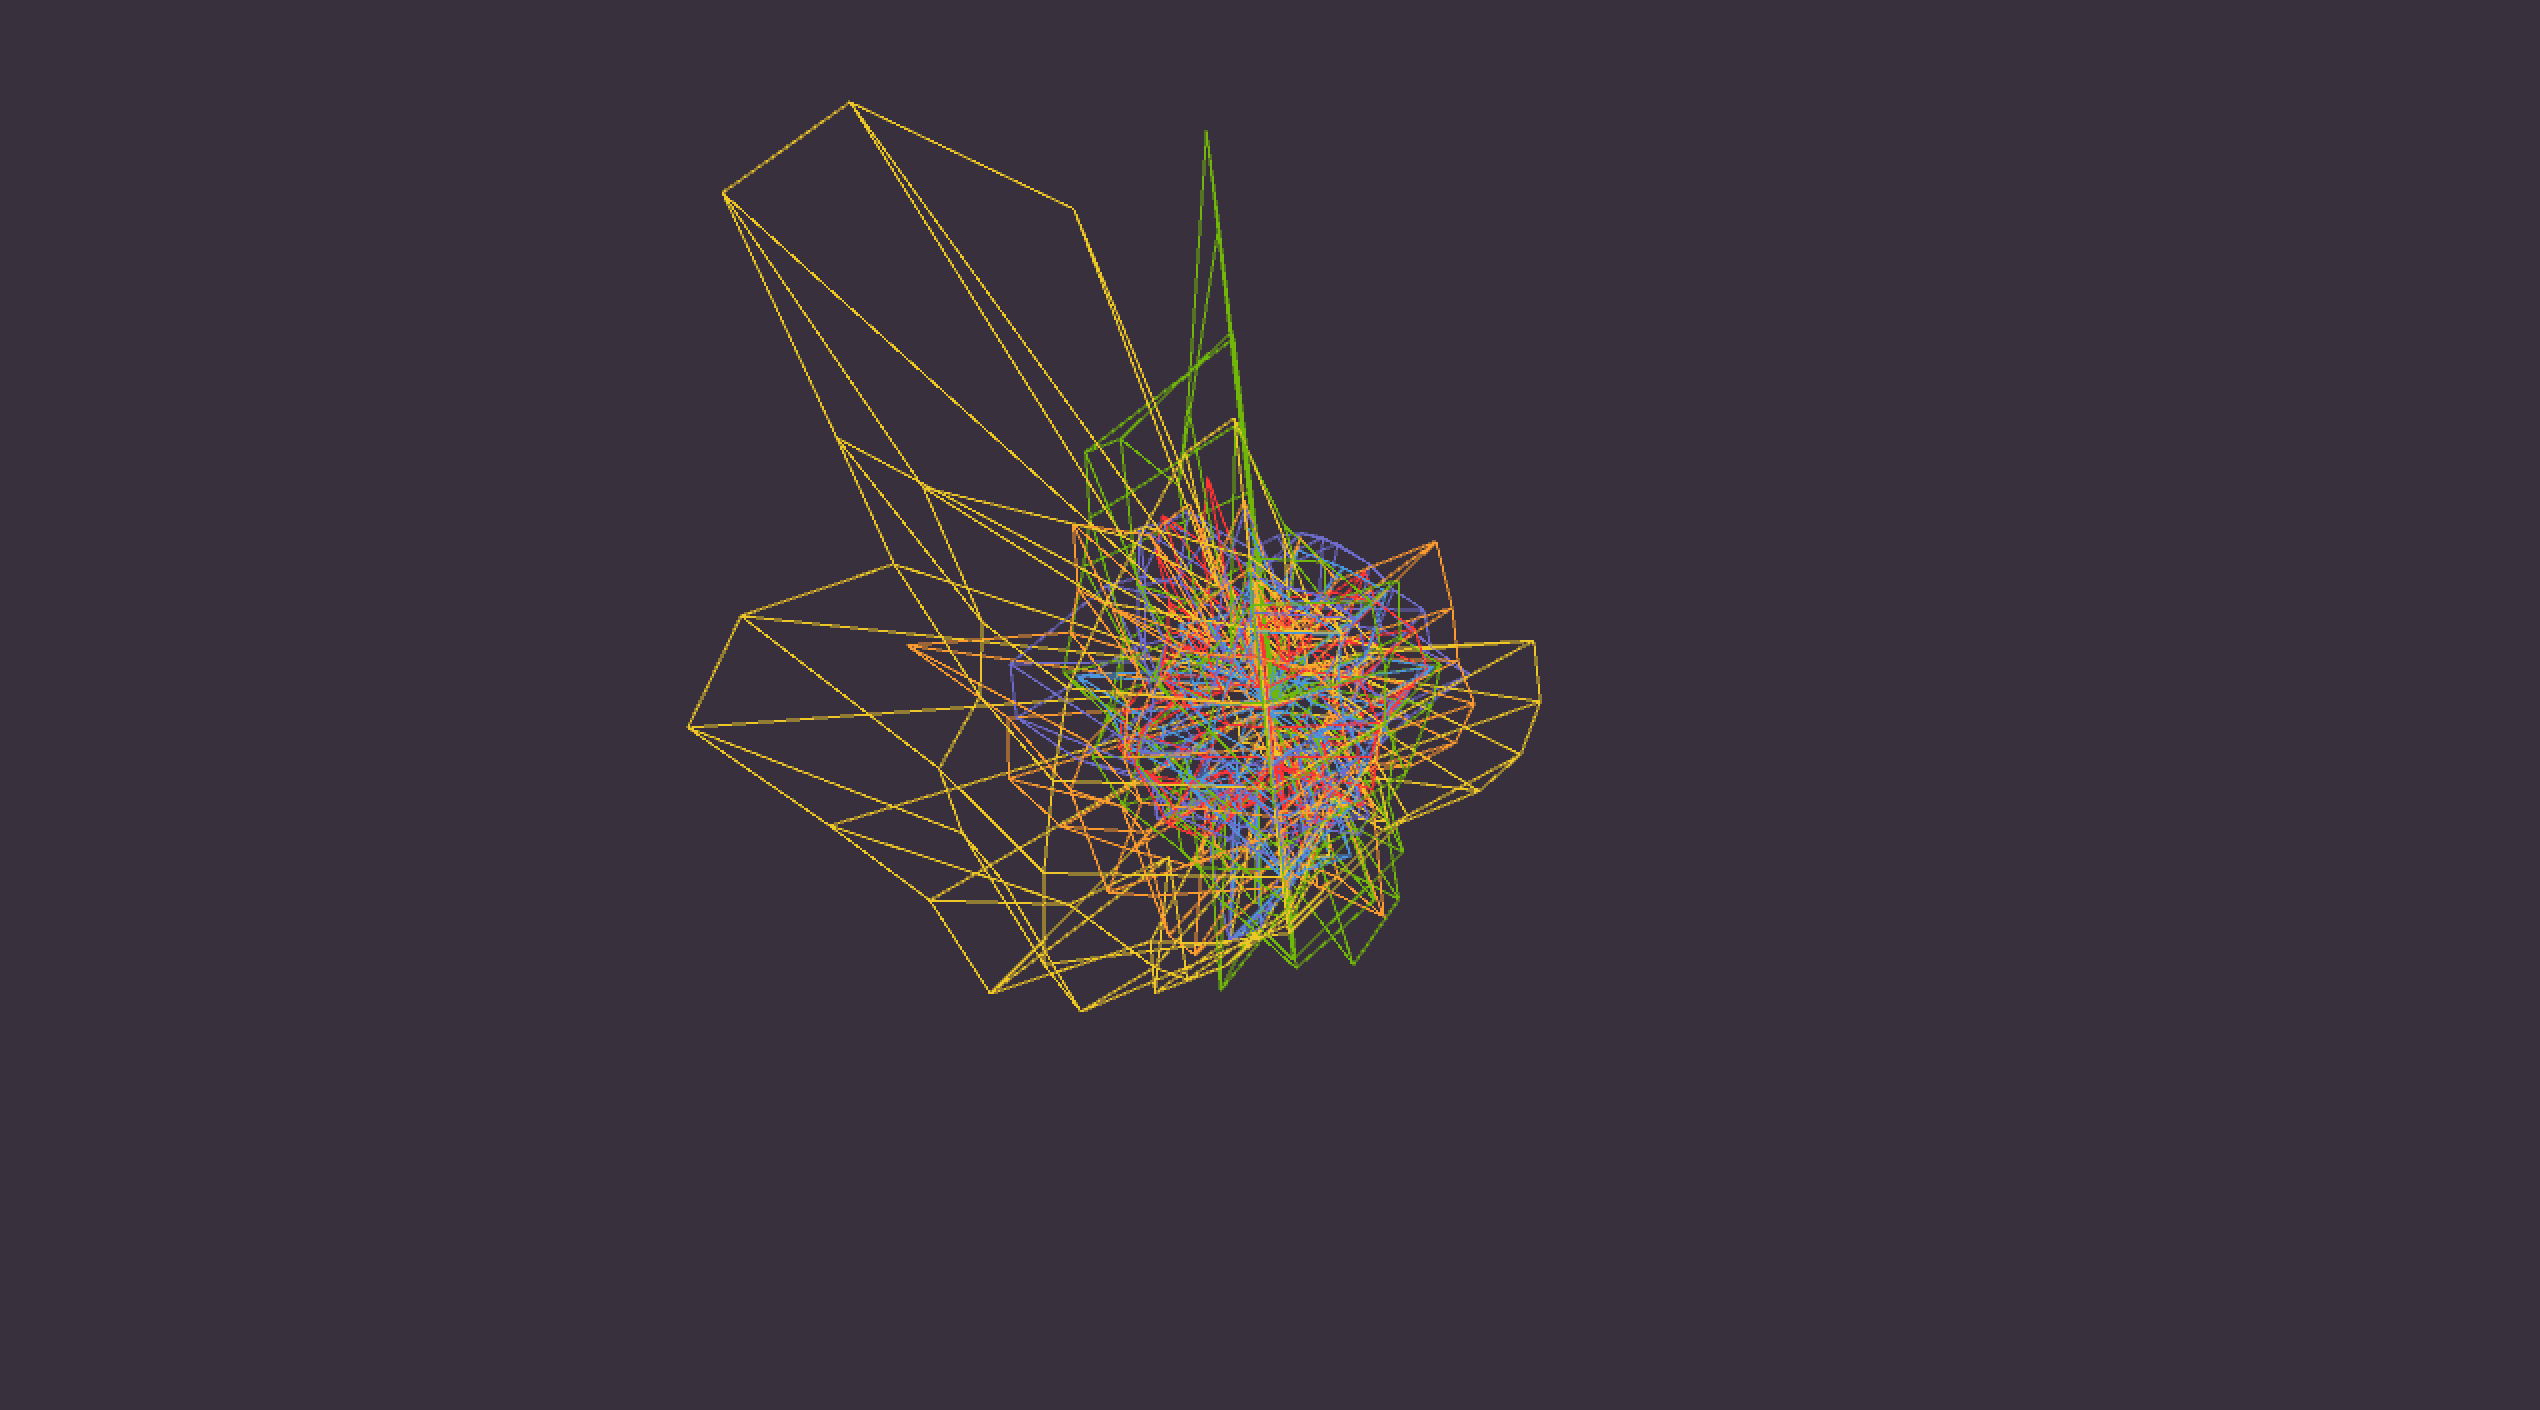
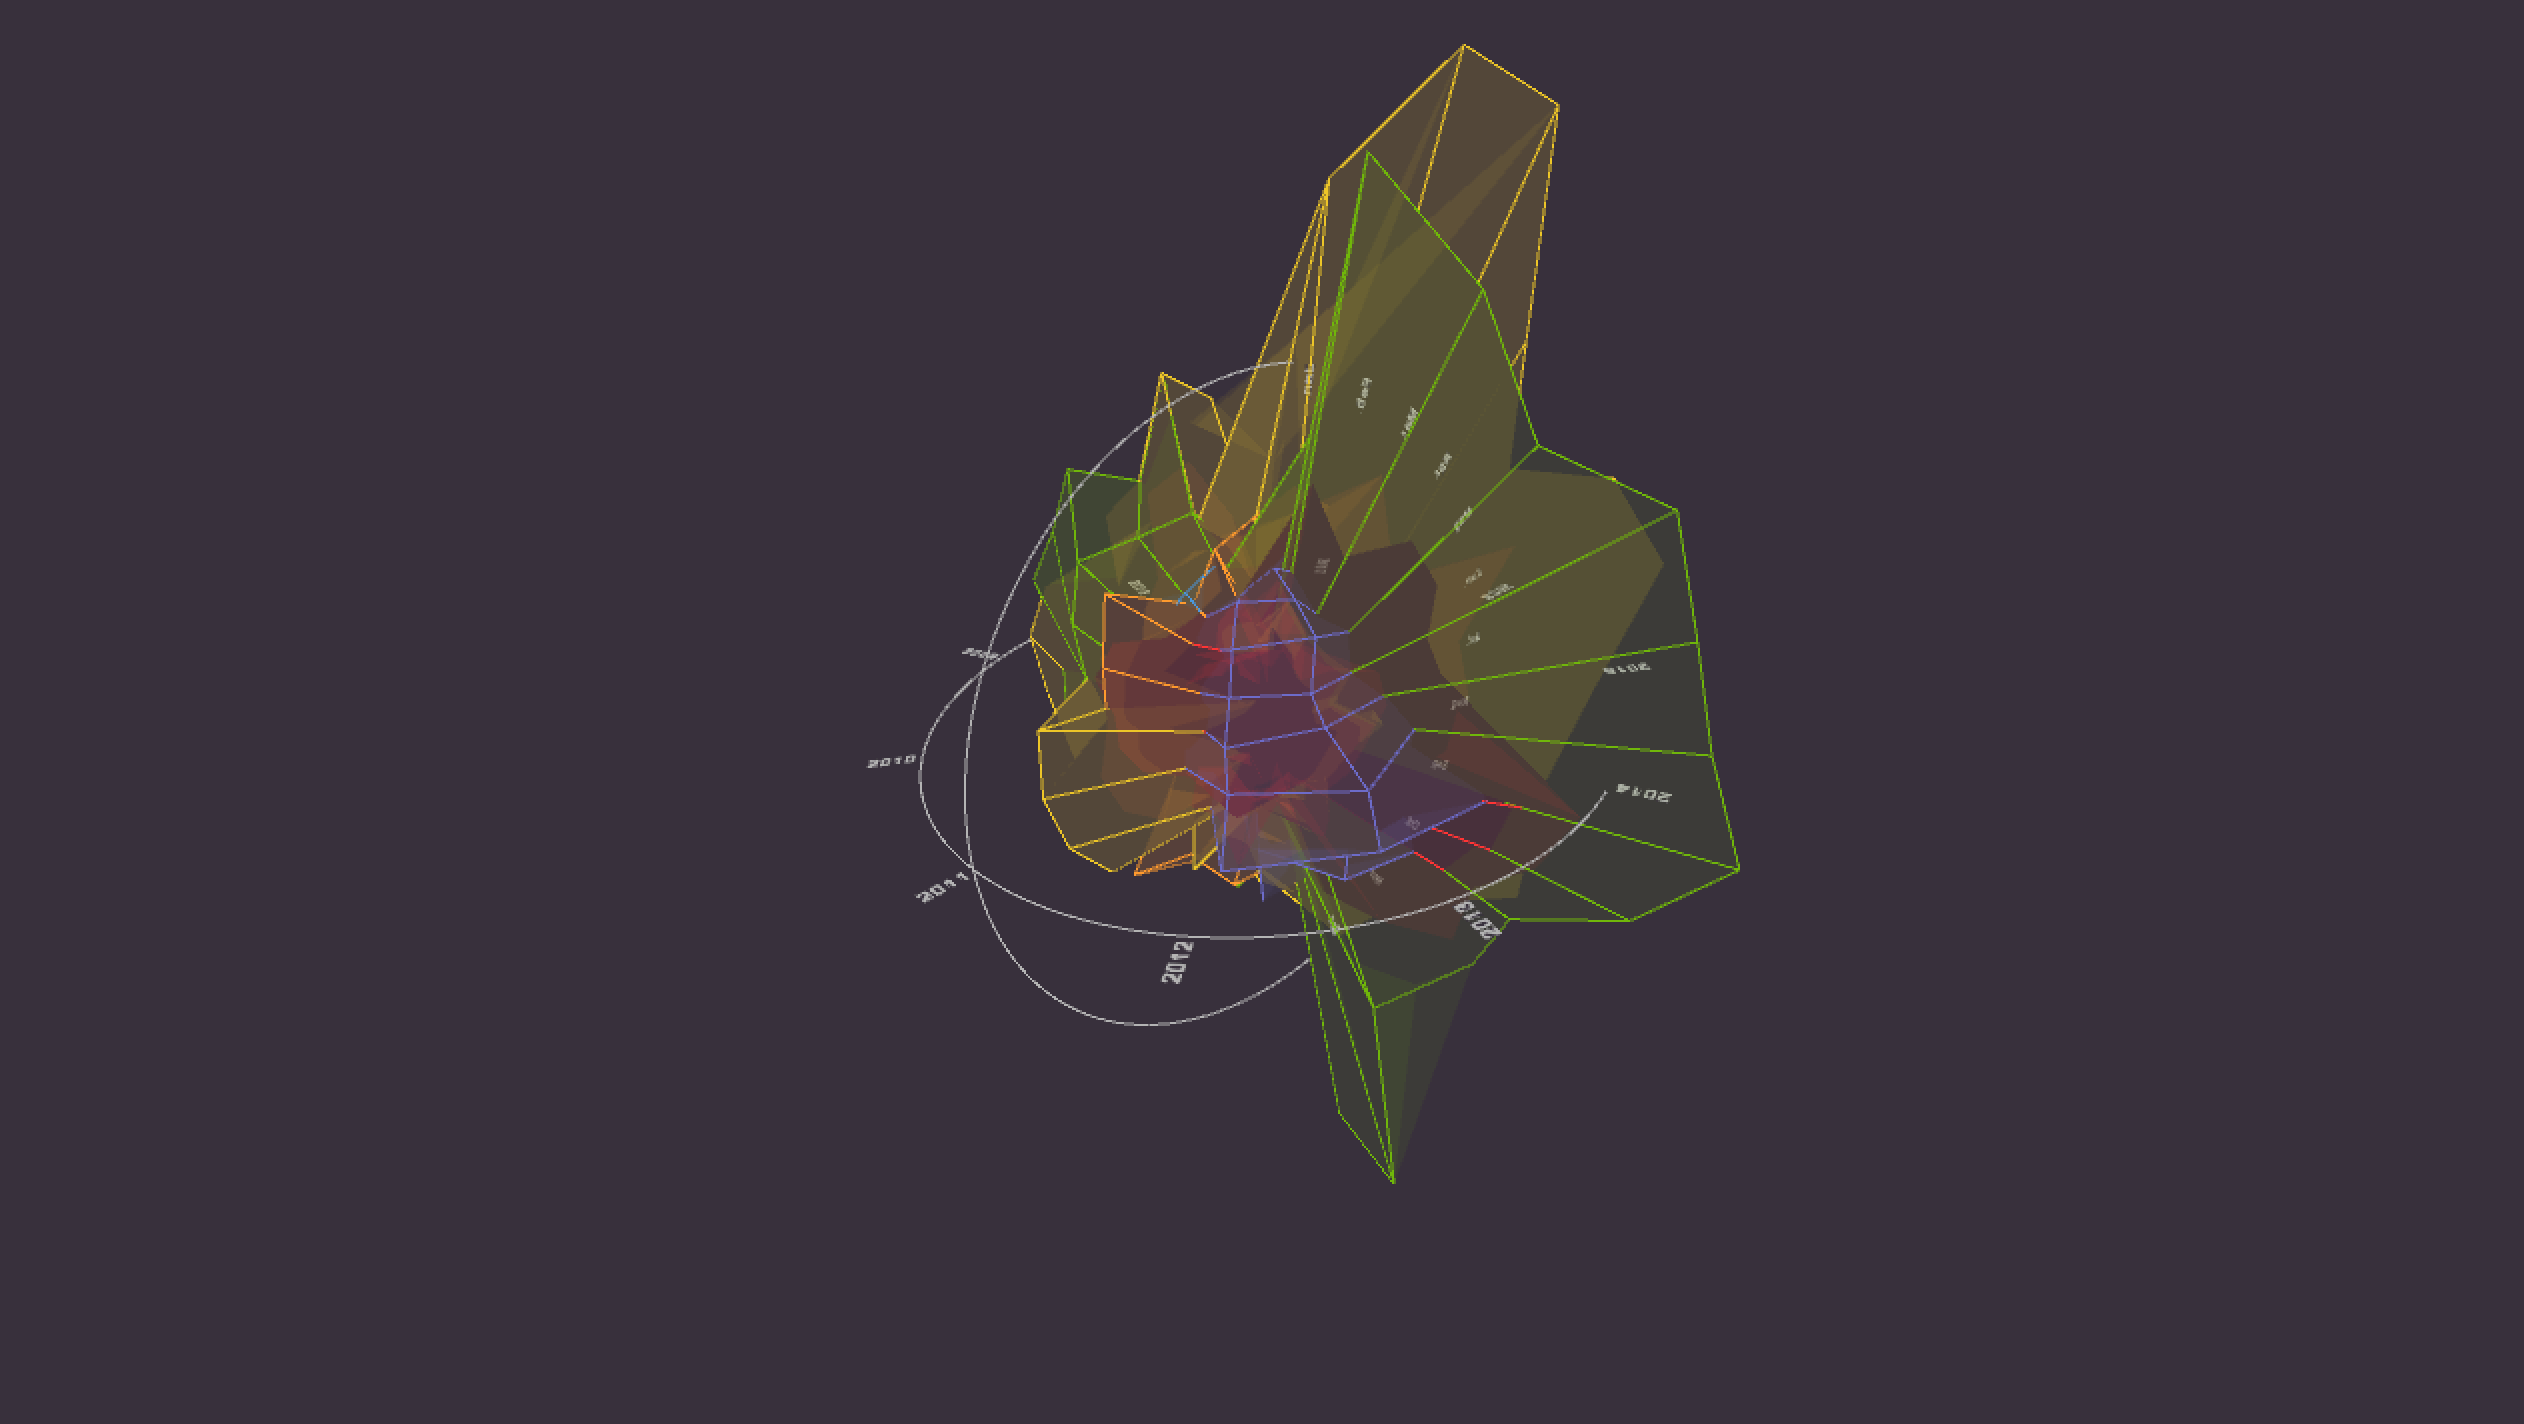
Different forms to illustrate data.
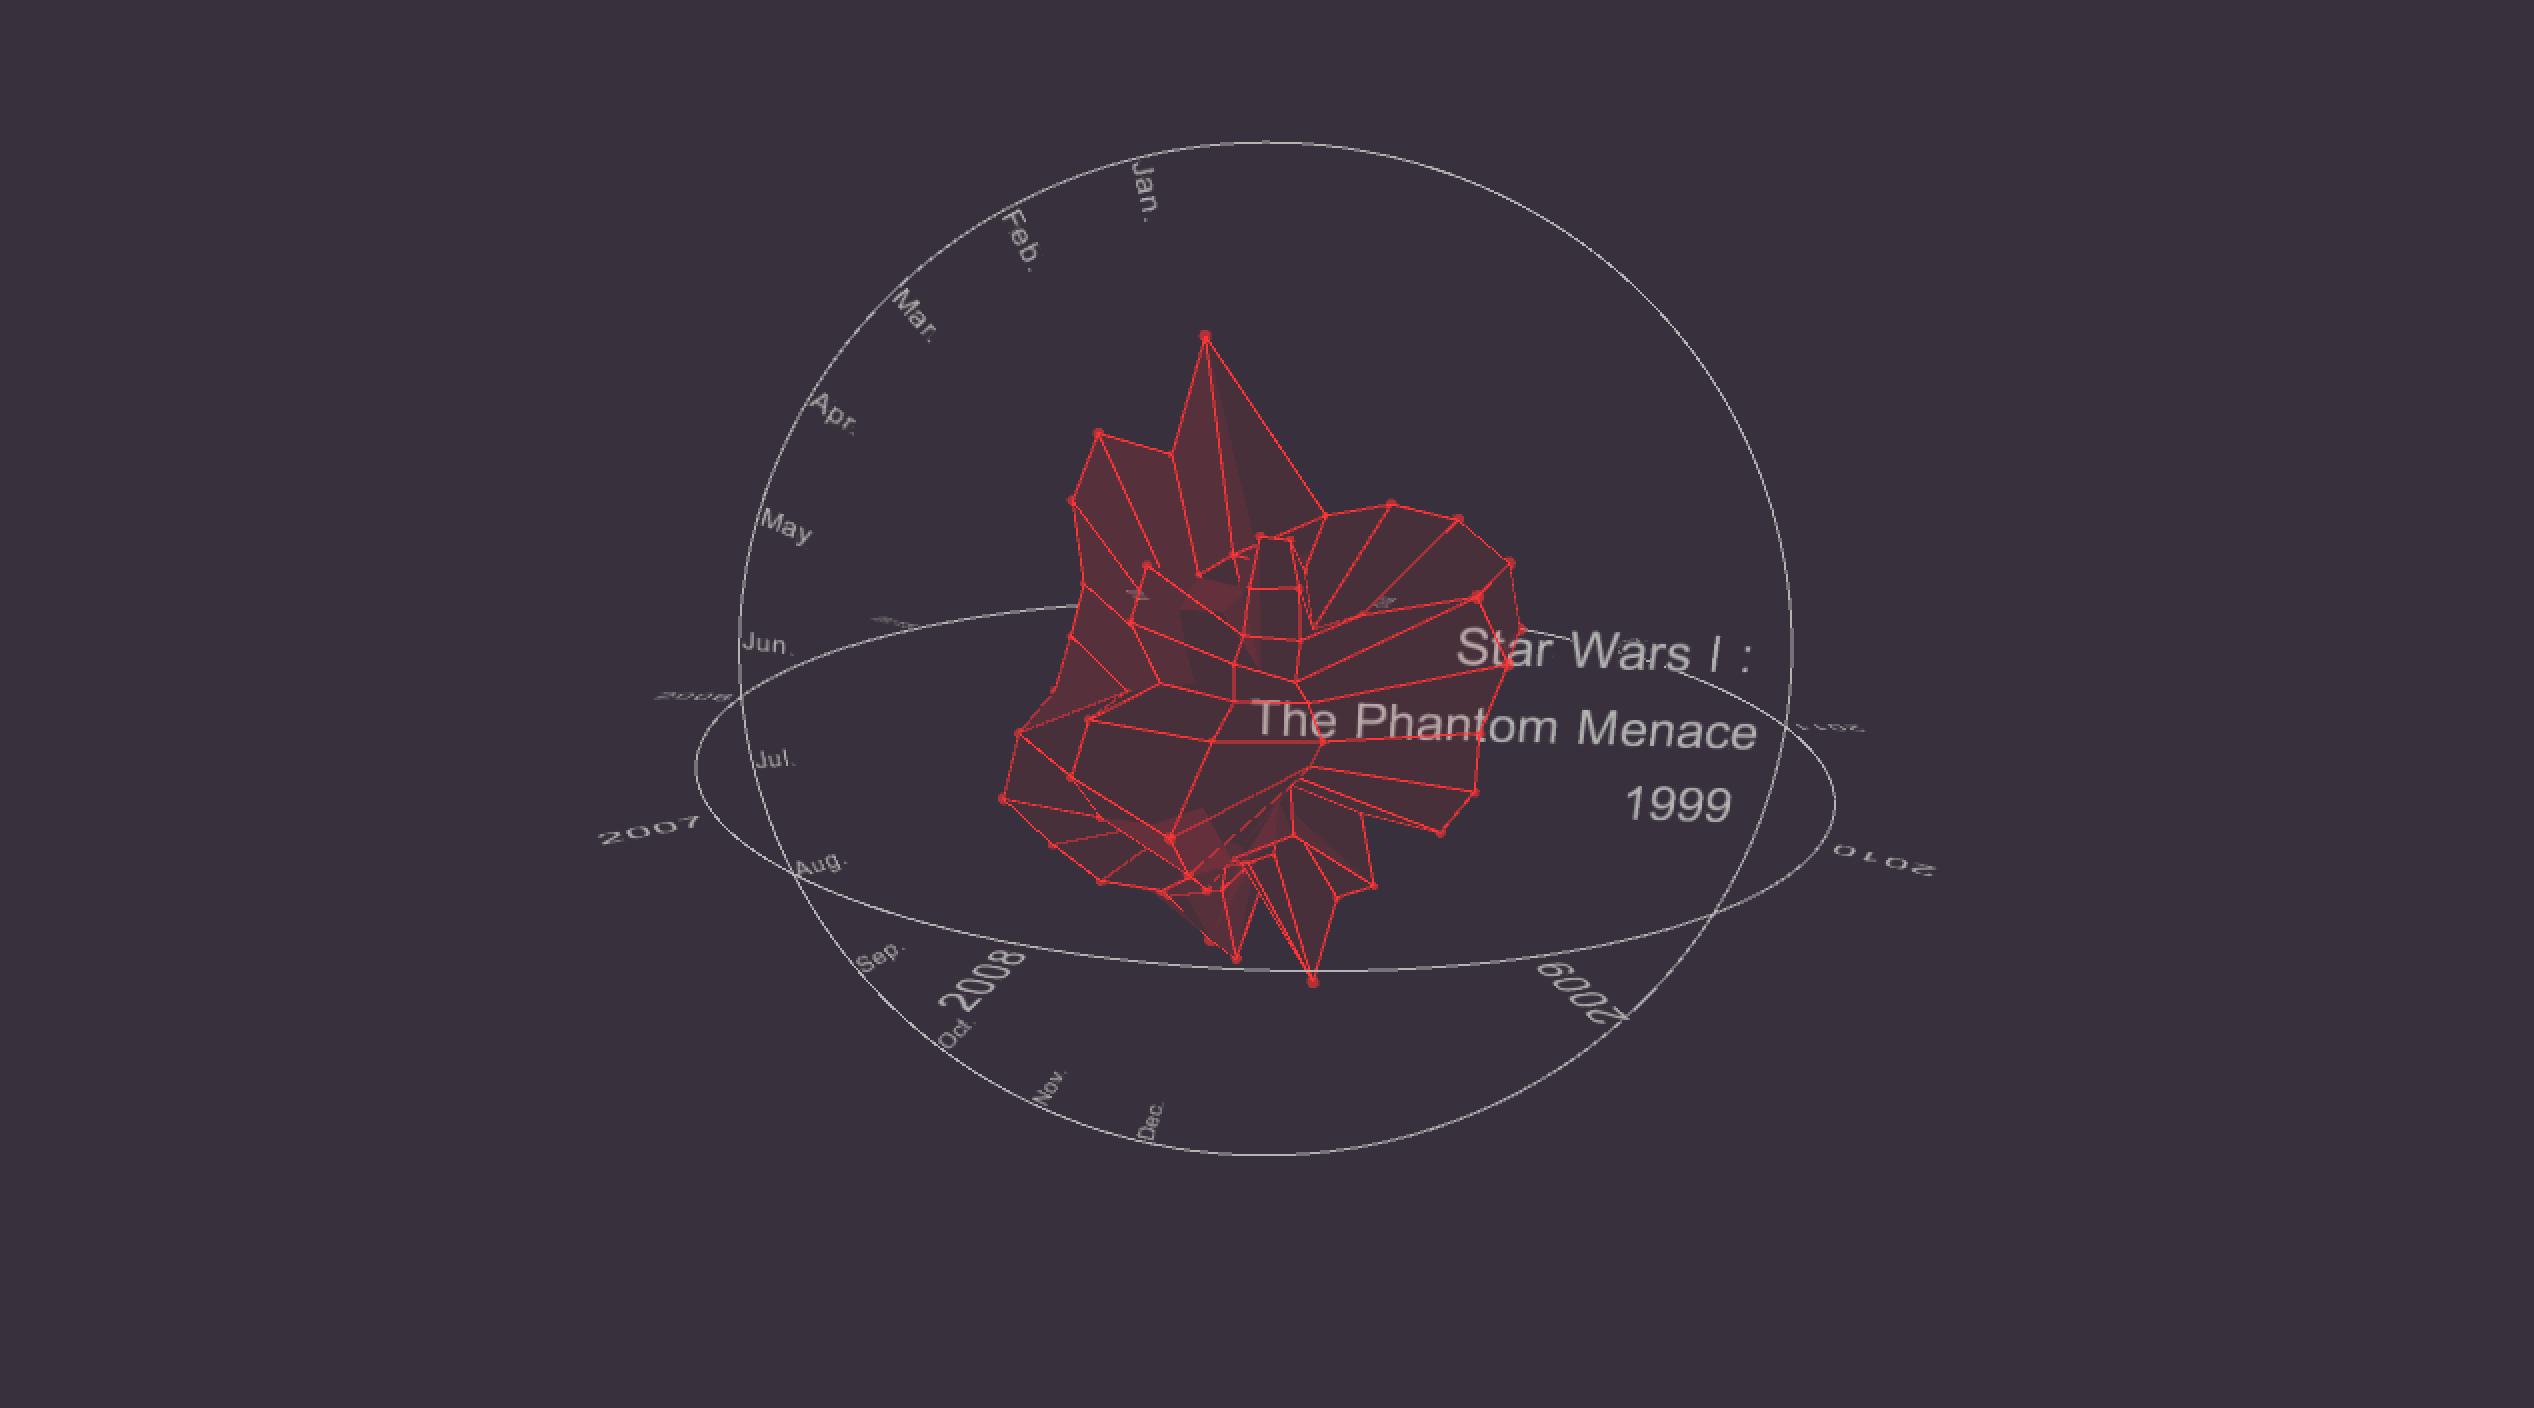
Solids.
Frames.
Points.
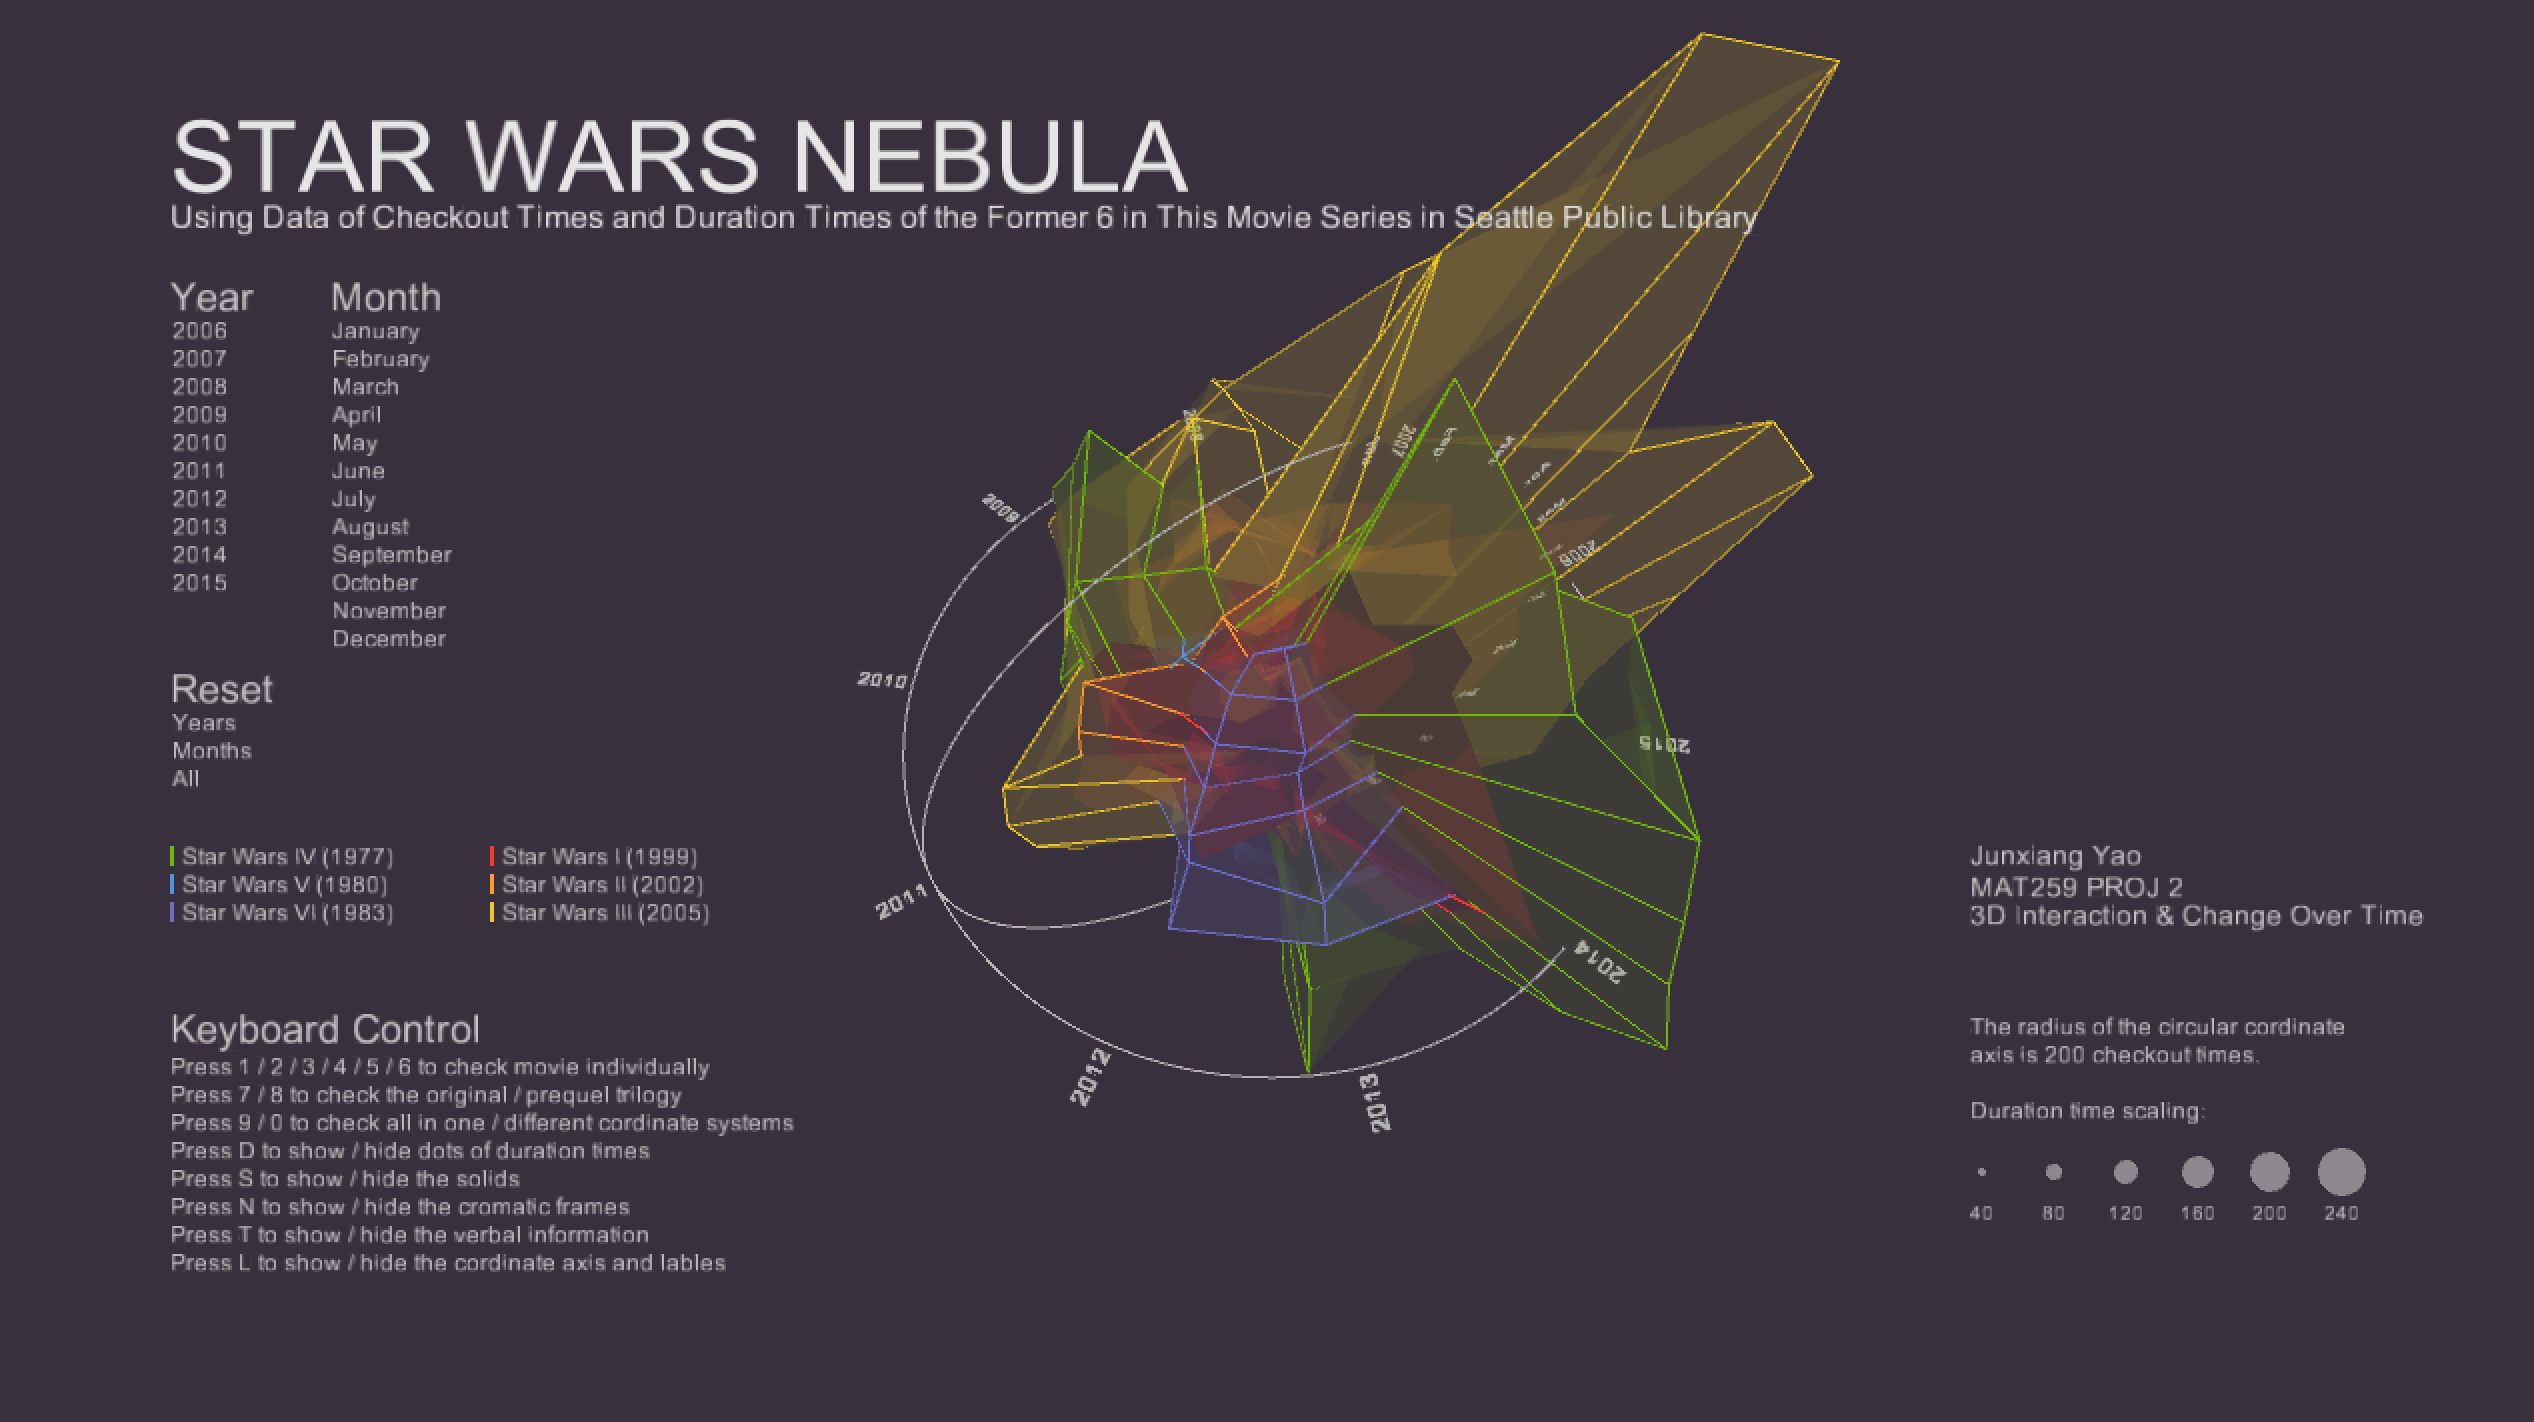
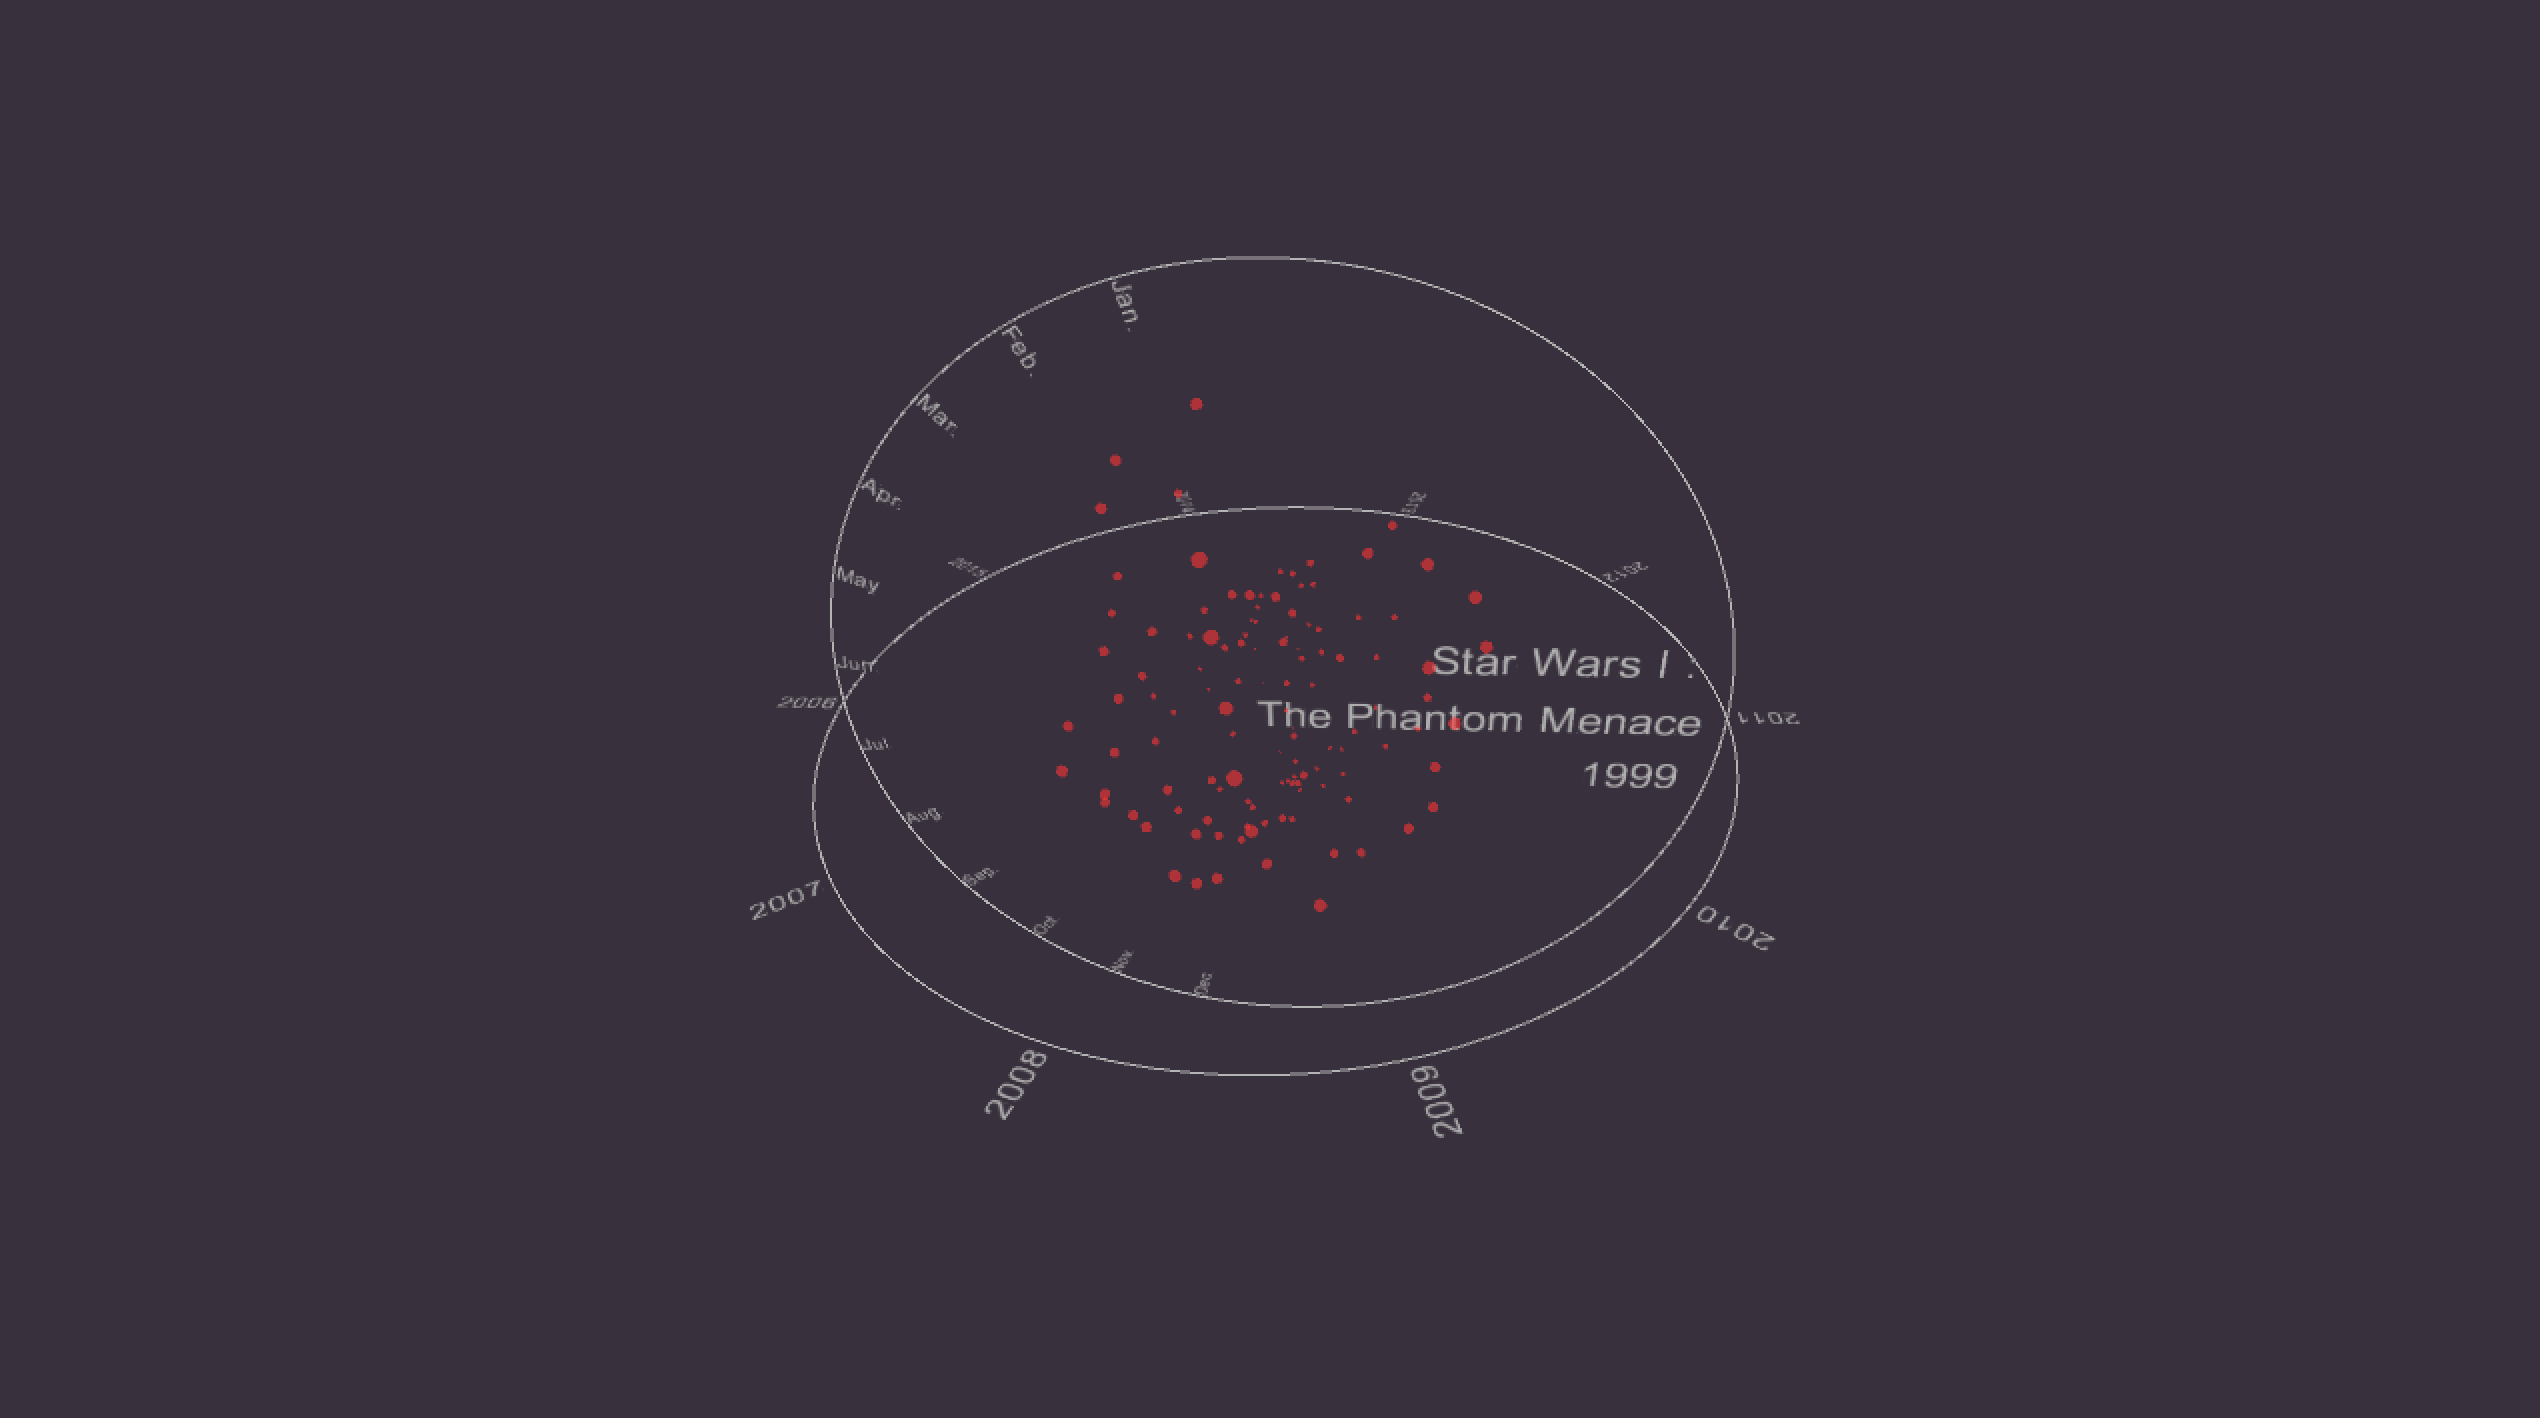
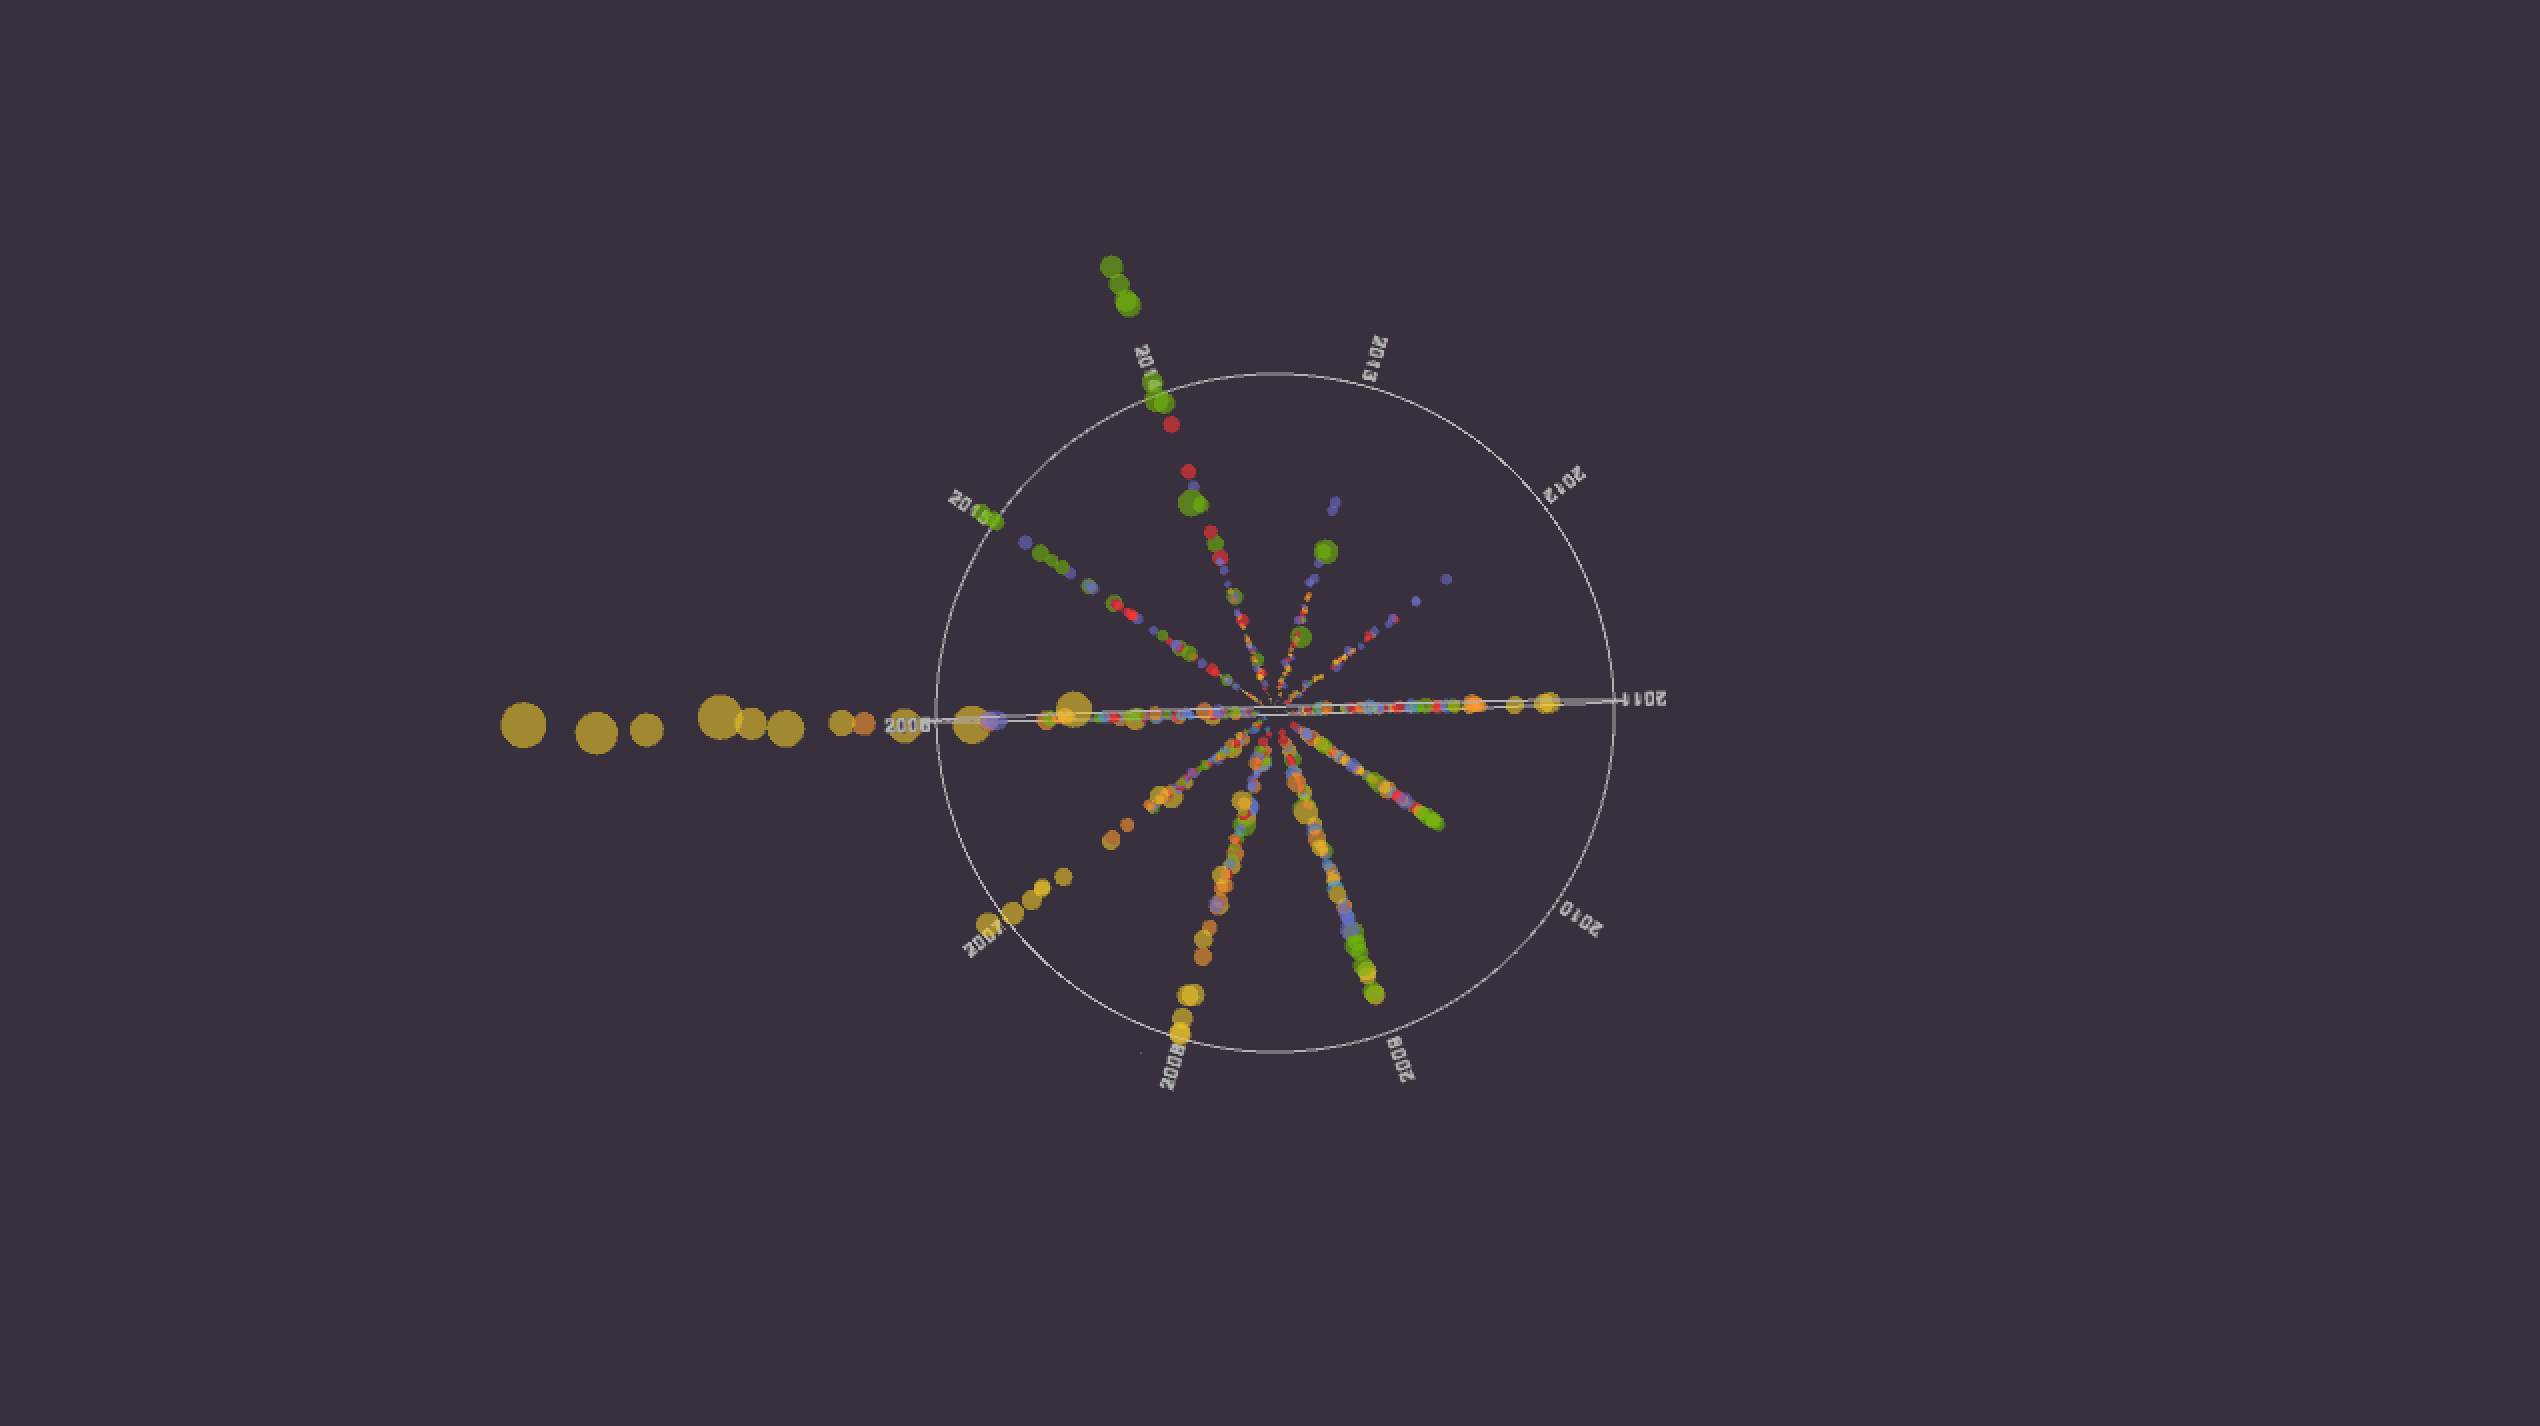
Check one movie individually.
The horizontal circle represents the years, and the vertical circle represents the months.

I can also highlight certain years and months by clicking on the buttons.
Here are some more results.


* Press 1 / 2 / 3 / 4 / 5 / 6 to check movie individually.
* Press 7 / 8 to check the original / prequel trilogy.
* Press 9 / 0 to check all in one / different cordinate systems.
* Press D to show / hide dots of duration times.
* Press S to show / hide the solids.
* Press N to show / hide the cromatic frames.
* Press F to show / hide grey frames.
* Press T to show / hide the verbal information.
* Press L to show / hide the cordinate axis and lables.
* Press G to show / hide the grid system.
I used grid system to design the layout.
Different forms to illustrate data.
Solids.
Frames.
Points.
Check one movie individually.
The horizontal circle represents the years, and the vertical circle represents the months.
I can also highlight certain years and months by clicking on the buttons.
Here are some more results.
Code