How does the dead rock star stay alive?
:: 3D dynamic visualization
:: 3D dynamic visualization
MAT 259, 2016
Jing Yan / Eye
Concept
/*
When rock stars are dead, they are never gone. They keep being memorized by millions of their fans, music lovers, and the public. Their songs went on again and again. And as culture icons, their life stories are discovered, passed on, and exaggerated year by year.
*/
In this project, I completely explore the aliveness of David Bowie in Seattle Public Library, both in quantity dimension and quality dimension, by examining the checkout times and durations of David Bowies CDs and related books.
Query
Data updated
Using the new tango 2, I rearranged MySQL to get more detailed data. The date becomes more specific: every day from 2005-08-01 to 2016-1-31. The titles are rearranged by the published date which is showed on the SPLs website. This arrangement gathers more meaning than simply arrange titles by the alphabet order.
title type for CD and book
SELECT distinct
itemType, title
FROM
spl.title,
spl.itemType,
spl.itemToBib
WHERE
spl.itemType.itemNumber = spl.itemToBib.itemNumber
AND spl.itemToBib.bibNumber = spl.title.bibNumber
AND (spl.title.bibNumber = '1836438'
OR spl.title.bibNumber = '1965047'
......
OR spl.title.bibNumber = '2448150'
OR spl.title.bibNumber = '2612658'
OR spl.title.bibNumber = '1953009')
ORDER BY itemType , title
checkout event per day per title for CD and book
SELECT
itemType,
title,
DATE_FORMAT(checkOut, '20%y-%m-%d') AS date,
COUNT(checkOut) AS checkOutTimes,
#DATE_FORMAT(checkOut, '20%y-%m-%d') AS coutDate,
#DATE_FORMAT(checkInFirst, '20%y-%m-%d') AS cinDate,
AVG(TIMESTAMPDIFF(DAY,
checkOut,
checkIn)) AS checkOutDuration
FROM
spl.itemType,
spl.title,
spl._transactionsExploded
WHERE
spl.itemType.itemNumber = spl._transactionsExploded.itemNumber
AND spl.title.bibNumber = spl._transactionsExploded.bibNumber
AND (spl.title.bibNumber = '1836438'
OR spl.title.bibNumber = '1965047'
......
OR spl.title.bibNumber = '2448150'
OR spl.title.bibNumber = '2612658'
OR spl.title.bibNumber = '1953009')
GROUP BY title , date
ORDER BY itemType, date , title
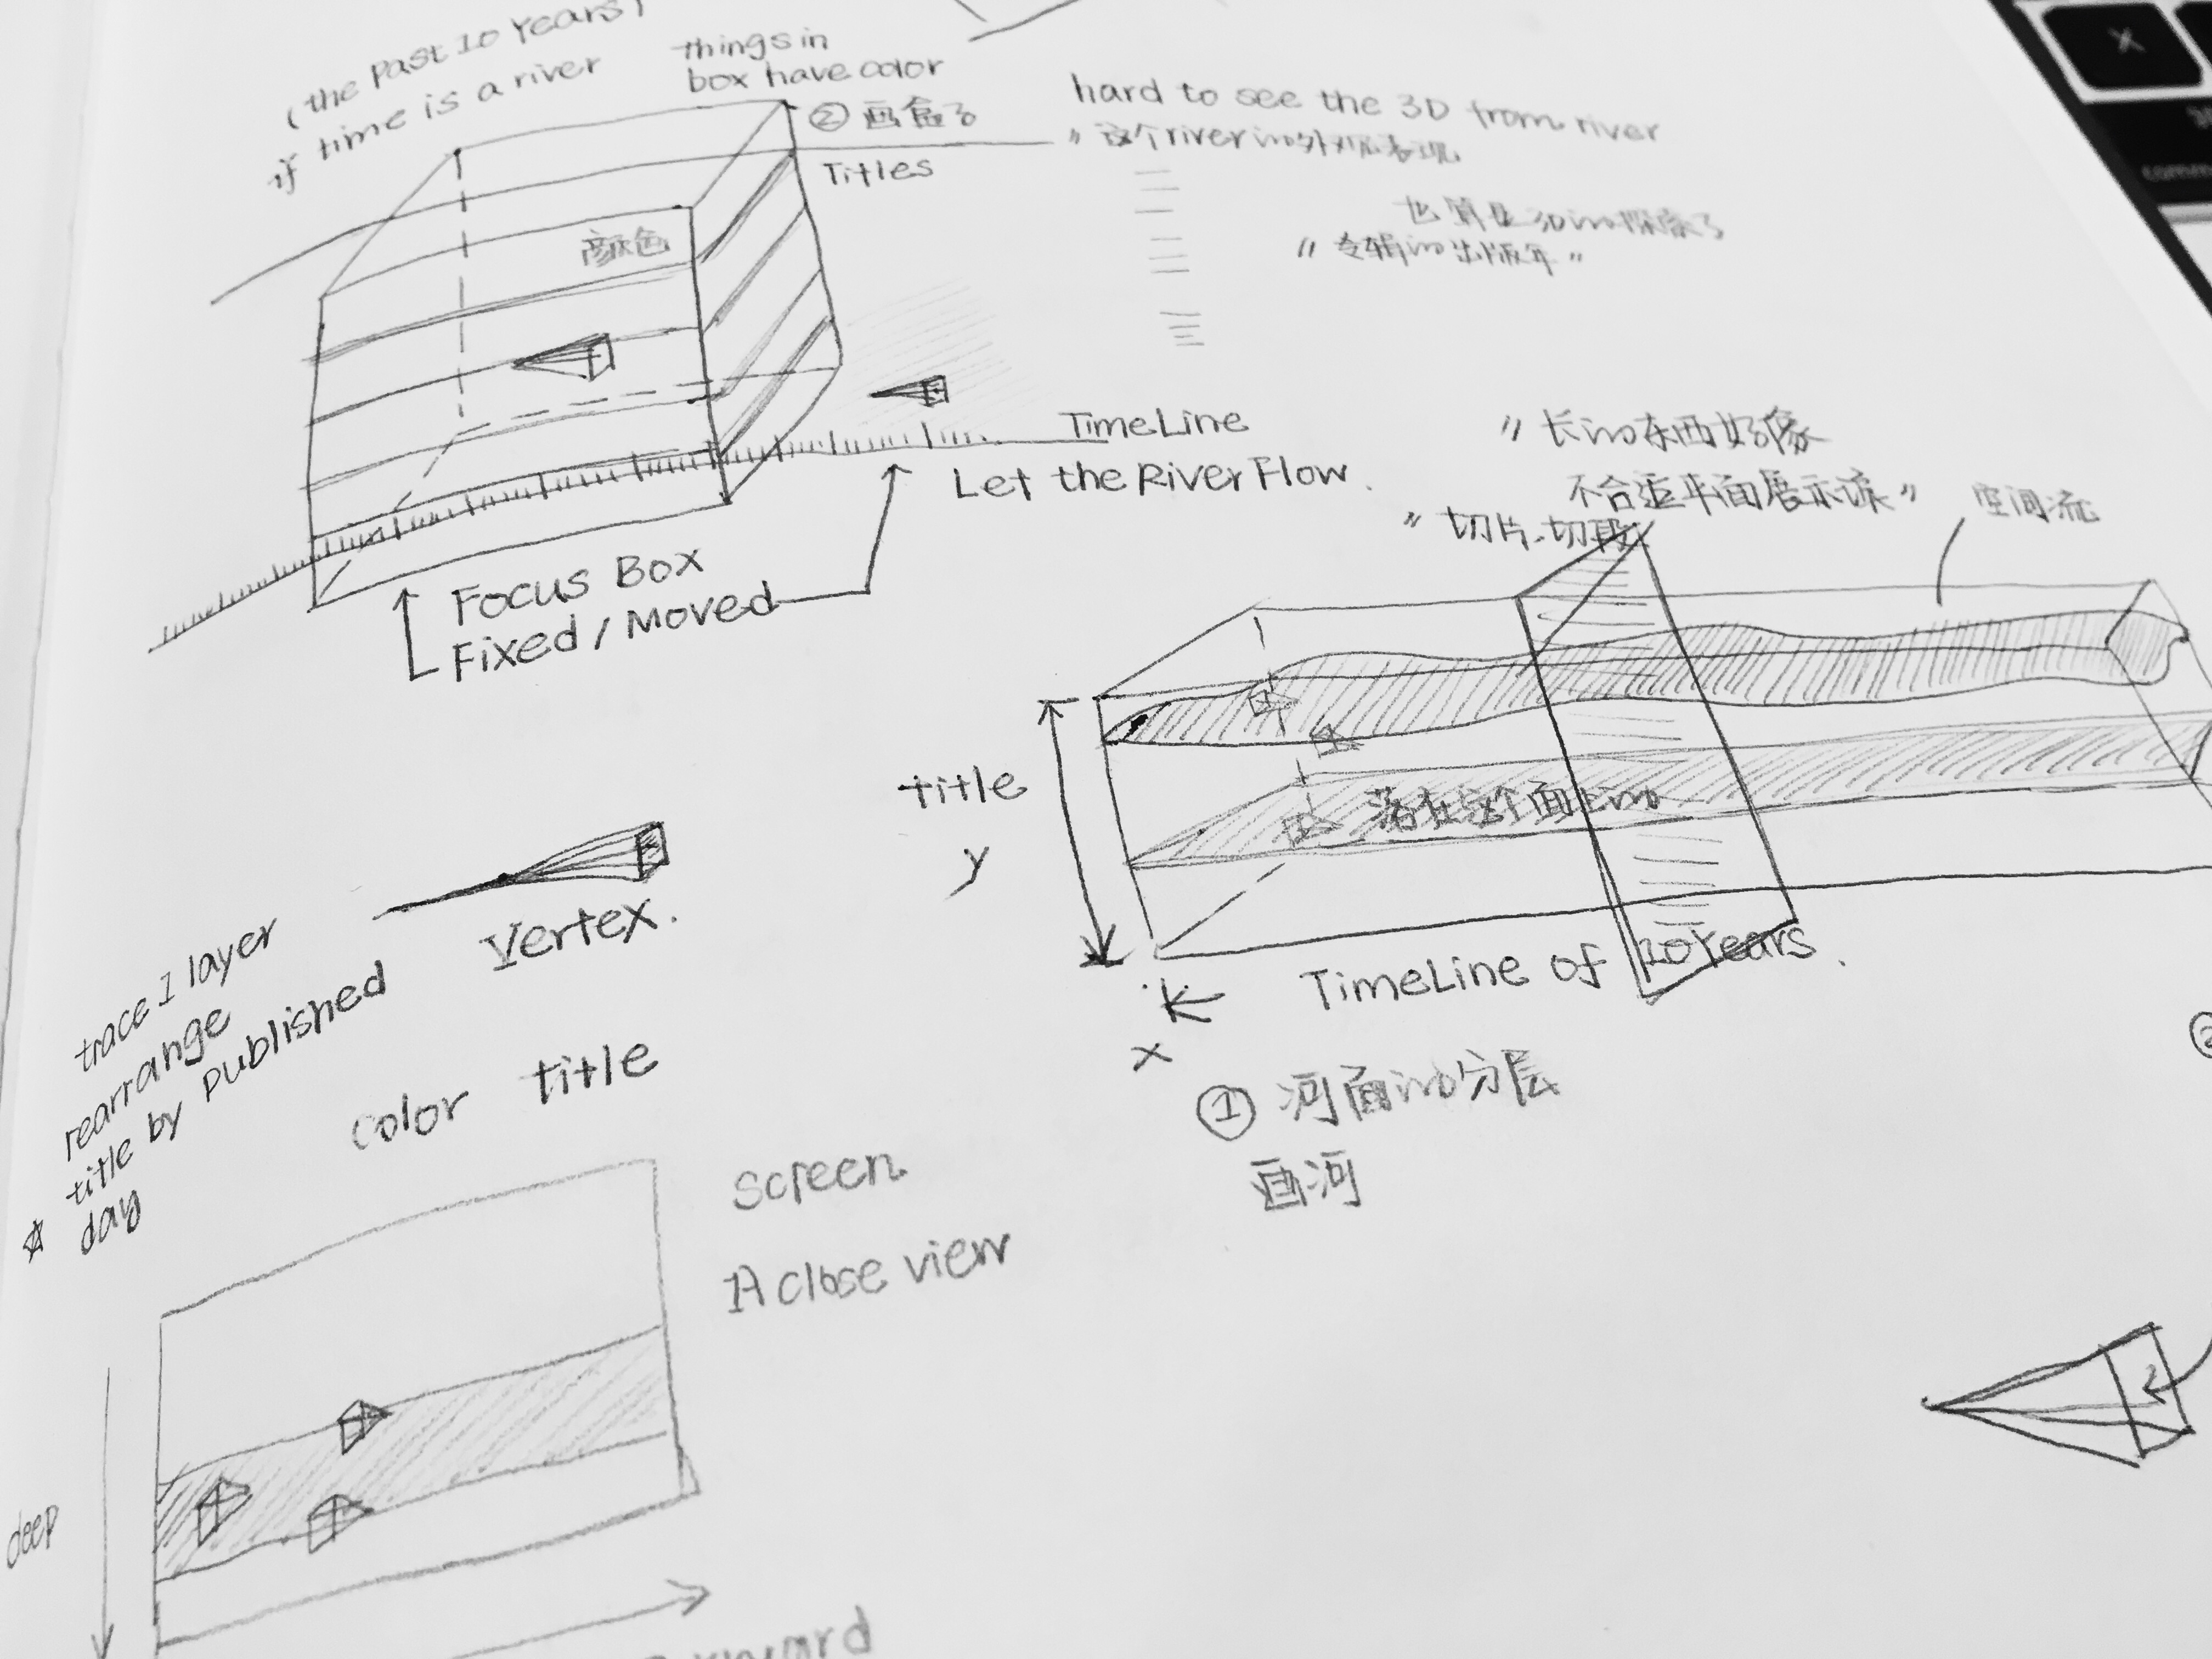
Preliminary sketches
Visualization model
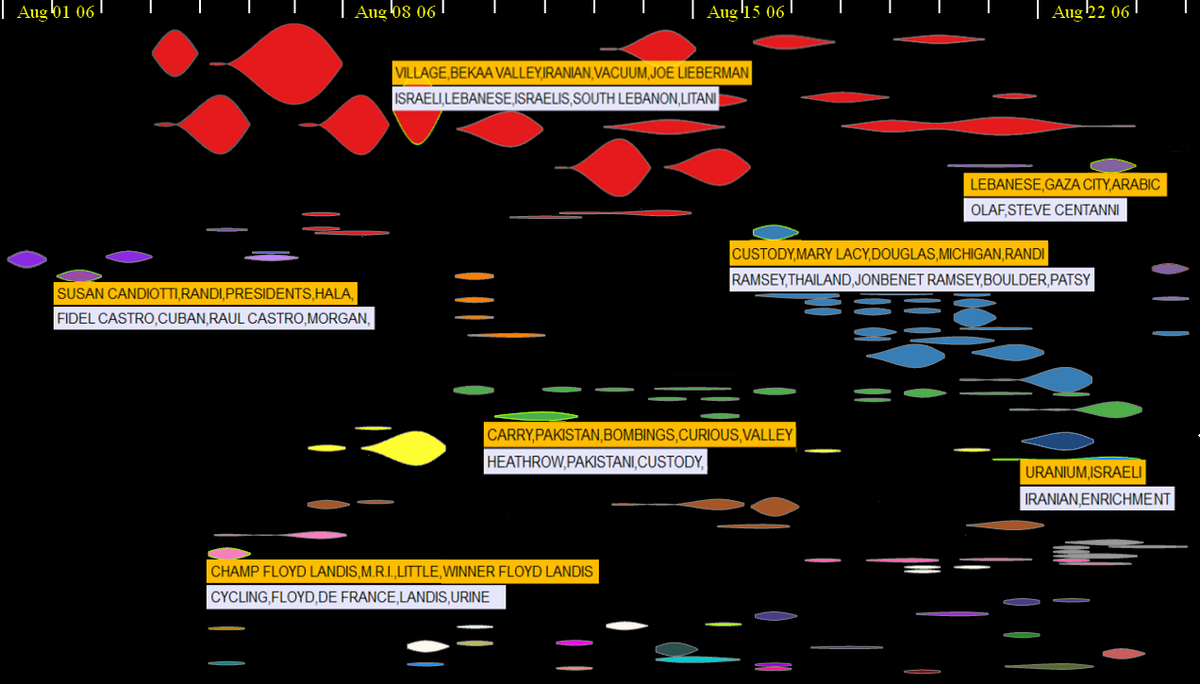
The visualization is based on the event-river model, which I find very suitable to my concept and data. What I like about this model is that it regards each event as a creature in the river. The event is separated from the context and gain its own feature. Furthermore, the metaphor of river and fish adds a lot of imagination and possibility. In my data visualization project, I further explore this model by changing the 2D static model into a 3D dynamic model with interaction.
Process
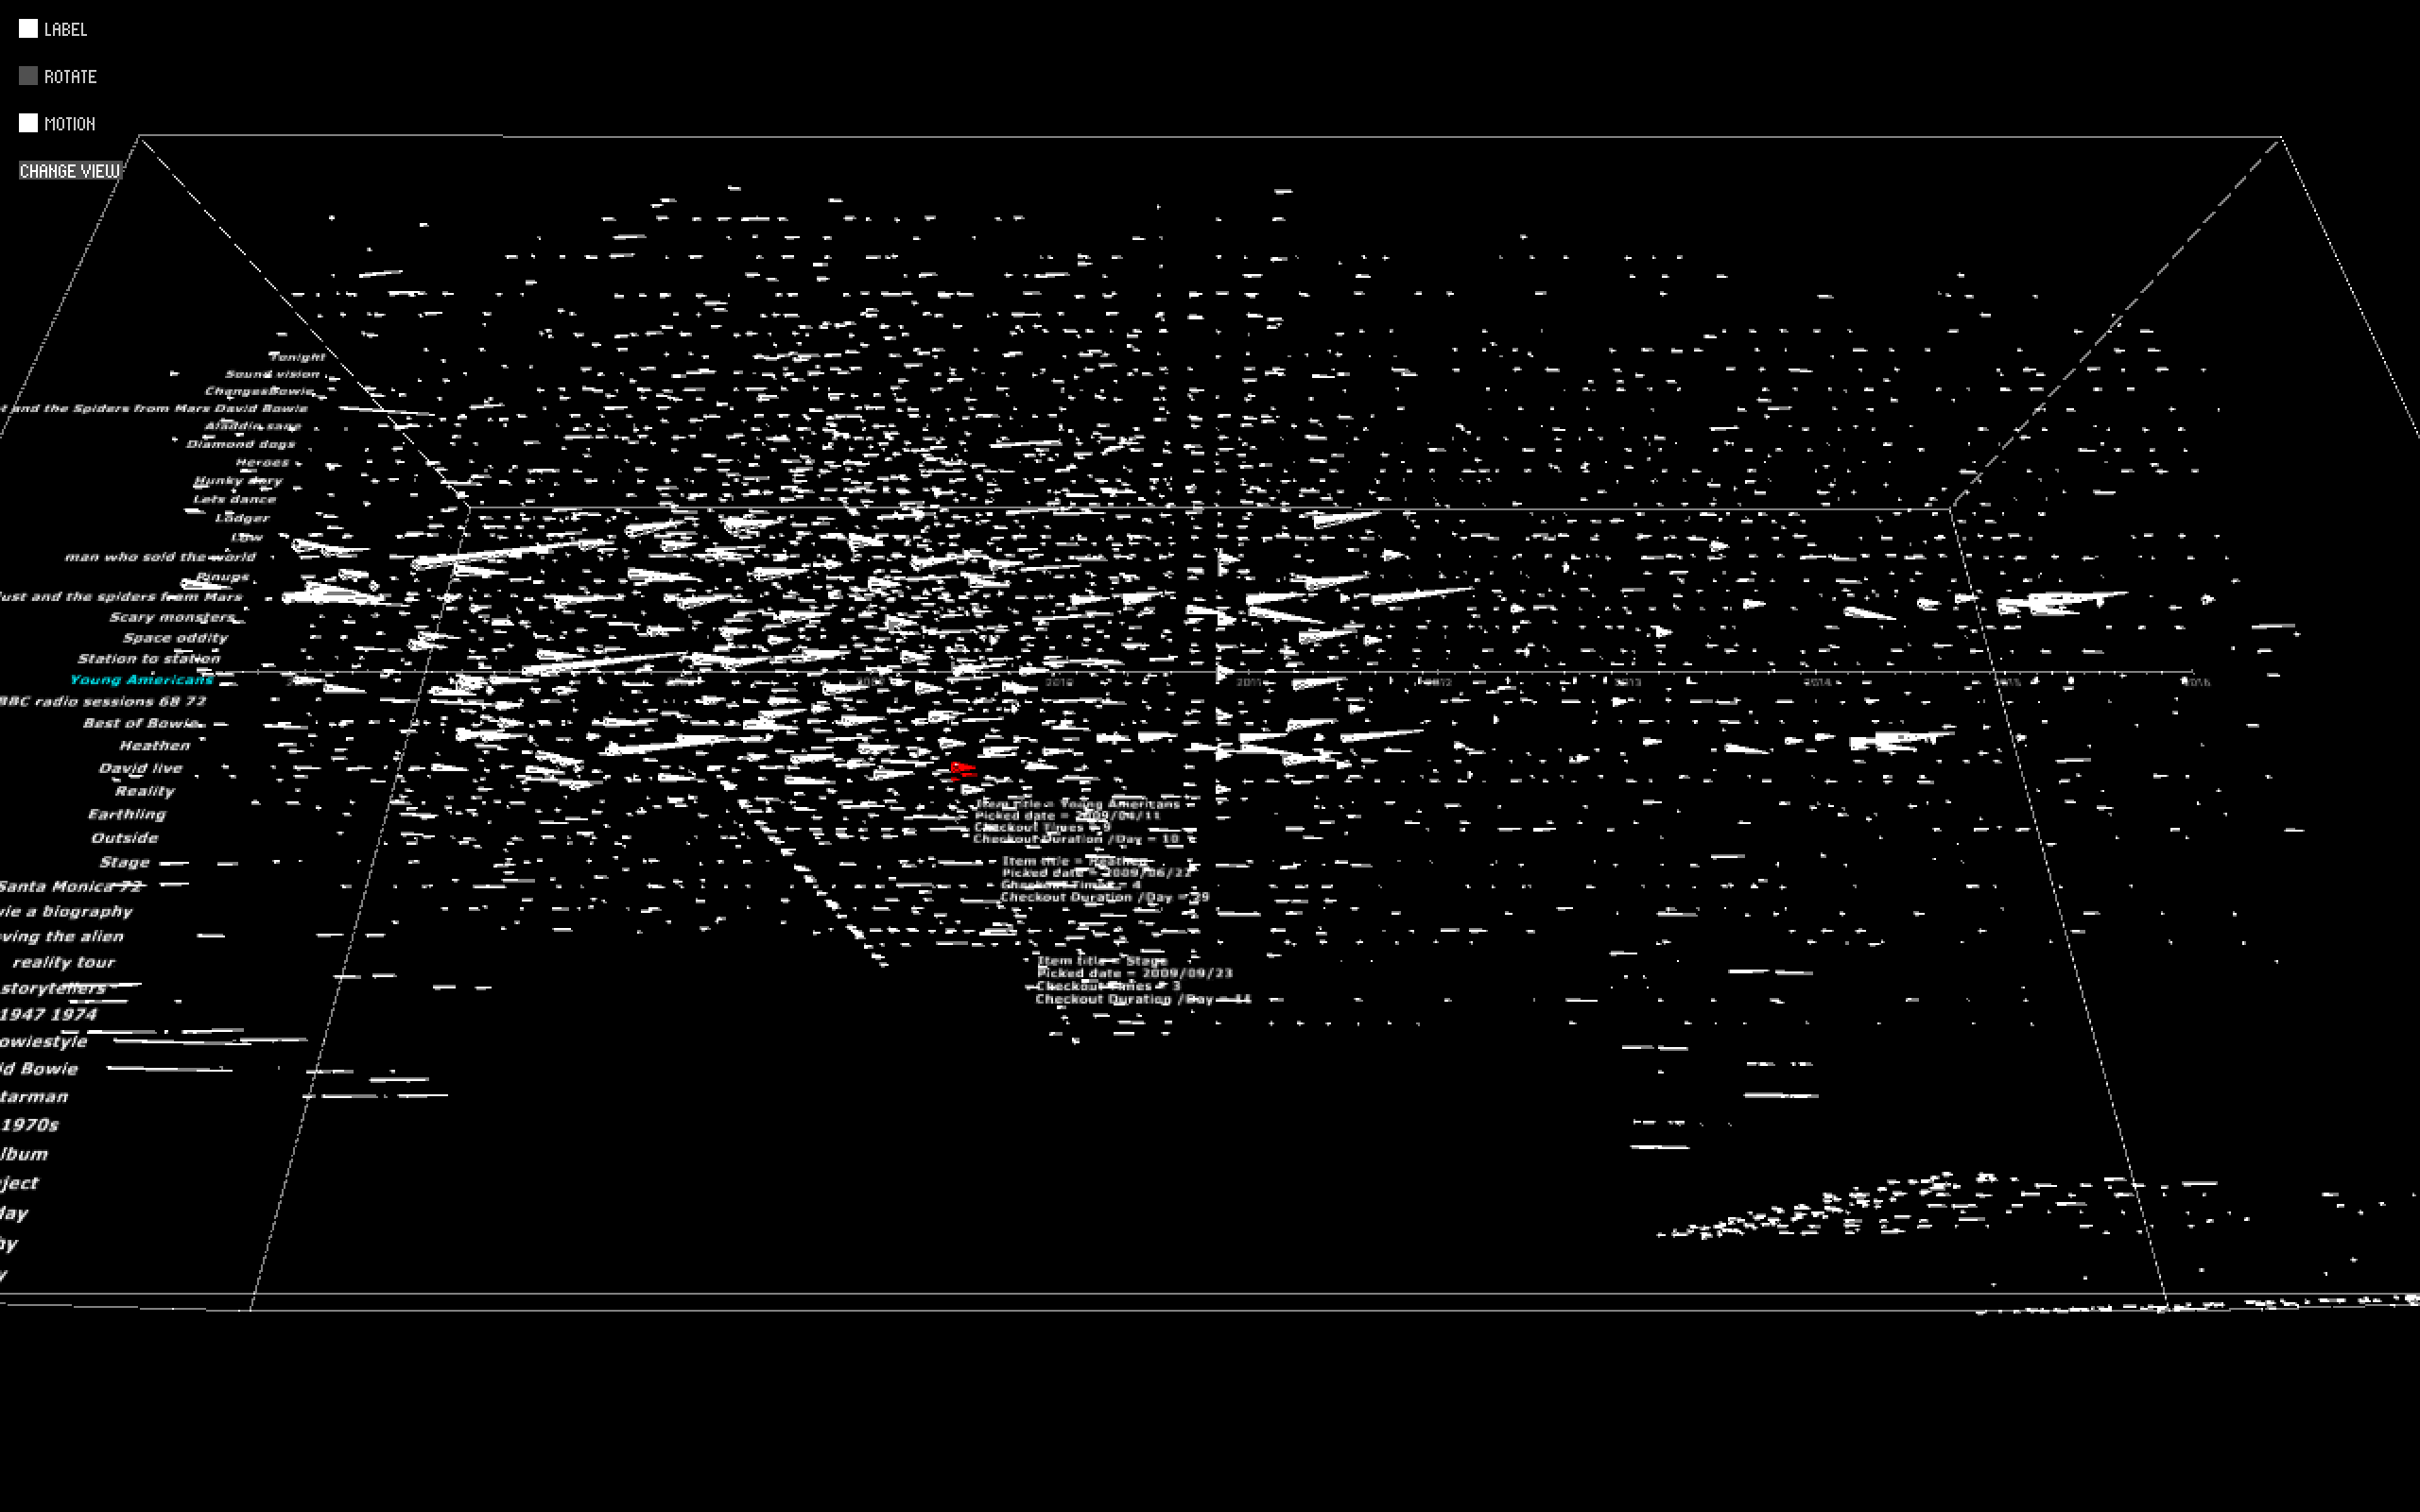
The data visualization is consisted of several parts: the title, the river, the creature, labels and data, and interaction buttons.
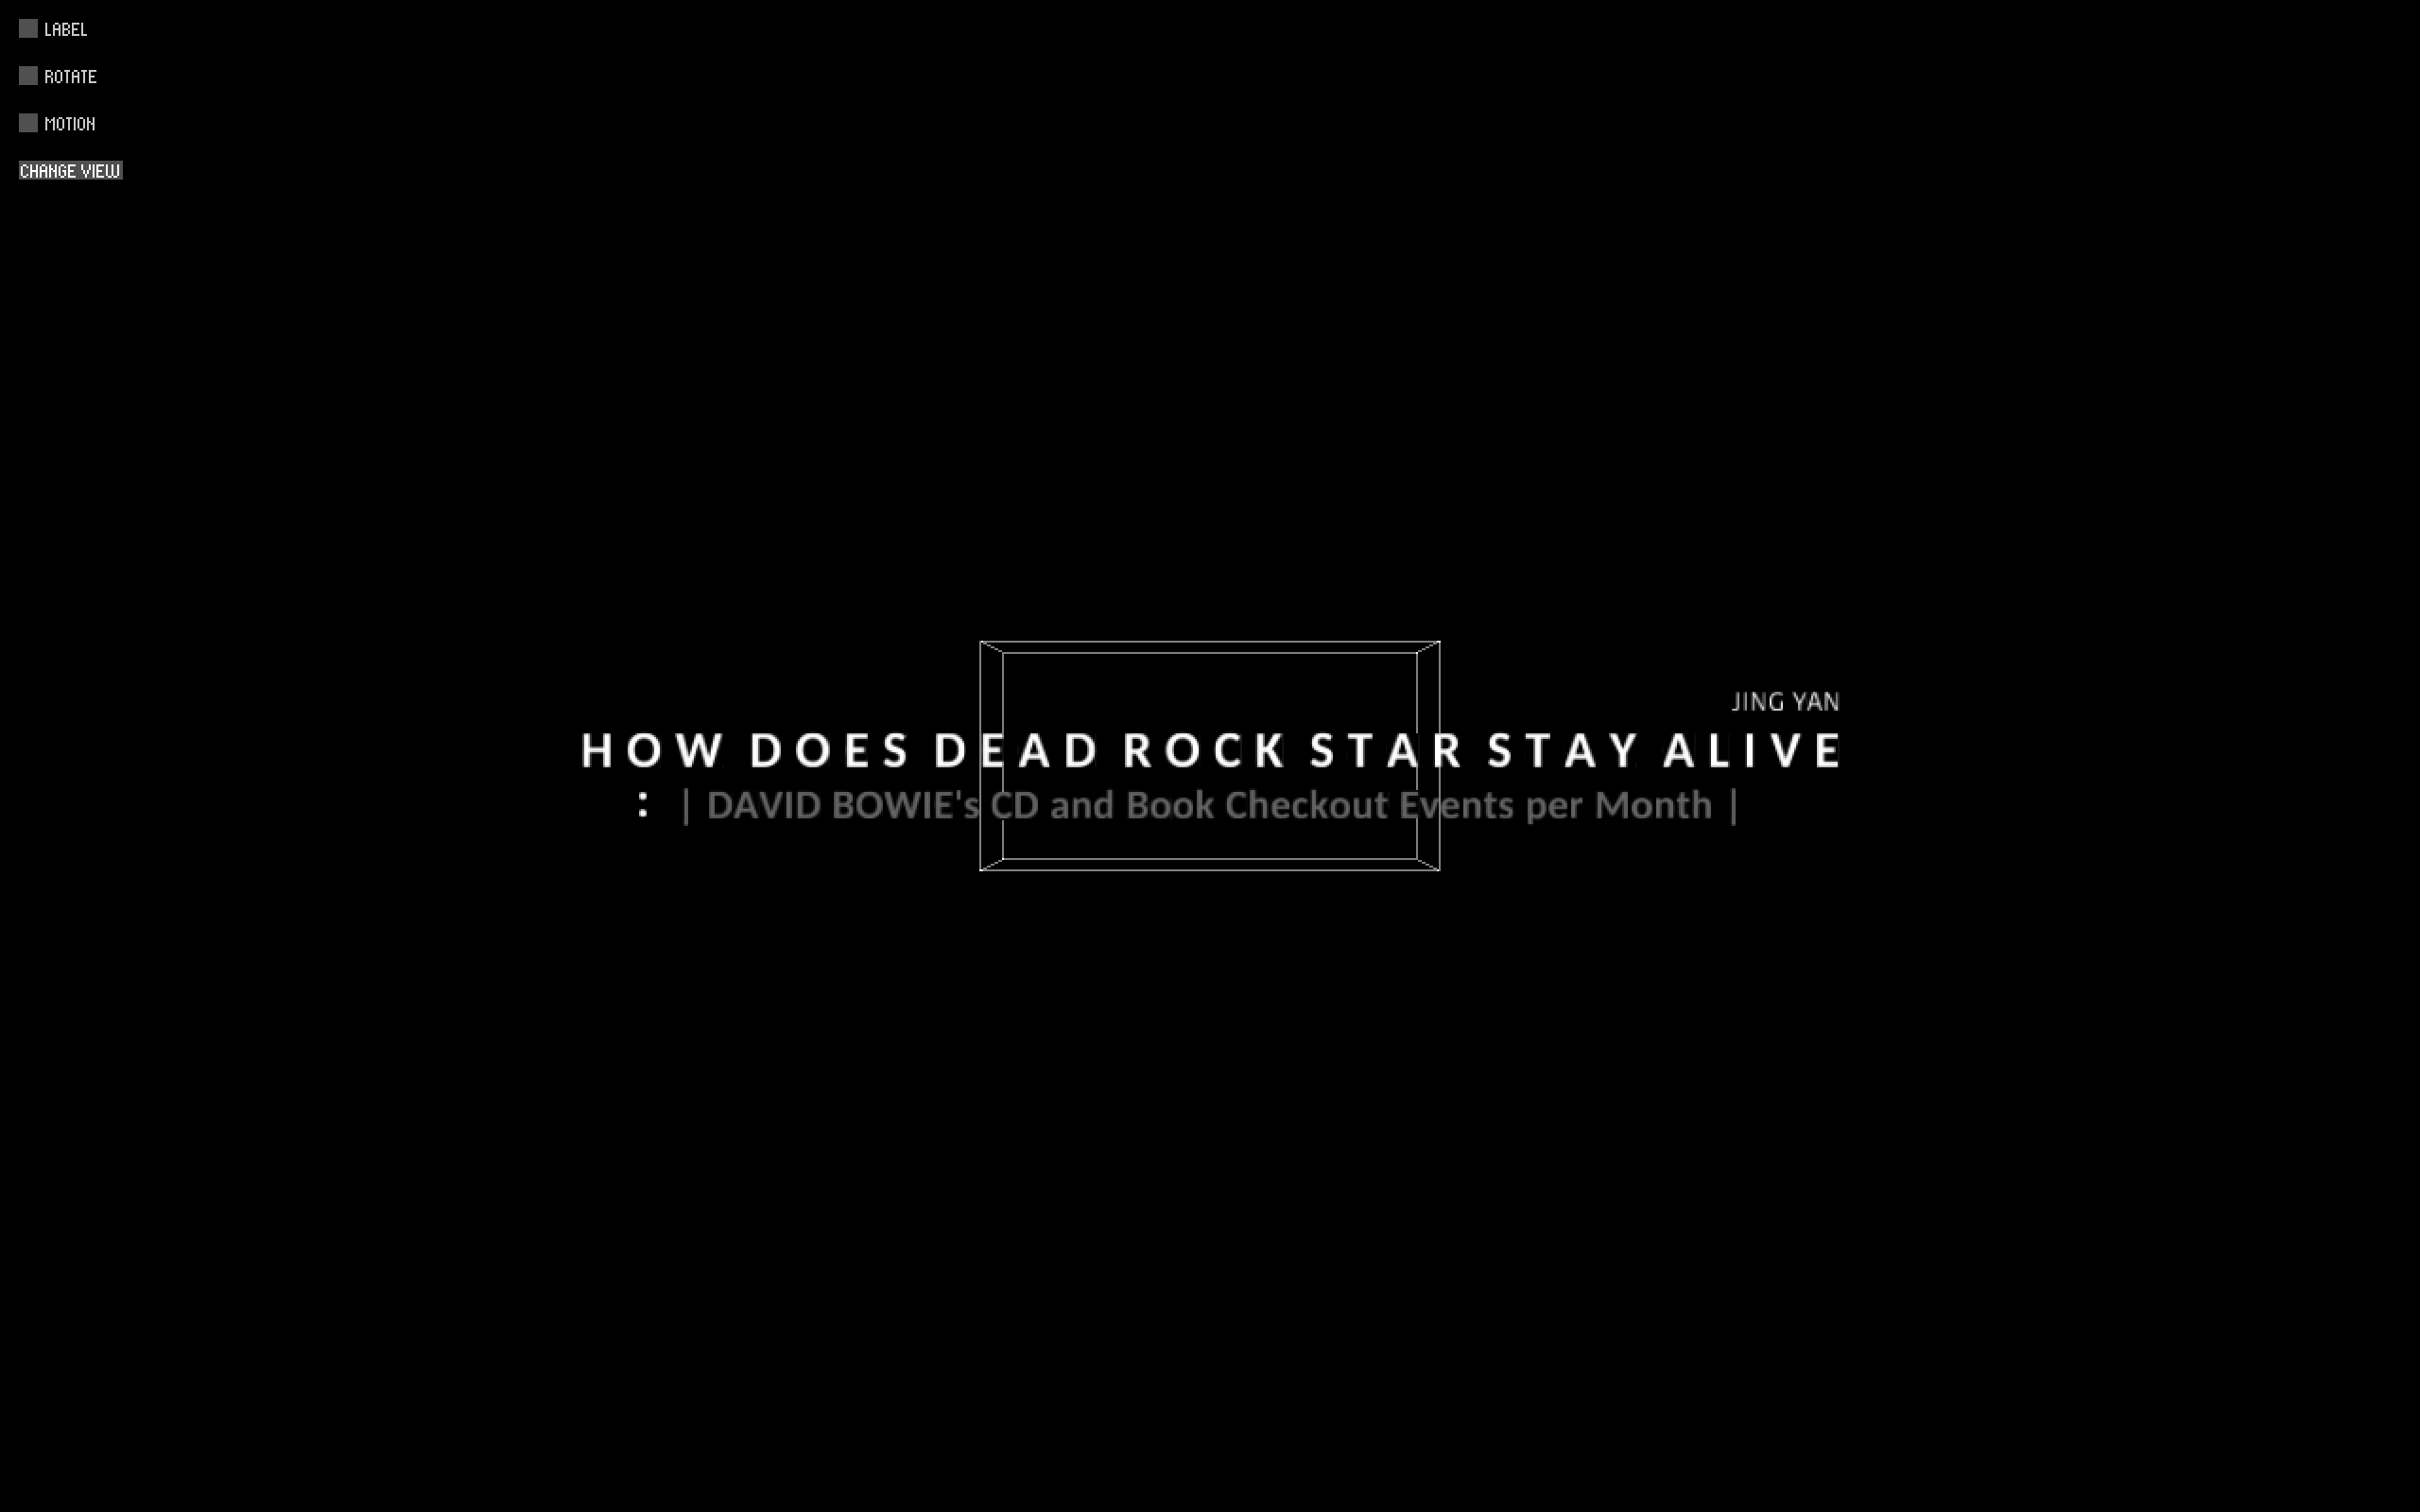
/ first view
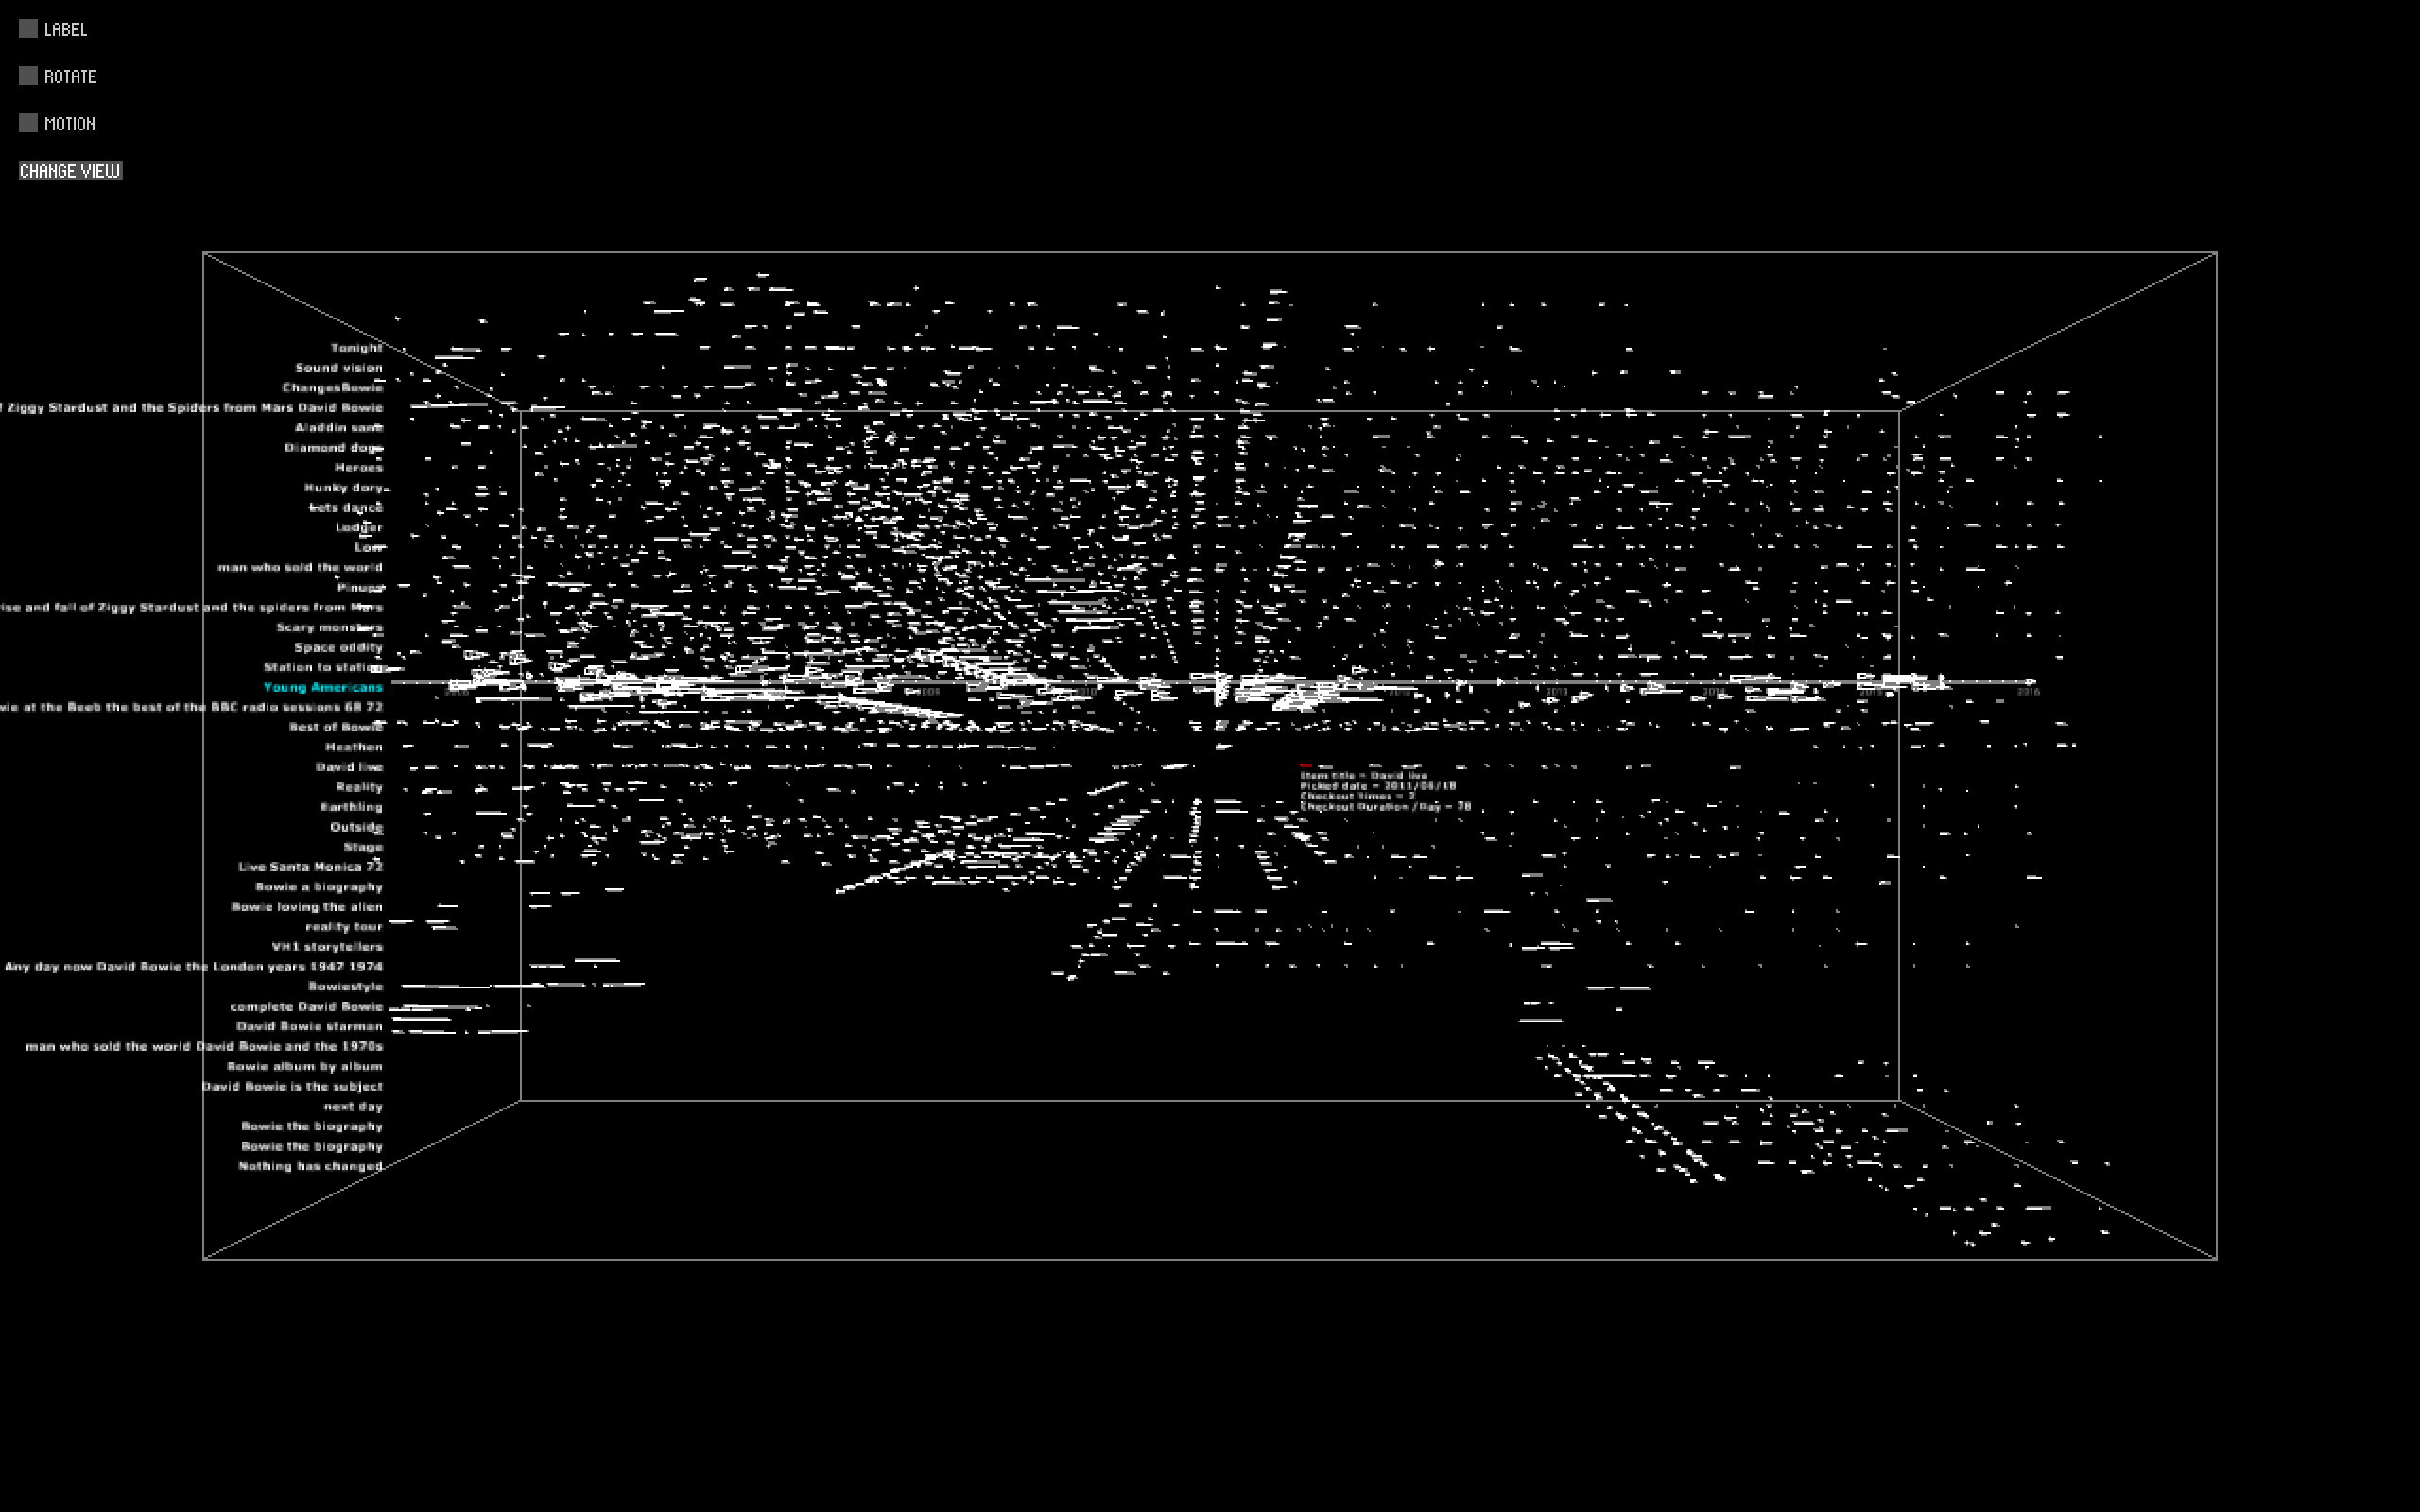
/ general view
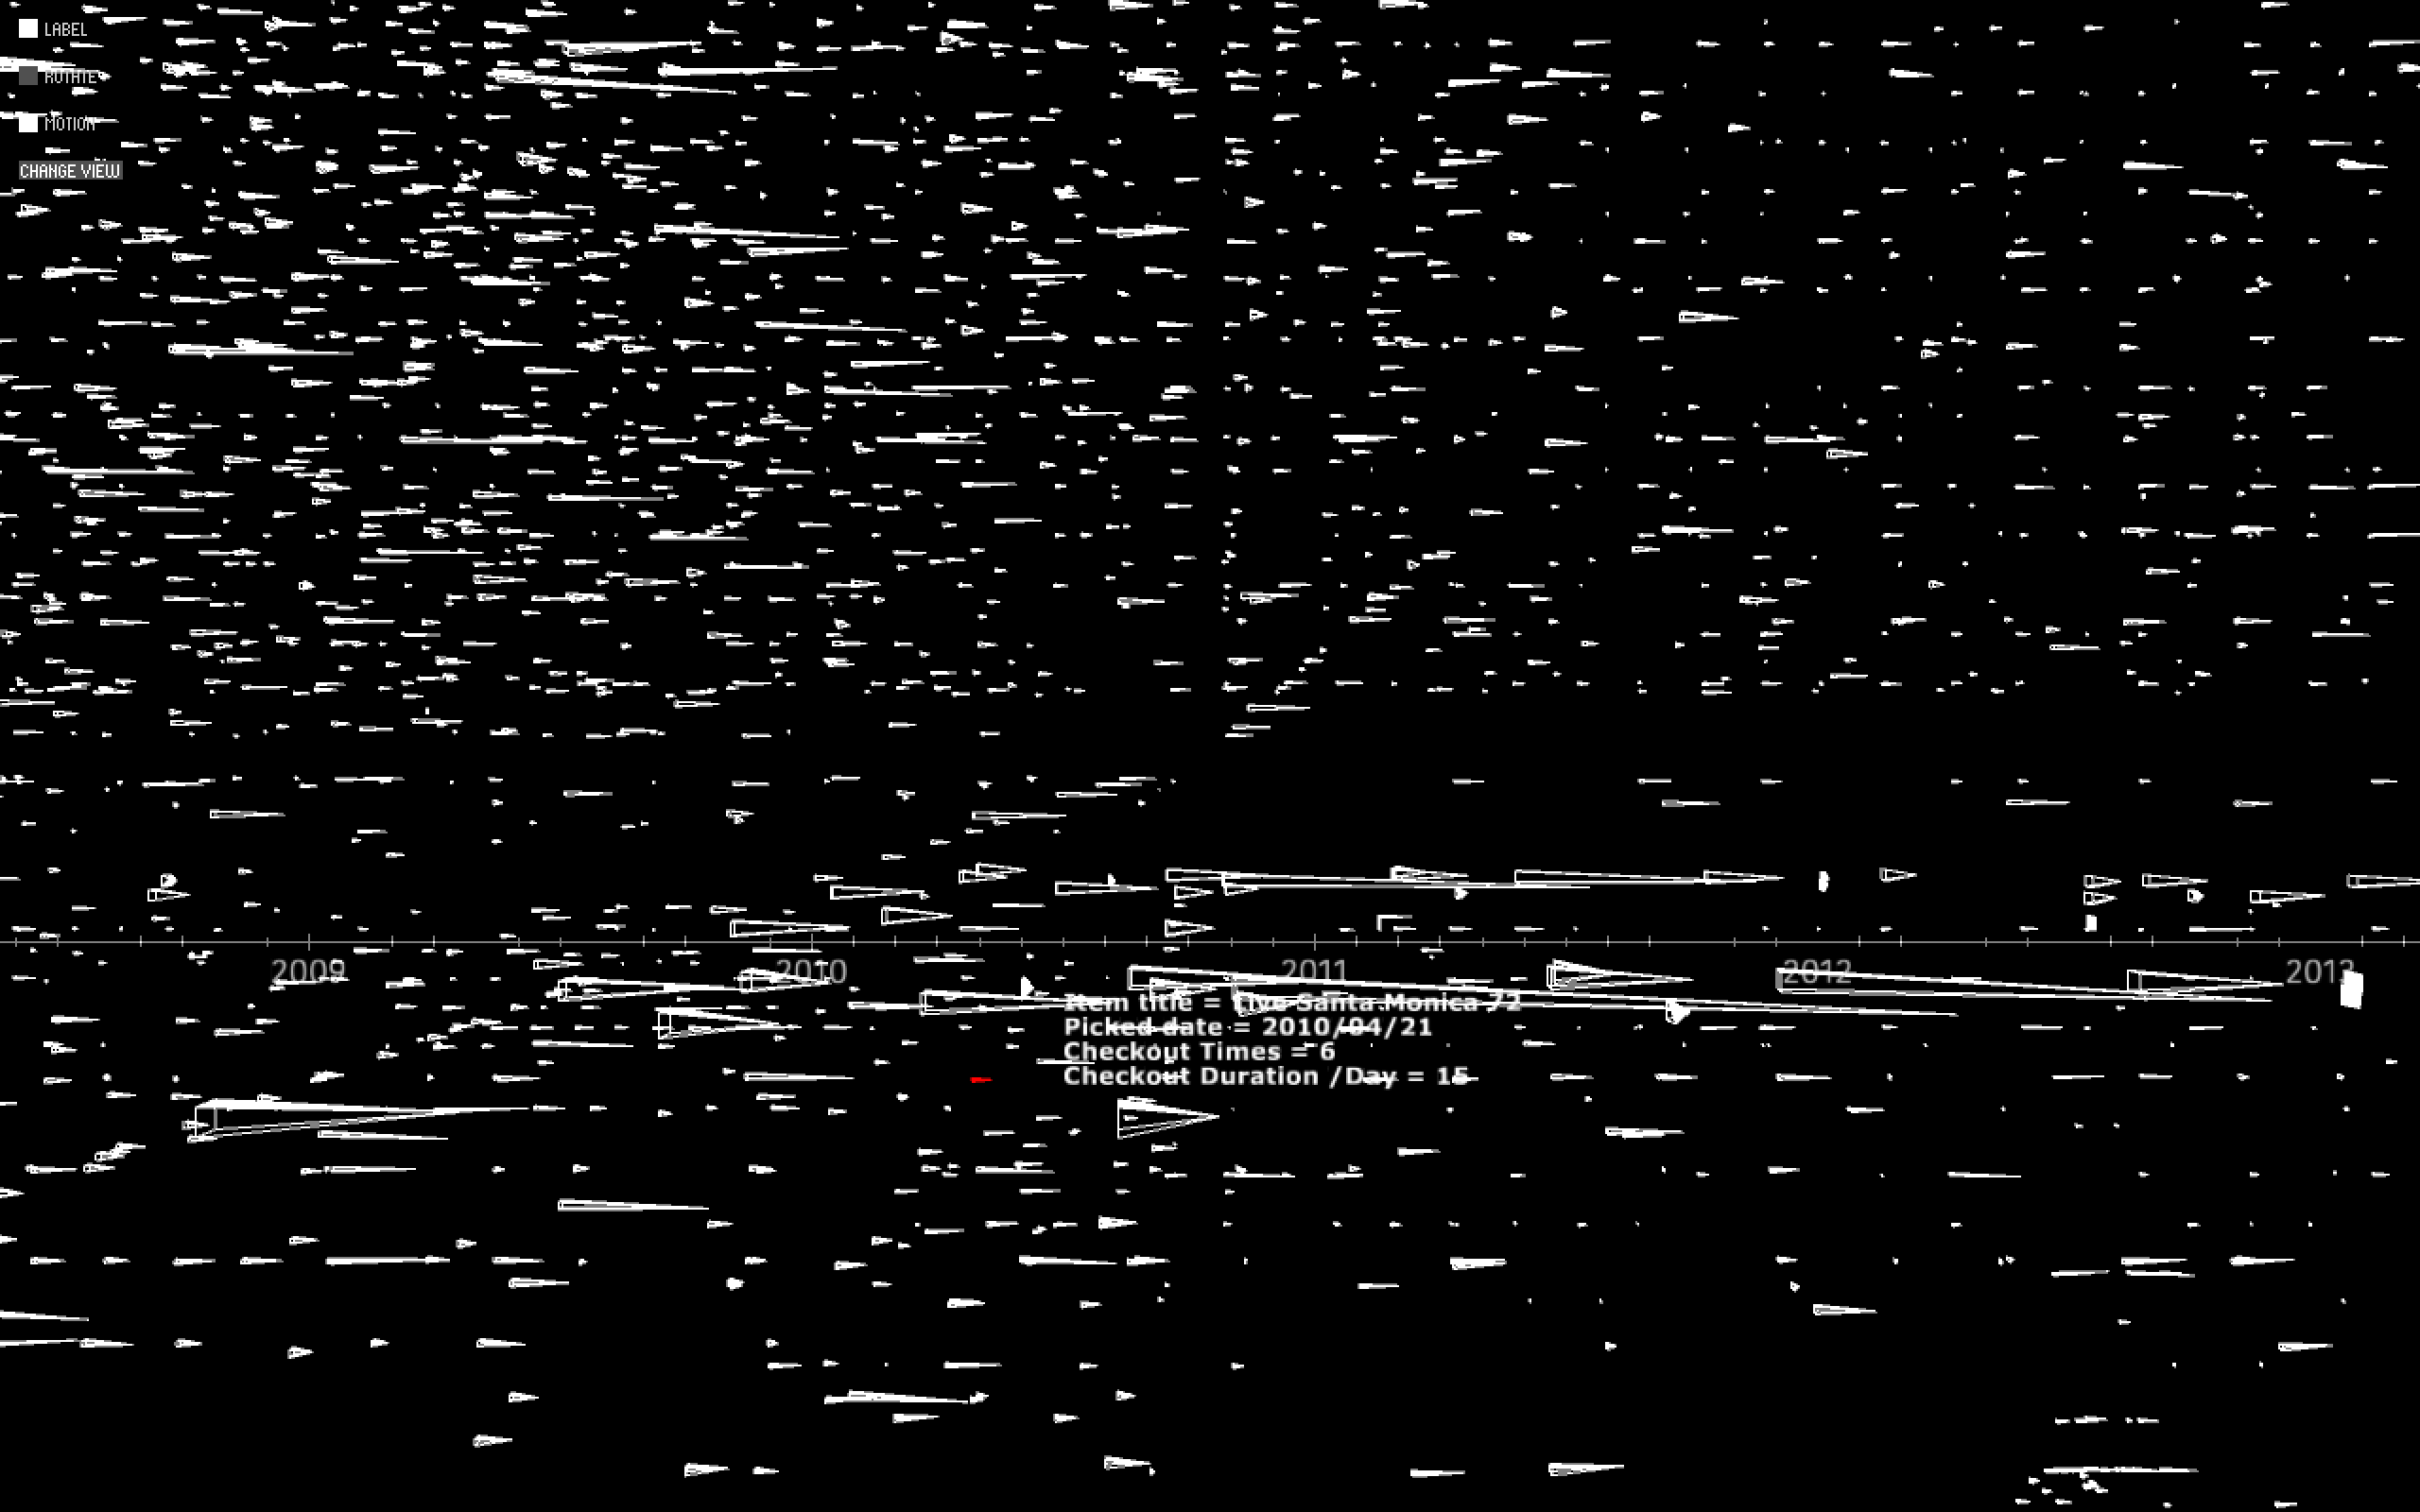
/ normal view
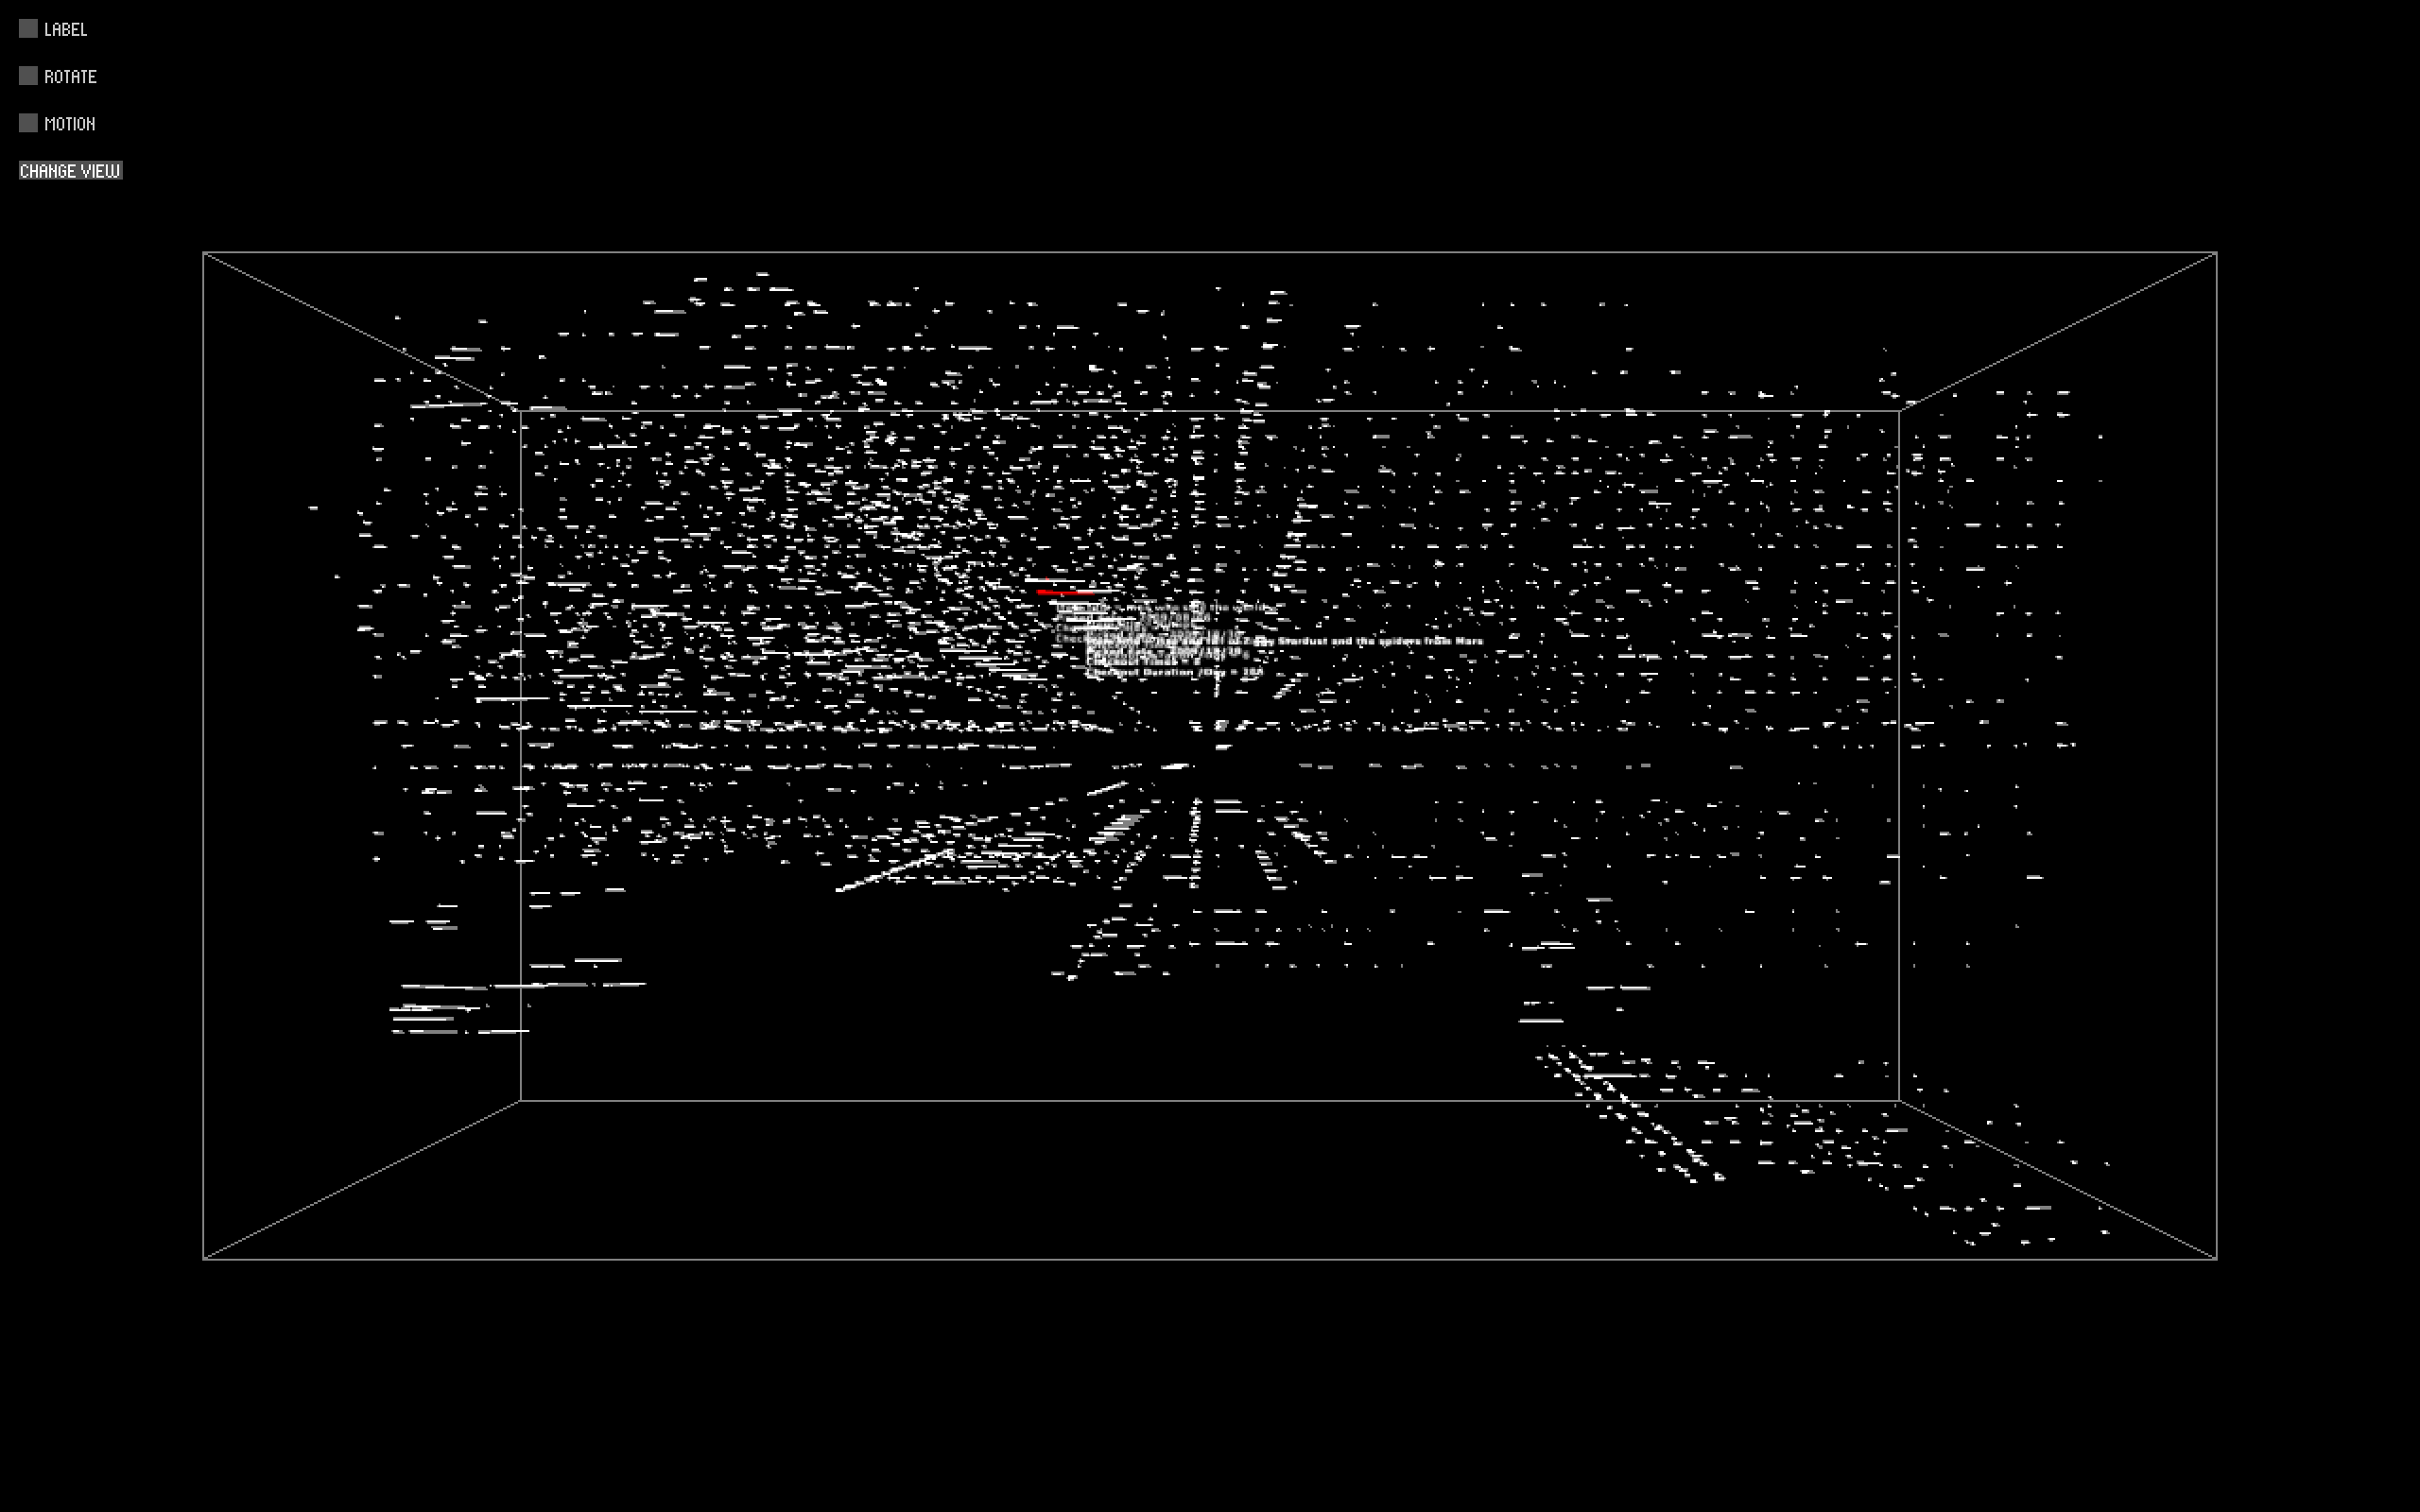
/ close view
Final result
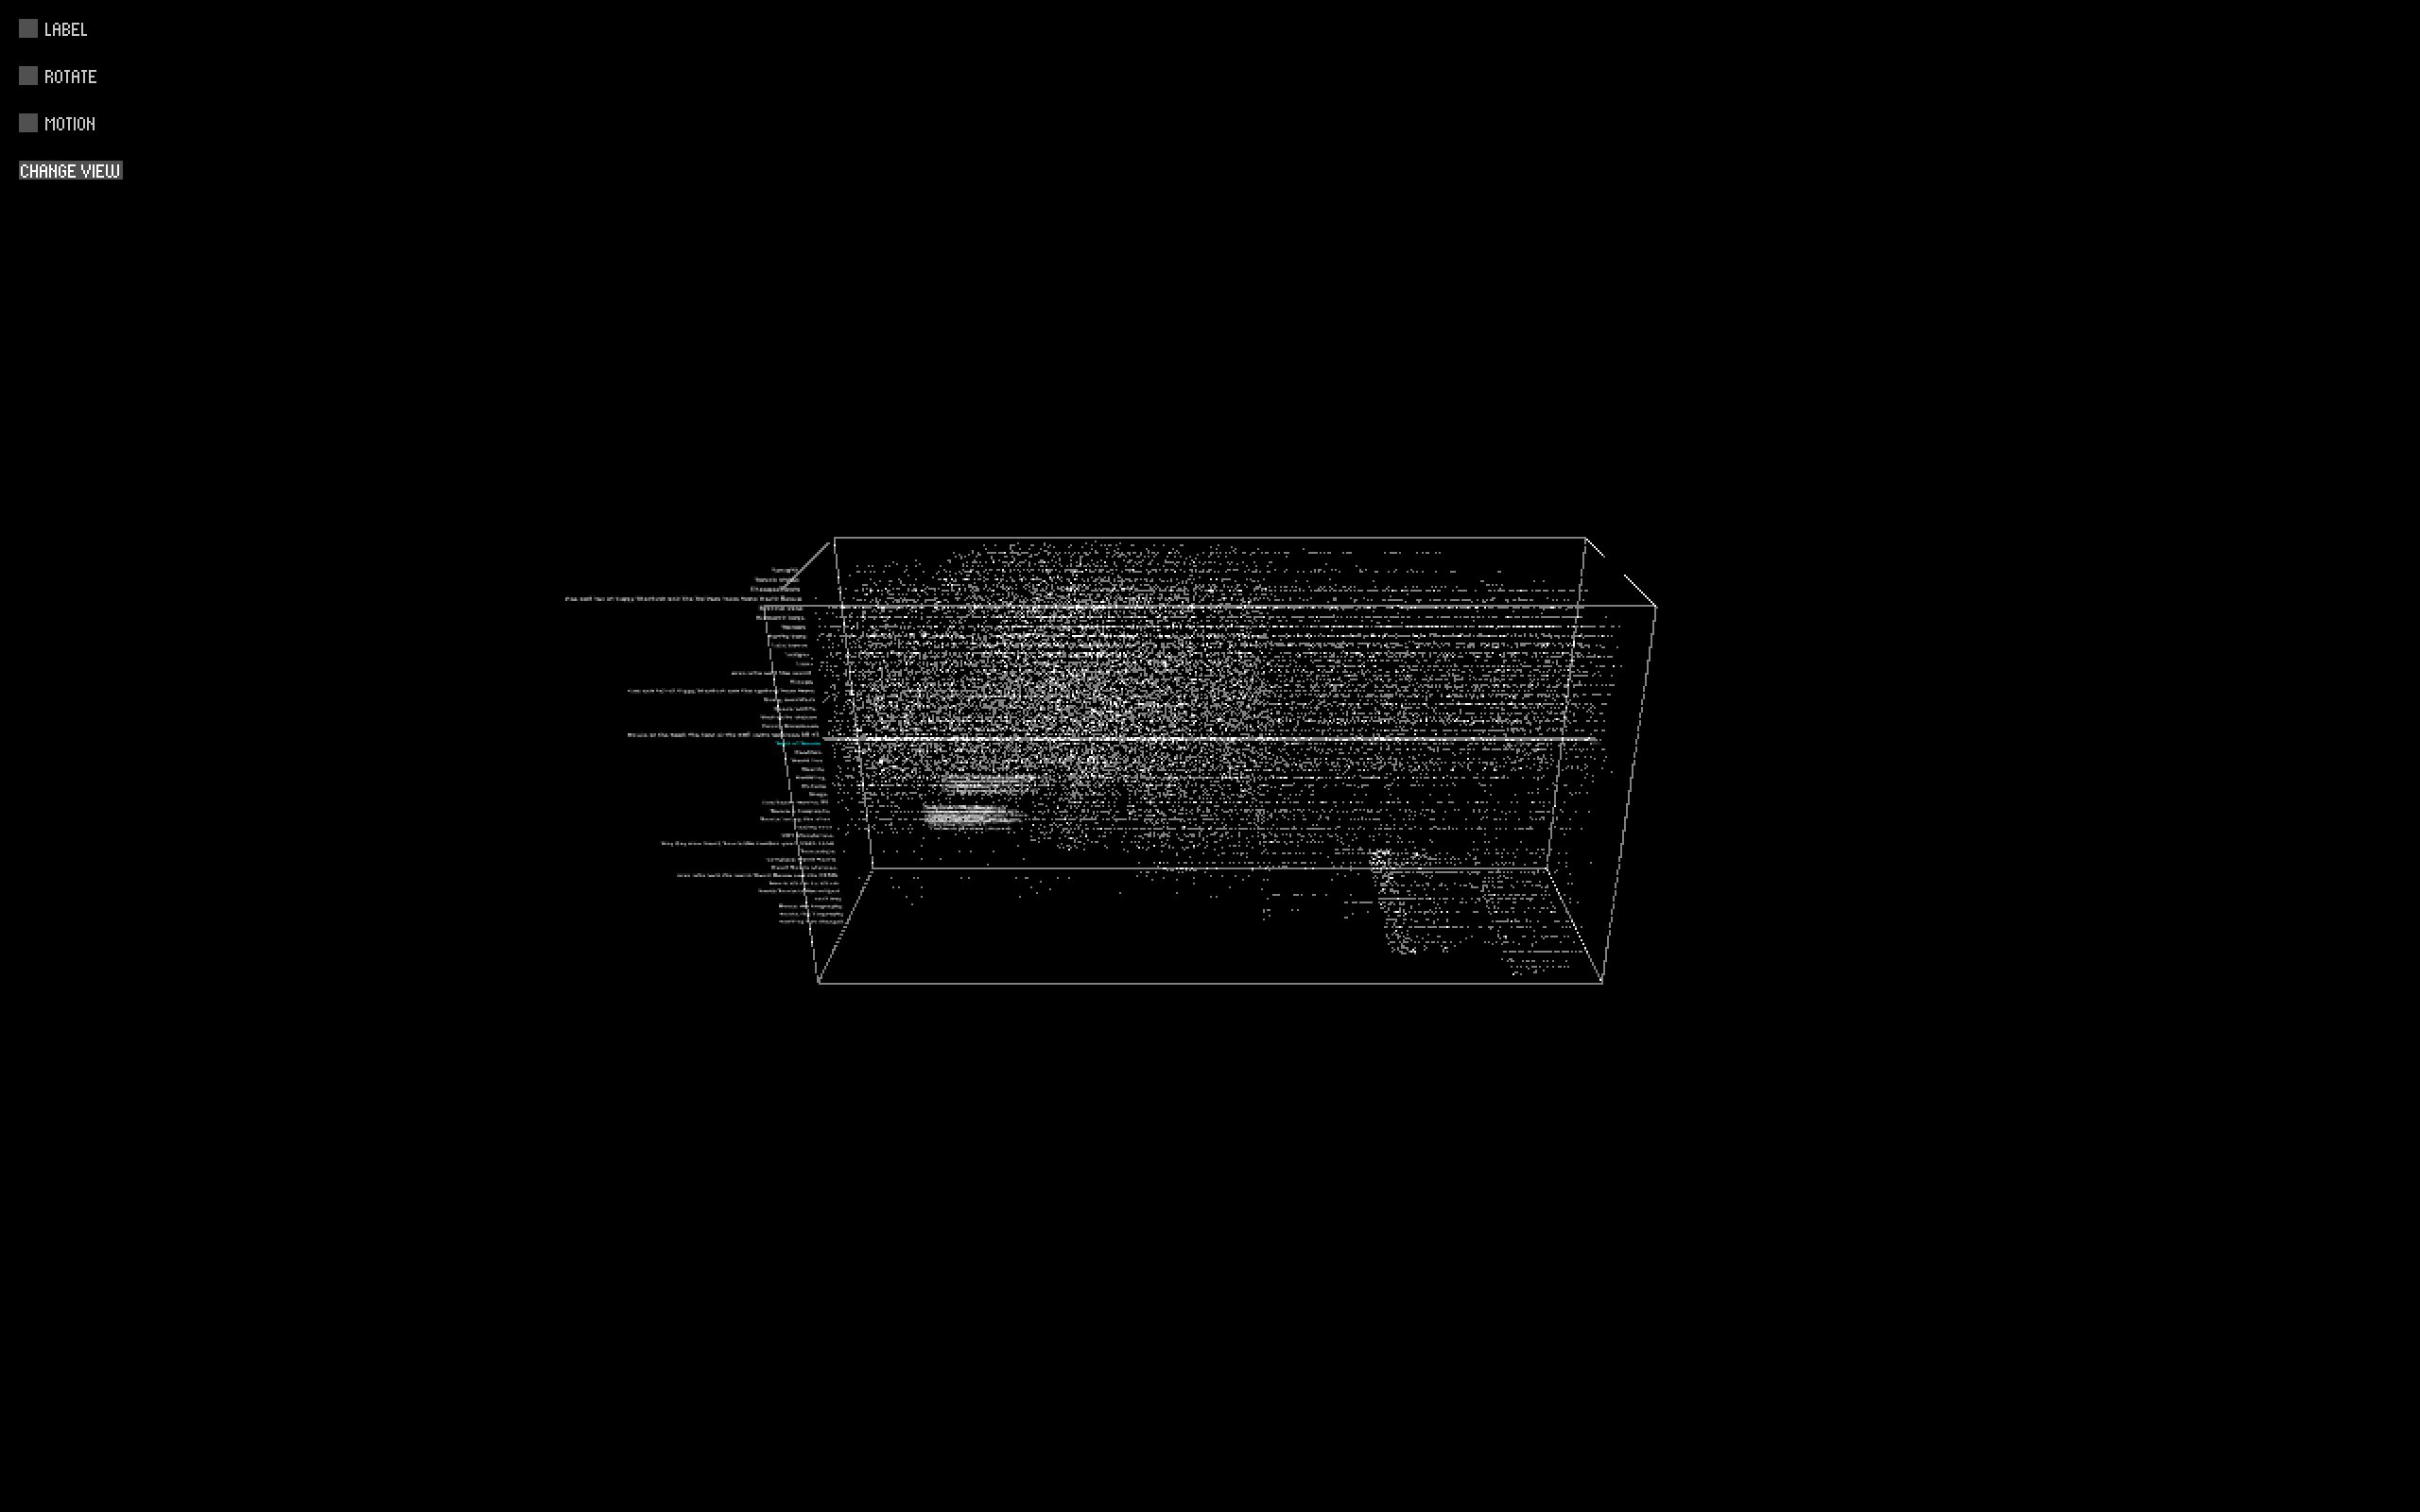
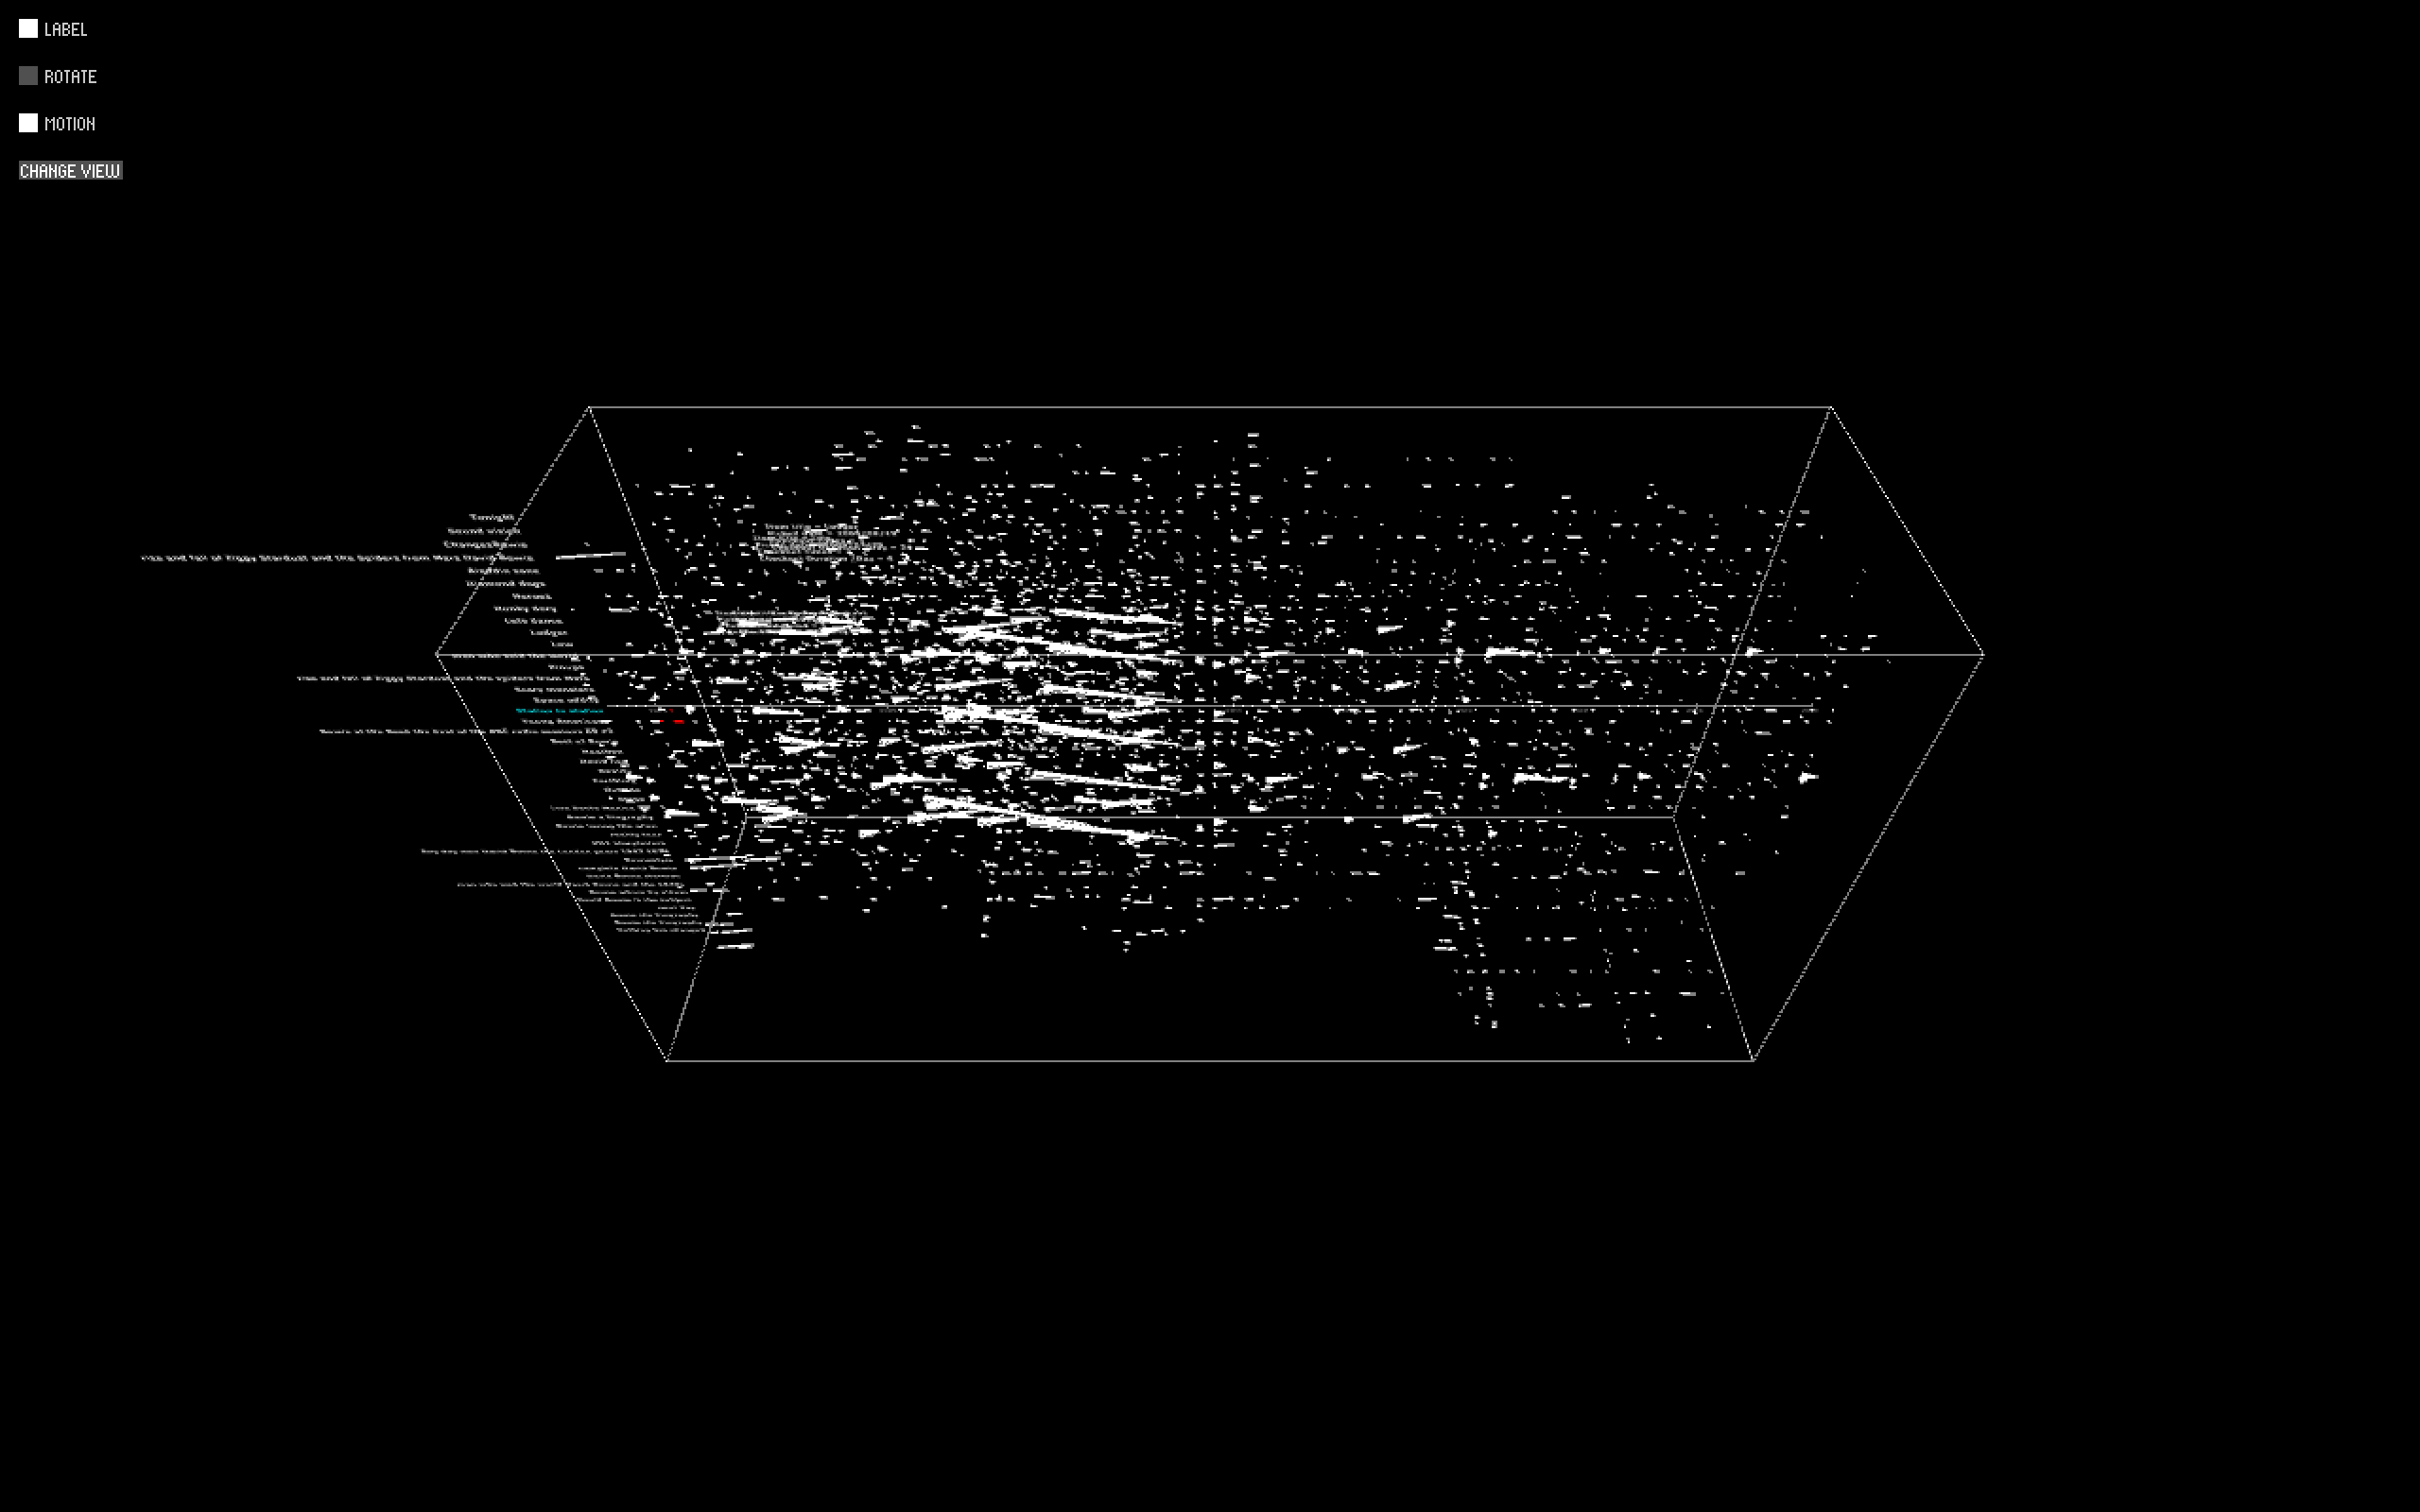
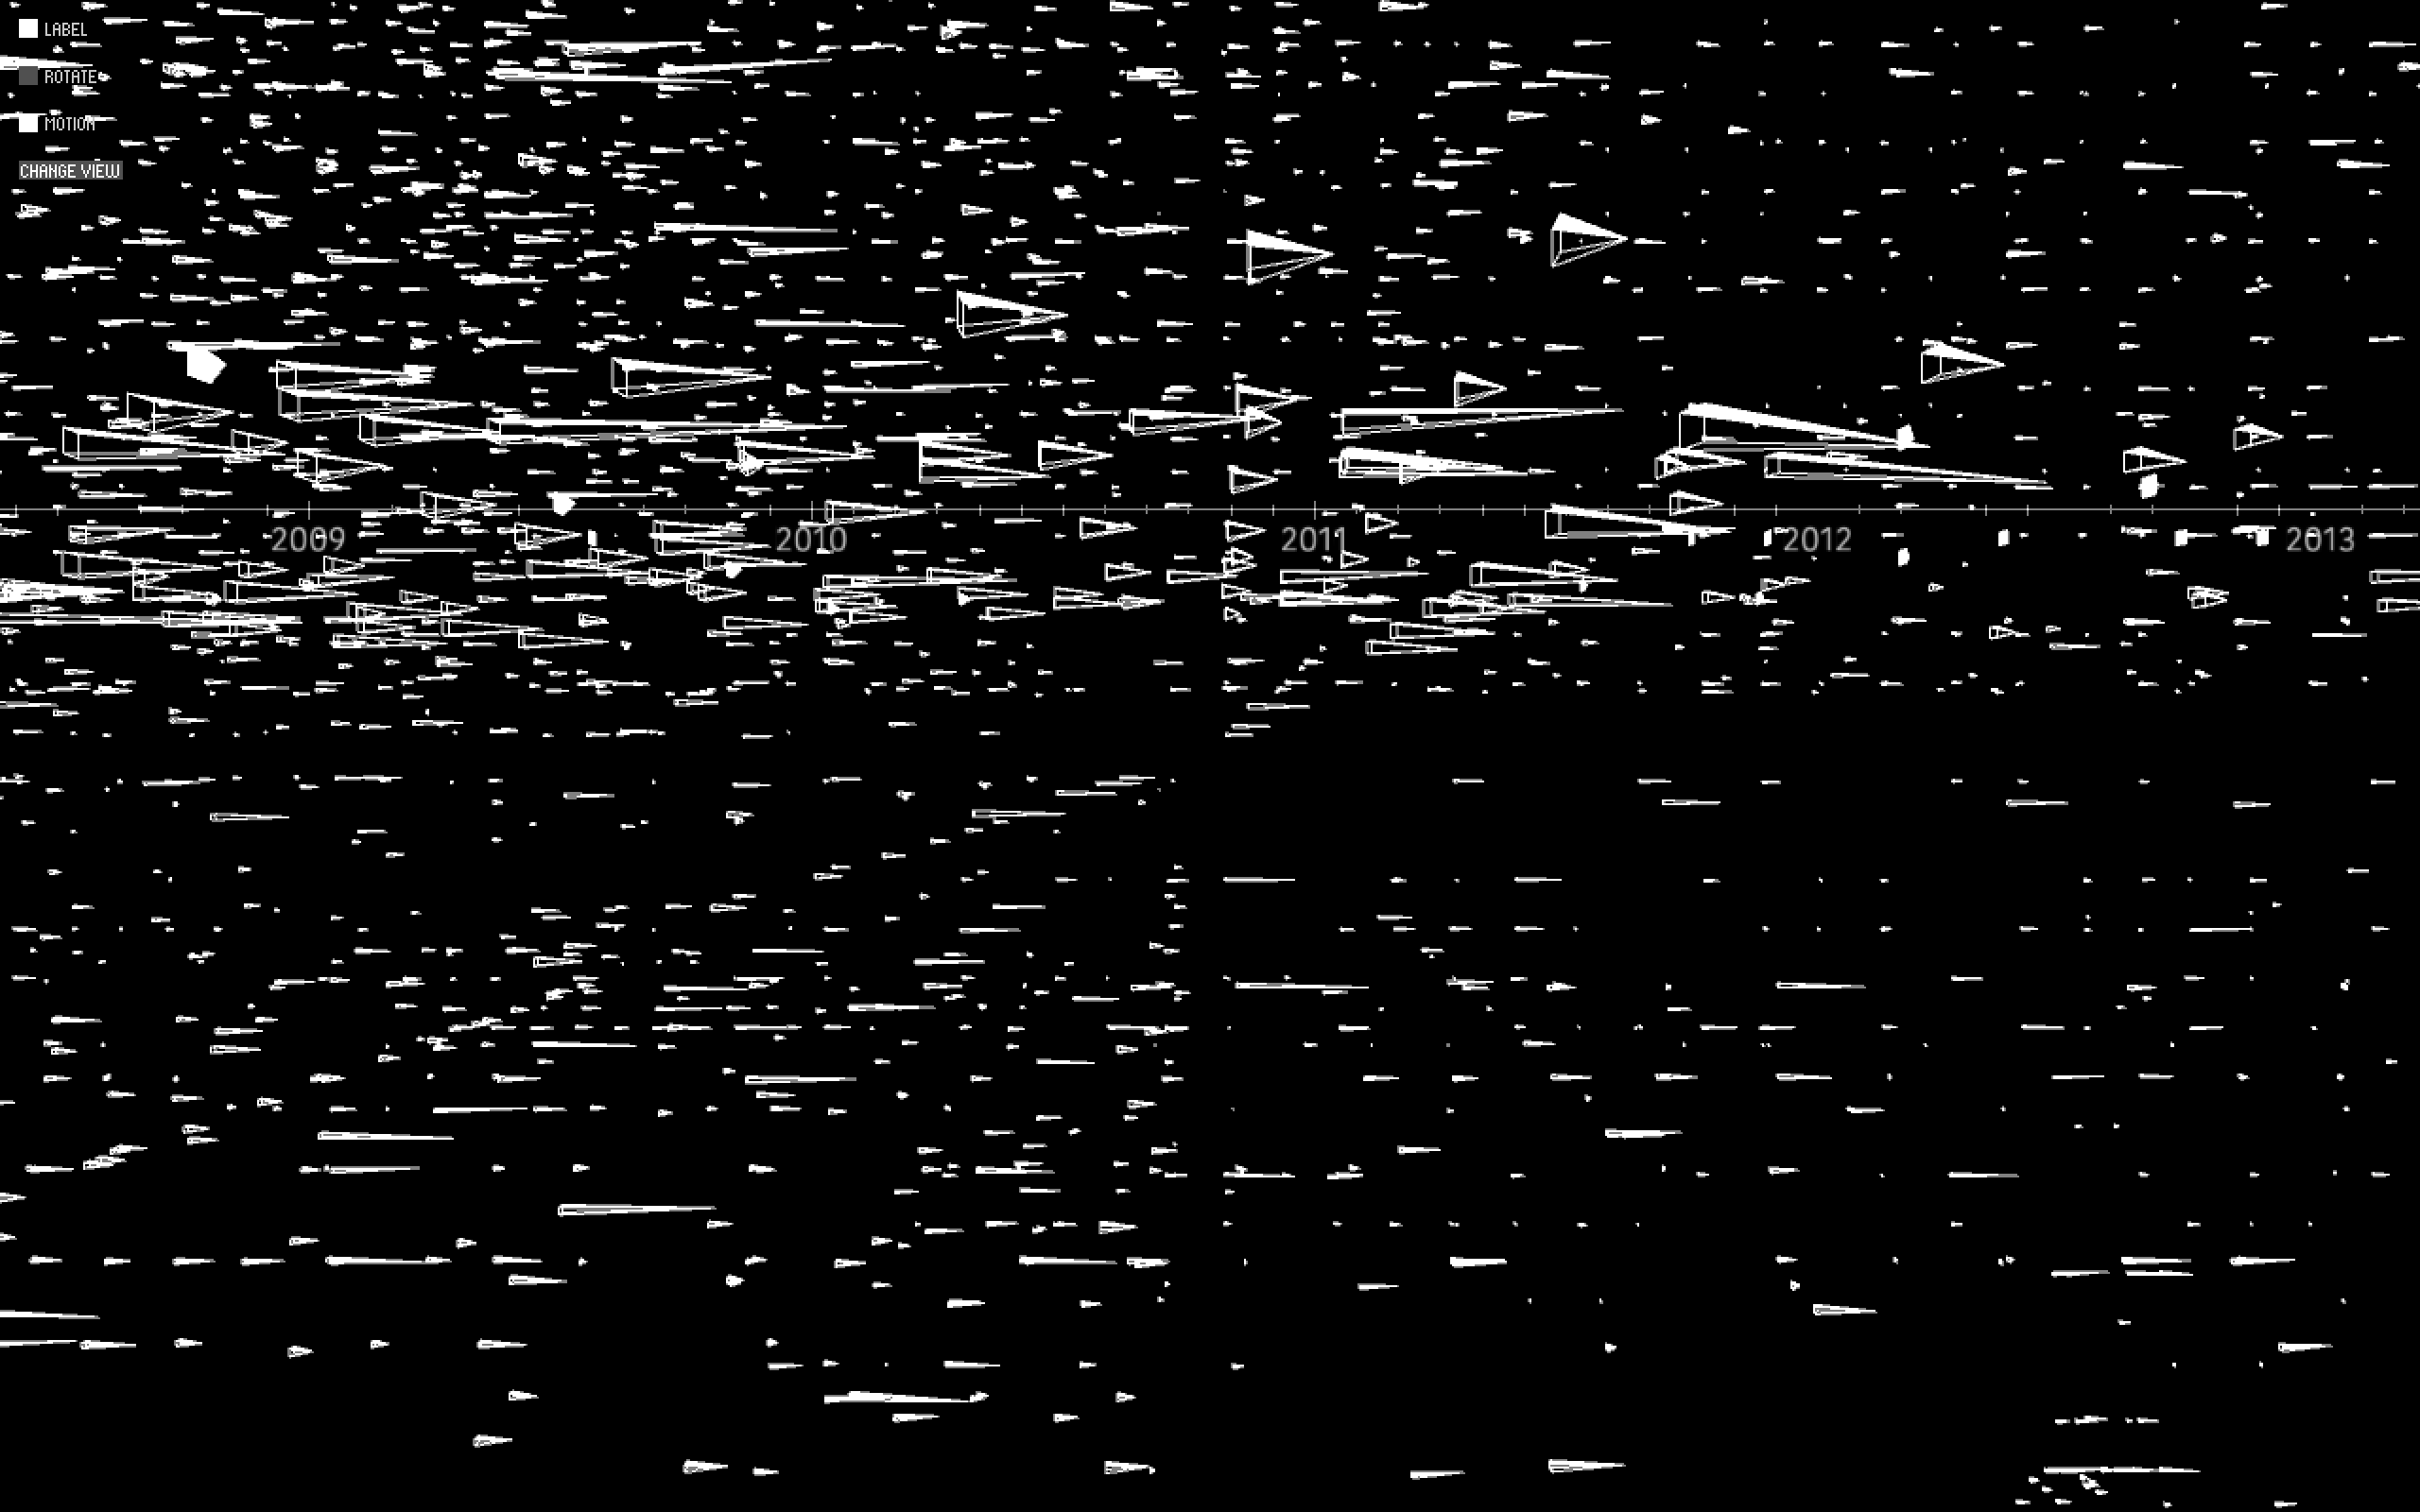
General layout
The river serves as the context and container of the events. Its x-axis is the timeline, and the y-axis shows each title. Each checkout event of the same day with the same title is displayed at the z-axis. The creature represents each checkout event which has two main characters the checkout times and duration. They are mapped to the events through two different methods: by scale and by motion. In scale method, the checkout duration is mapped to tail length, and checkout times mapped to square size. In motion method, the checkout duration is mapped to the tail rotate, and checkout times mapped to the fluctuation. Thought it is a little bit redundant to map the same information with two methods, I try to explore the dynamic of data visualization and provides audience with a livelier and more intuitive view of the data.
Interaction
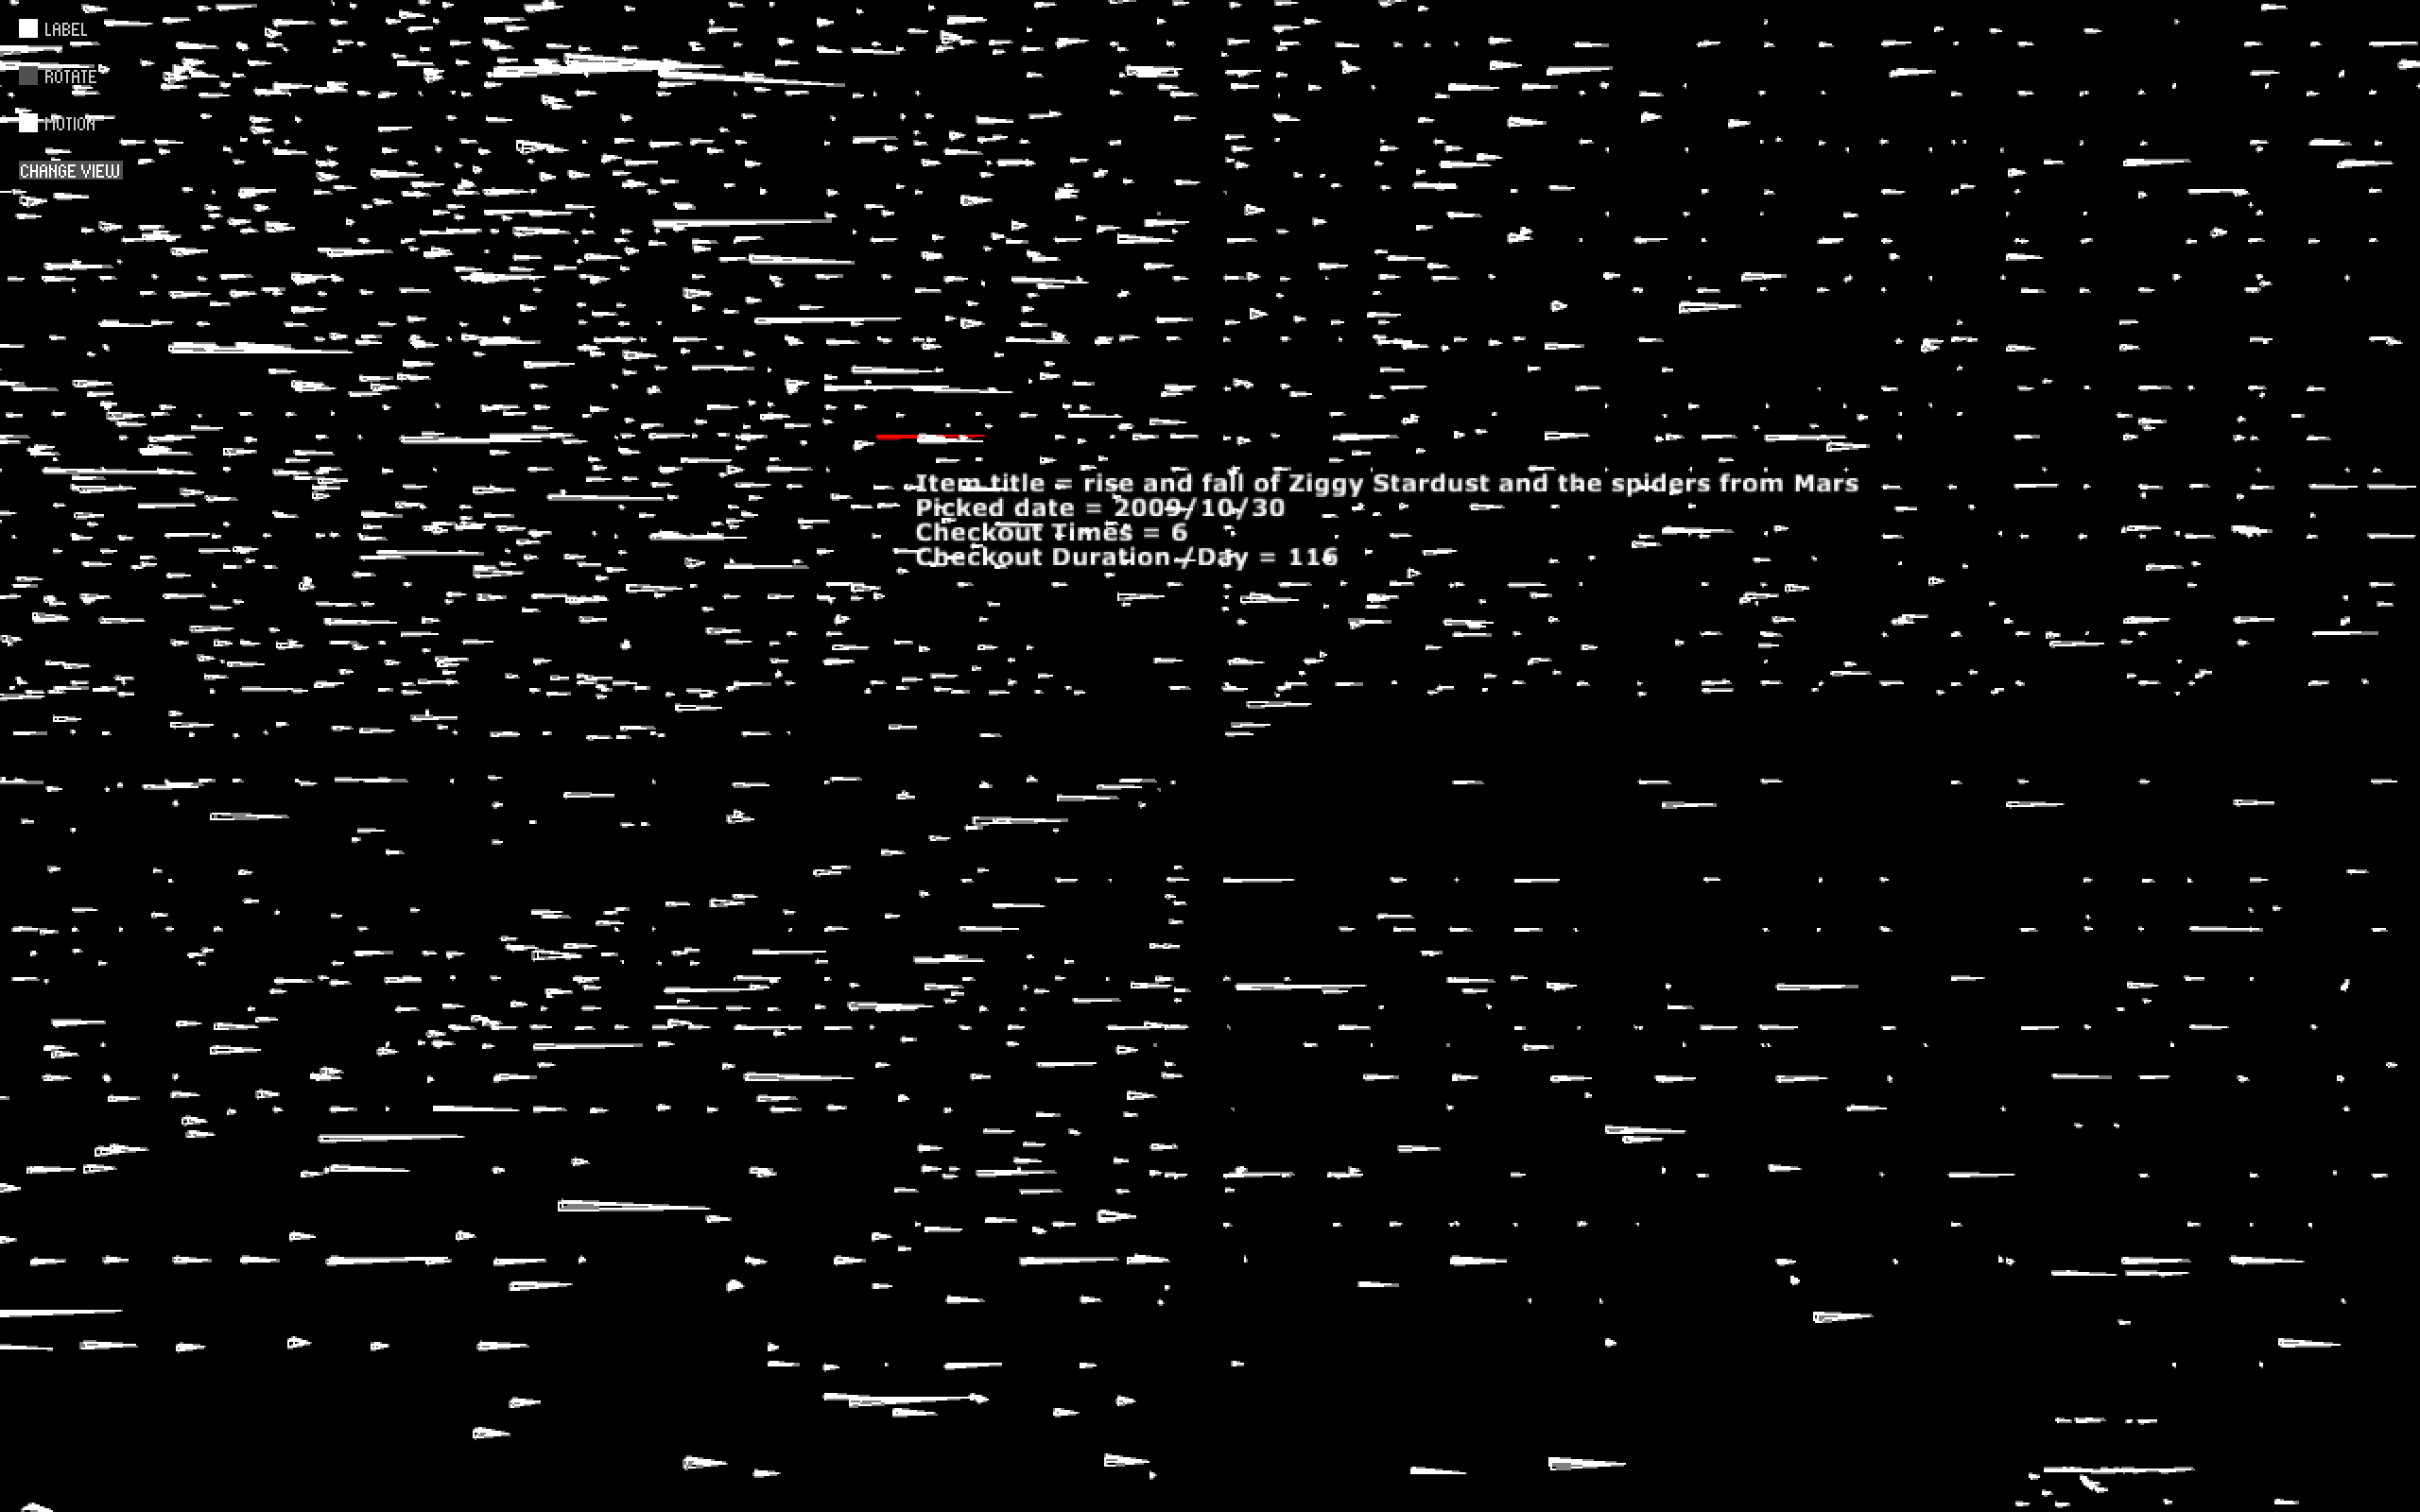
The labels and data display allows audience to play with the visualization, get a general feeling of the data, and examine the detail information contained inside. When the label is switched on, the user can pick one row of data by mouse and both the size and motion of that row will be exaggerated to provide a clearer view of comparison. The title will change its color according to the type of the item. Without the label, the user can pick out each single event using their mouse, and check the detailed information of title, date, checkout times and duration.
The interaction buttons are built through controlP5. There are two kinds of them: checkbox and button. The label, rotate, and motion function are controlled by checkbox, and different perspectives are controlled by button. By building the perspective mode, I would like to present a more complete version of the visualization. You can get a normal view, a closer view for detail information, a far away view for general pattern. And this general pattern could be explored better through rotate camera function. User can explore the density of checkout events through looking up side down to the river.
Moreover, though it is not fully complete, an idea of auto music display is added. When the mouse is stayed at a certain row (represent title) for a certain amount of time, the related music from that album will play automatically.
Technical Difficulty
The problem is that due to the huge amount of data (about 50000) the processing speed is really slow. The display is terribly stuck. To deal with the problem, I made three solutions. 1st, I separate the creature model buildup process and the draw process. So I build up the model of creatures of each event only once and draw them every time. 2nd, the portion of data drawn are related to the camera distance. That means the closer the river, the more data are present which is pretty reasonable comparing to how we look at things. 3rd, when display the general view, I use points instead of the objects to make the scene smoother.
Style
I continue the broad, rational, calm down, Ryoji Ikeda style in this visualization design. The creatures and river are all abstract and conceptual. And as it is said in the project 2, I like the way data pattern speaks for themselves, thus I make them the most important and obvious thing on the interface. And I make the labels, notes, and interaction switches as simple as possible to eliminate the distraction.
The river serves as the context and container of the events. Its x-axis is the timeline, and the y-axis shows each title. Each checkout event of the same day with the same title is displayed at the z-axis. The creature represents each checkout event which has two main characters the checkout times and duration. They are mapped to the events through two different methods: by scale and by motion. In scale method, the checkout duration is mapped to tail length, and checkout times mapped to square size. In motion method, the checkout duration is mapped to the tail rotate, and checkout times mapped to the fluctuation. Thought it is a little bit redundant to map the same information with two methods, I try to explore the dynamic of data visualization and provides audience with a livelier and more intuitive view of the data.
Interaction
The labels and data display allows audience to play with the visualization, get a general feeling of the data, and examine the detail information contained inside. When the label is switched on, the user can pick one row of data by mouse and both the size and motion of that row will be exaggerated to provide a clearer view of comparison. The title will change its color according to the type of the item. Without the label, the user can pick out each single event using their mouse, and check the detailed information of title, date, checkout times and duration.
The interaction buttons are built through controlP5. There are two kinds of them: checkbox and button. The label, rotate, and motion function are controlled by checkbox, and different perspectives are controlled by button. By building the perspective mode, I would like to present a more complete version of the visualization. You can get a normal view, a closer view for detail information, a far away view for general pattern. And this general pattern could be explored better through rotate camera function. User can explore the density of checkout events through looking up side down to the river.
Moreover, though it is not fully complete, an idea of auto music display is added. When the mouse is stayed at a certain row (represent title) for a certain amount of time, the related music from that album will play automatically.
Technical Difficulty
The problem is that due to the huge amount of data (about 50000) the processing speed is really slow. The display is terribly stuck. To deal with the problem, I made three solutions. 1st, I separate the creature model buildup process and the draw process. So I build up the model of creatures of each event only once and draw them every time. 2nd, the portion of data drawn are related to the camera distance. That means the closer the river, the more data are present which is pretty reasonable comparing to how we look at things. 3rd, when display the general view, I use points instead of the objects to make the scene smoother.
Style
I continue the broad, rational, calm down, Ryoji Ikeda style in this visualization design. The creatures and river are all abstract and conceptual. And as it is said in the project 2, I like the way data pattern speaks for themselves, thus I make them the most important and obvious thing on the interface. And I make the labels, notes, and interaction switches as simple as possible to eliminate the distraction.
Code