[3D] When "New" Books Are No Longer New
MAT 259, 2016
Chang He
Concept
It's a common situation that library buys new books every several months or each year, so does Seattle Public Library. Therefore my idea is to explore the checkout frequencies and popularities of recently bought new books in Seattle Public Library. I continued to dig deep on my interest by asking how does these "new" book attract readers over time. And I also categorize new books into fictions and non-fictions in order to compared their patterns.
I was inspired by a concept in Business Intelligence, called OLAP Cube. And Karl Yerkes' work also inspired the way I visualize my data. In my previous design, 2D visualization, I used a lot of aggregation data in my project. So all the numbers are summed up by month or year. However, Karl did it in another way, which is to use every single data. I really like this perspective. So I chose to visualize my data in this way, show every single record that are related to my topic instead of using aggregation function and use summed up numbers. As for OLAP Cude, it provides different perspectives to look at the same dataset in order to obtain more information. It inspired me to make my visualization multi-dimentioned as well.
I was inspired by a concept in Business Intelligence, called OLAP Cube. And Karl Yerkes' work also inspired the way I visualize my data. In my previous design, 2D visualization, I used a lot of aggregation data in my project. So all the numbers are summed up by month or year. However, Karl did it in another way, which is to use every single data. I really like this perspective. So I chose to visualize my data in this way, show every single record that are related to my topic instead of using aggregation function and use summed up numbers. As for OLAP Cude, it provides different perspectives to look at the same dataset in order to obtain more information. It inspired me to make my visualization multi-dimentioned as well.
Query
I did query based on my interest of data: fiction and non-fiction checkouts for 2015, 2014 and 2013. Because of the data size, I export them into 6 file: fiction for 2015, 2014, 2013 and non-fiction for 2015, 2014, 2013.
The total data size is about 56 Mb, which includes 663,778 records, which is a half million. And my project visualizes every single of them. I wrote 6 queries to obtain all the data I need by publication year and book type. Here is the one to obtain new fictions published in 2015.
For other 5 queries, just change "right(callNumber, 4)" and "length(deweyClass) in where clause to corresponded publication year and book type.
The total data size is about 56 Mb, which includes 663,778 records, which is a half million. And my project visualizes every single of them. I wrote 6 queries to obtain all the data I need by publication year and book type. Here is the one to obtain new fictions published in 2015.
SELECT
    spl.transactions.bibNumber,
    spl.transactions.itemNumber,
    spl.title.title,
    spl.transactions.checkOut,
    TIMESTAMPDIFF(DAY, checkOut, checkInFirst)  AS 'check Out Days'

FROM
    spl.transactions, spl.callNumber, spl.deweyClass, spl.collectionCode, spl.itemType, spl.title

WHERE
    spl.callNumber.itemNumber = spl.transactions.itemNumber
    AND spl.deweyClass.bibNumber = spl.transactions.bibNumber
    AND spl.collectionCode.itemNumber = spl.transactions.itemNumber
    AND spl.itemType.itemNumber = spl.transactions.itemNumber
    And spl.title.bibNumber = spl.transactions.bibNumber
    AND substring(collectionCode from 3 for 3) = 'new'
    AND right(callNumber, 4) = 2015
    AND length(deweyClass) = 0
    AND itemType = 'acbk'
    AND checkOut != "1970-01-01 00:00:00"
    AND TIMESTAMPDIFF(DAY, checkOut, checkInFirst) >= 0
ORDER BY checkOut,  bibNumber, itemNumber
For other 5 queries, just change "right(callNumber, 4)" and "length(deweyClass) in where clause to corresponded publication year and book type.
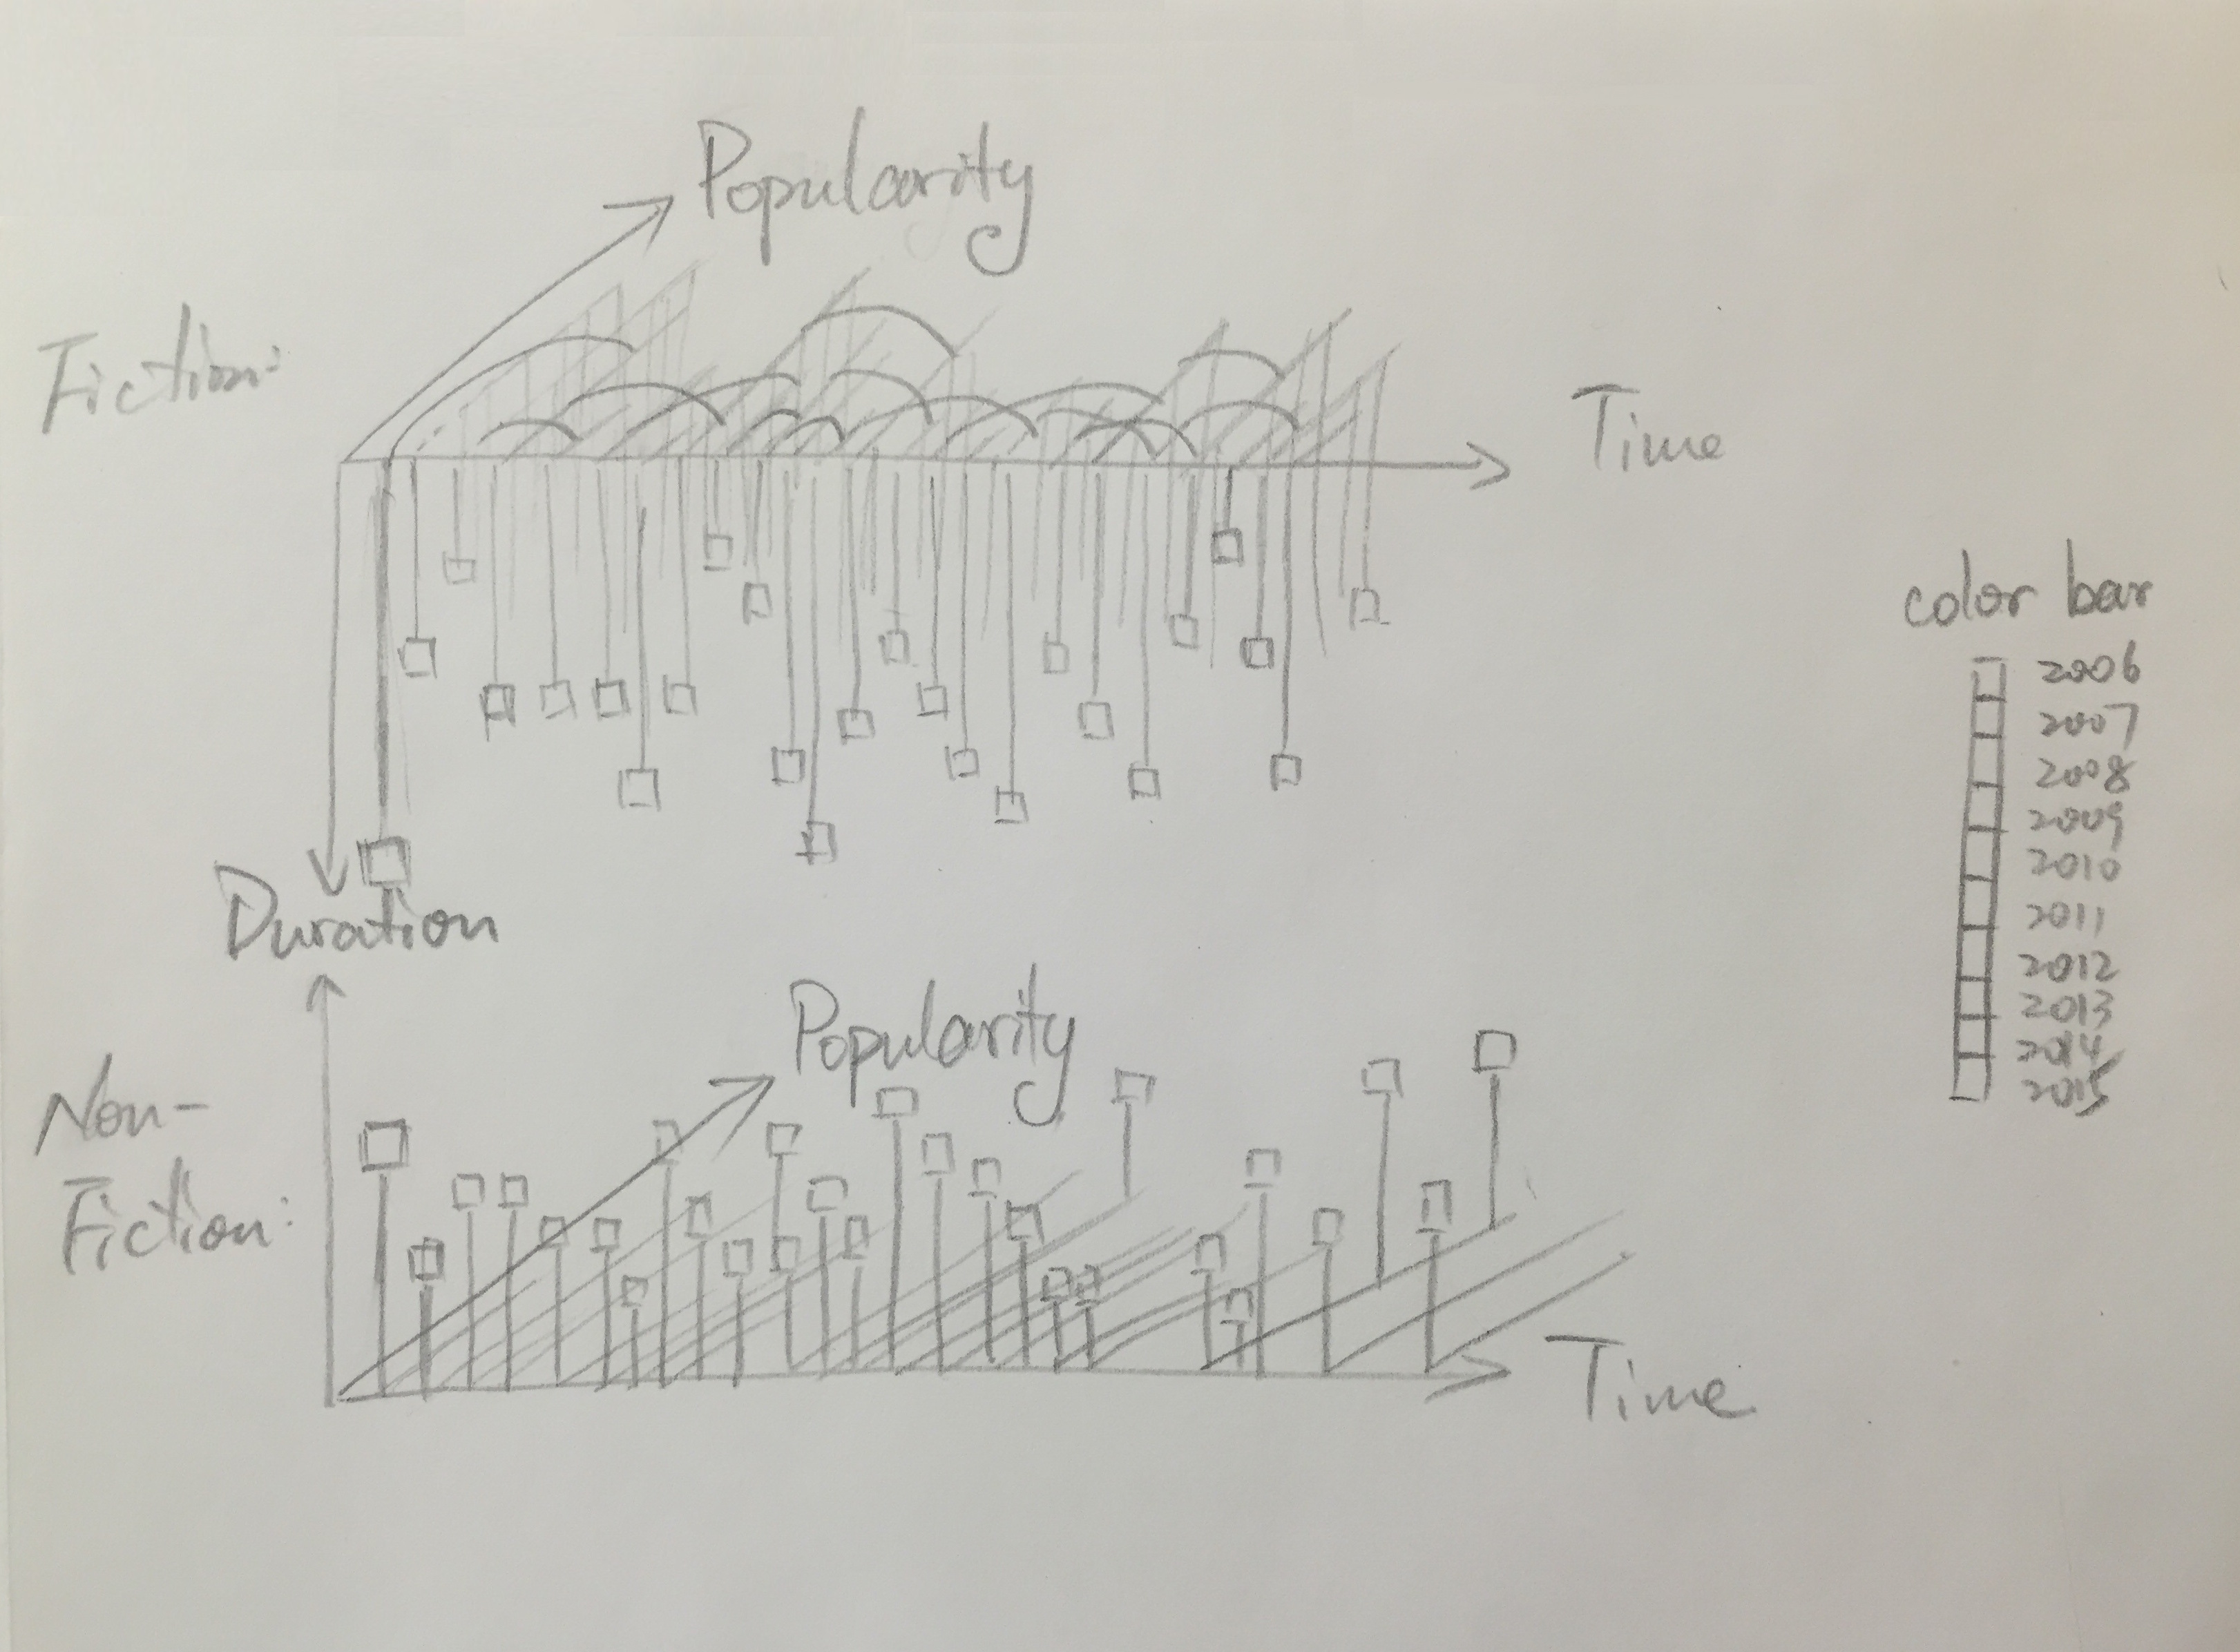
Preliminary sketches
My idea is to enumerates every checkout records of new books based on its checkout time, checkout duration and publication year with book type. To compare fictions to non-fiction books, I place them one on the top, the other on the bottom.
Process
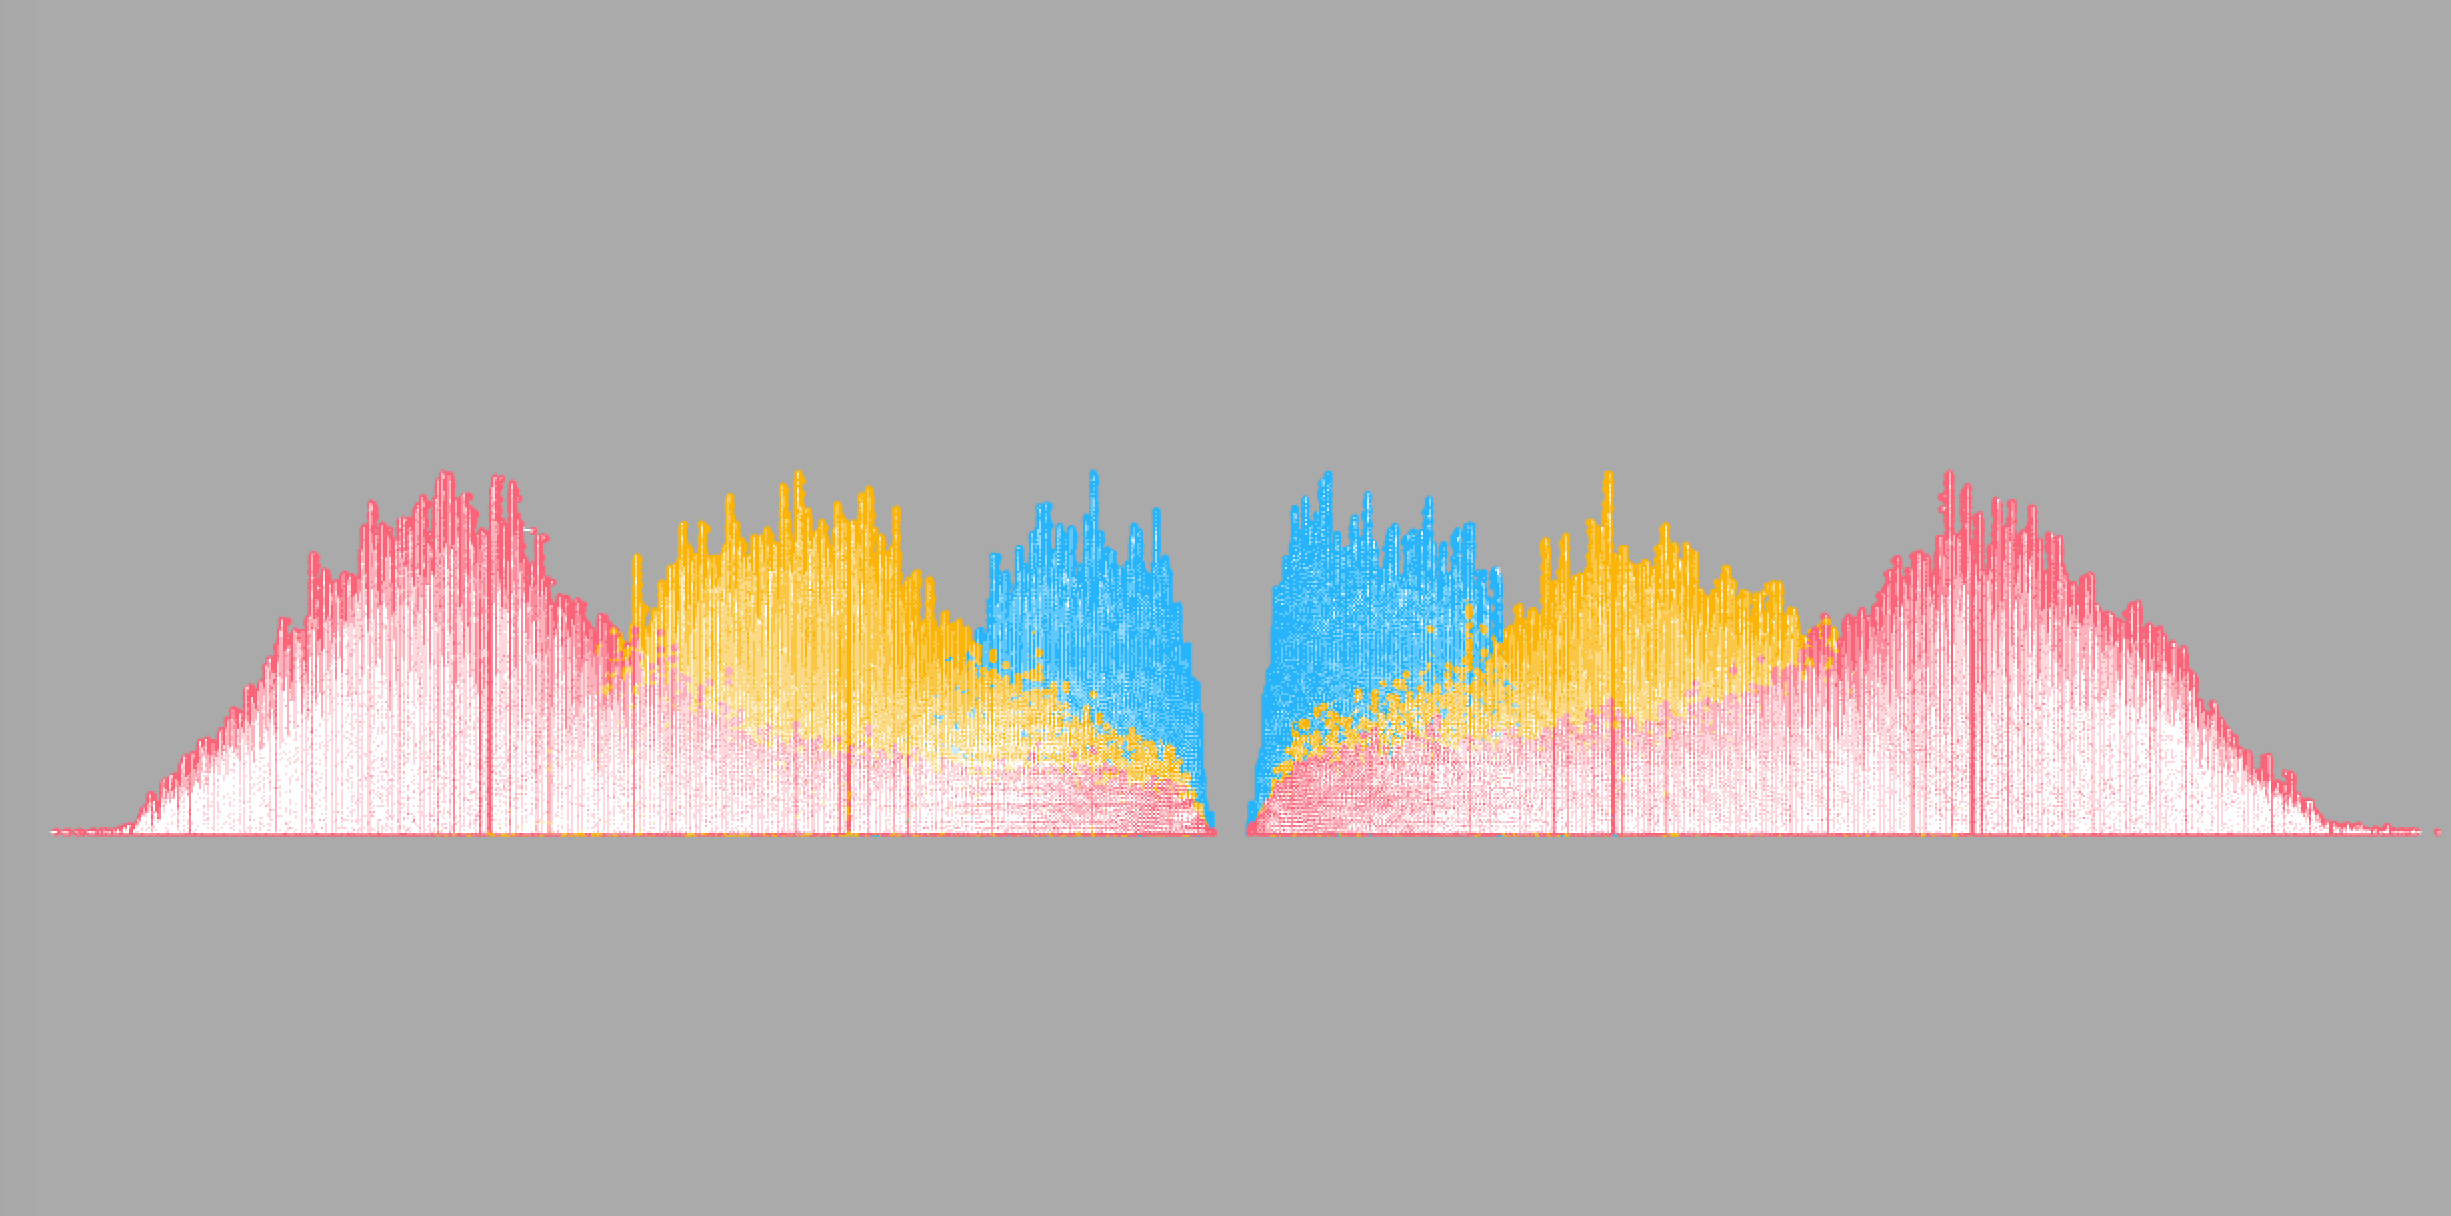
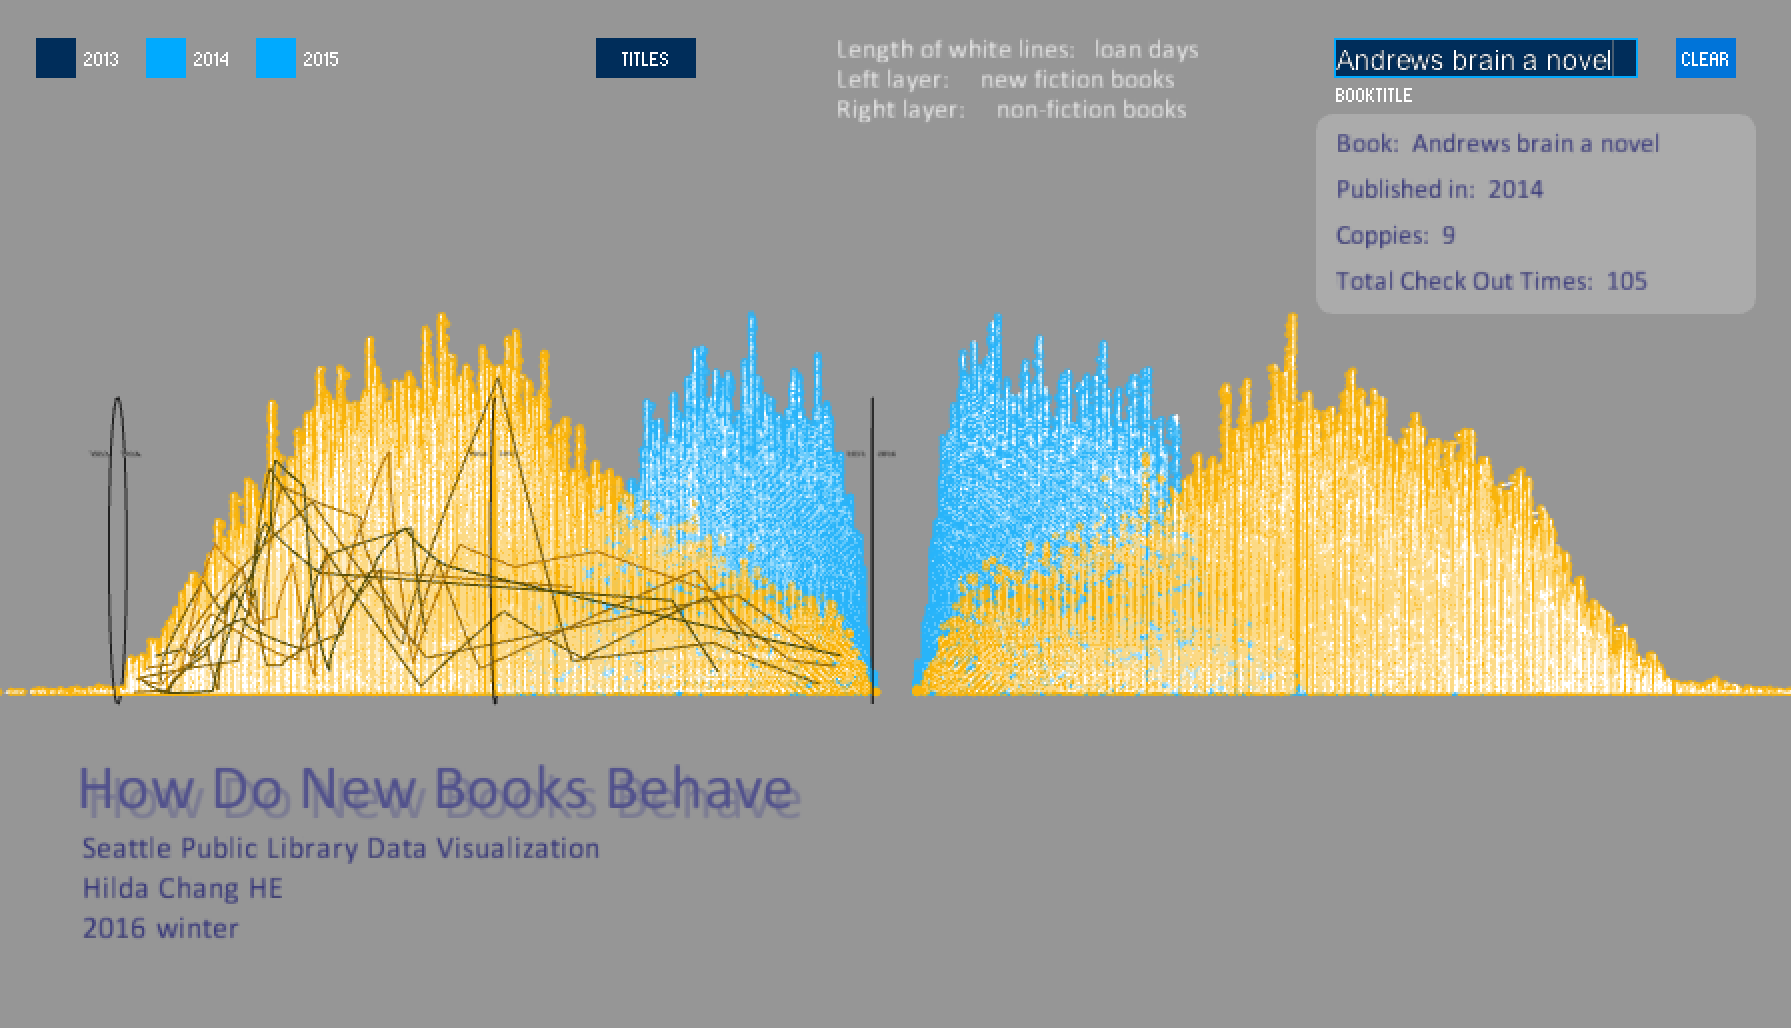
This is the first time I pulled out every single of my data using my design. Blue means the book is published in 2015. Yellow means 2014, and 2013 publications is made in red color. Colors in the left hand side represents the fictions, right hand side is the non-fiction data. And we are looking from the top view.
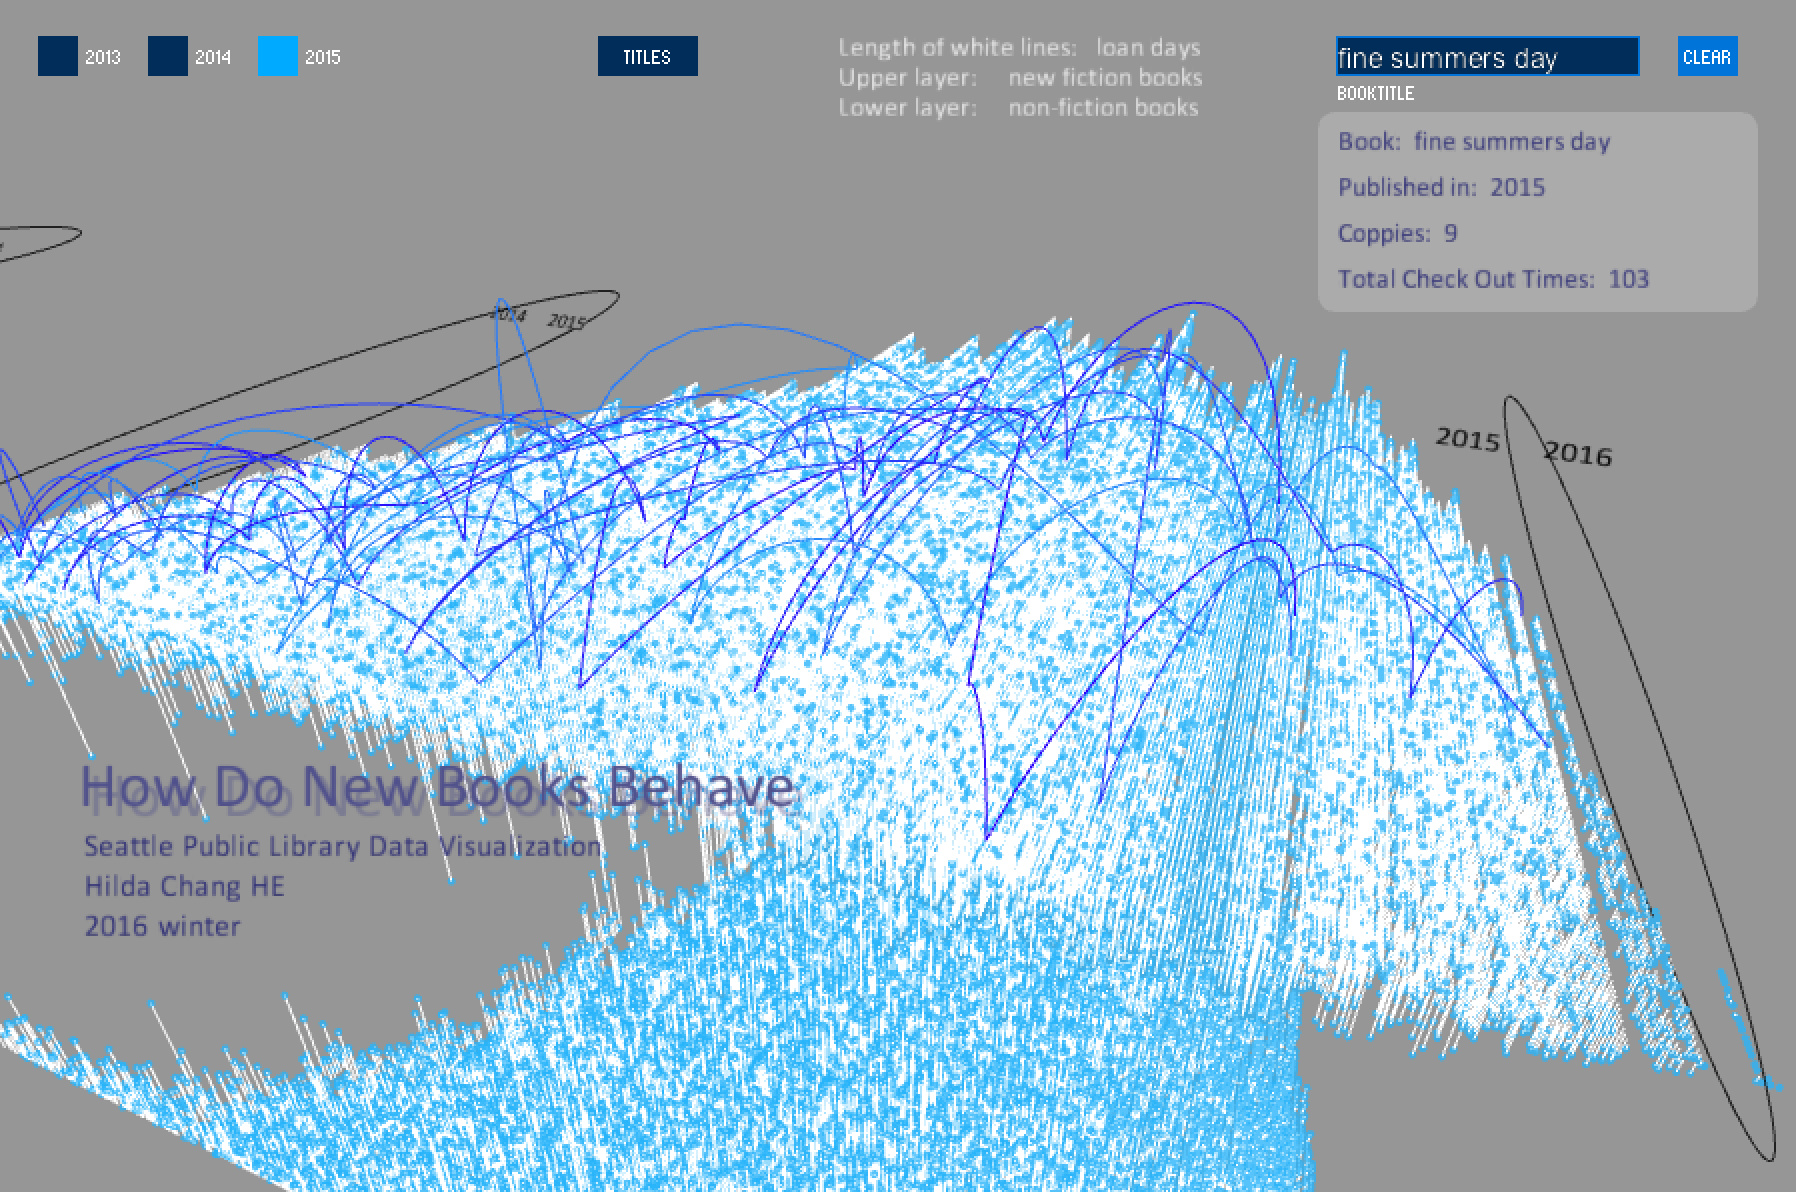
After implement the major part, I decided to add another funtion to reveal low-level information inside the data set. Because the data set used by my project is big, which include millions records. So the visualization tends to reveal high-level information, which is more general. User can see clearly about patterns and trends. However, I want the program also be able to show detailed information about individual books, which means the visualization can zoom out from "overview" to zoom in at "insite".
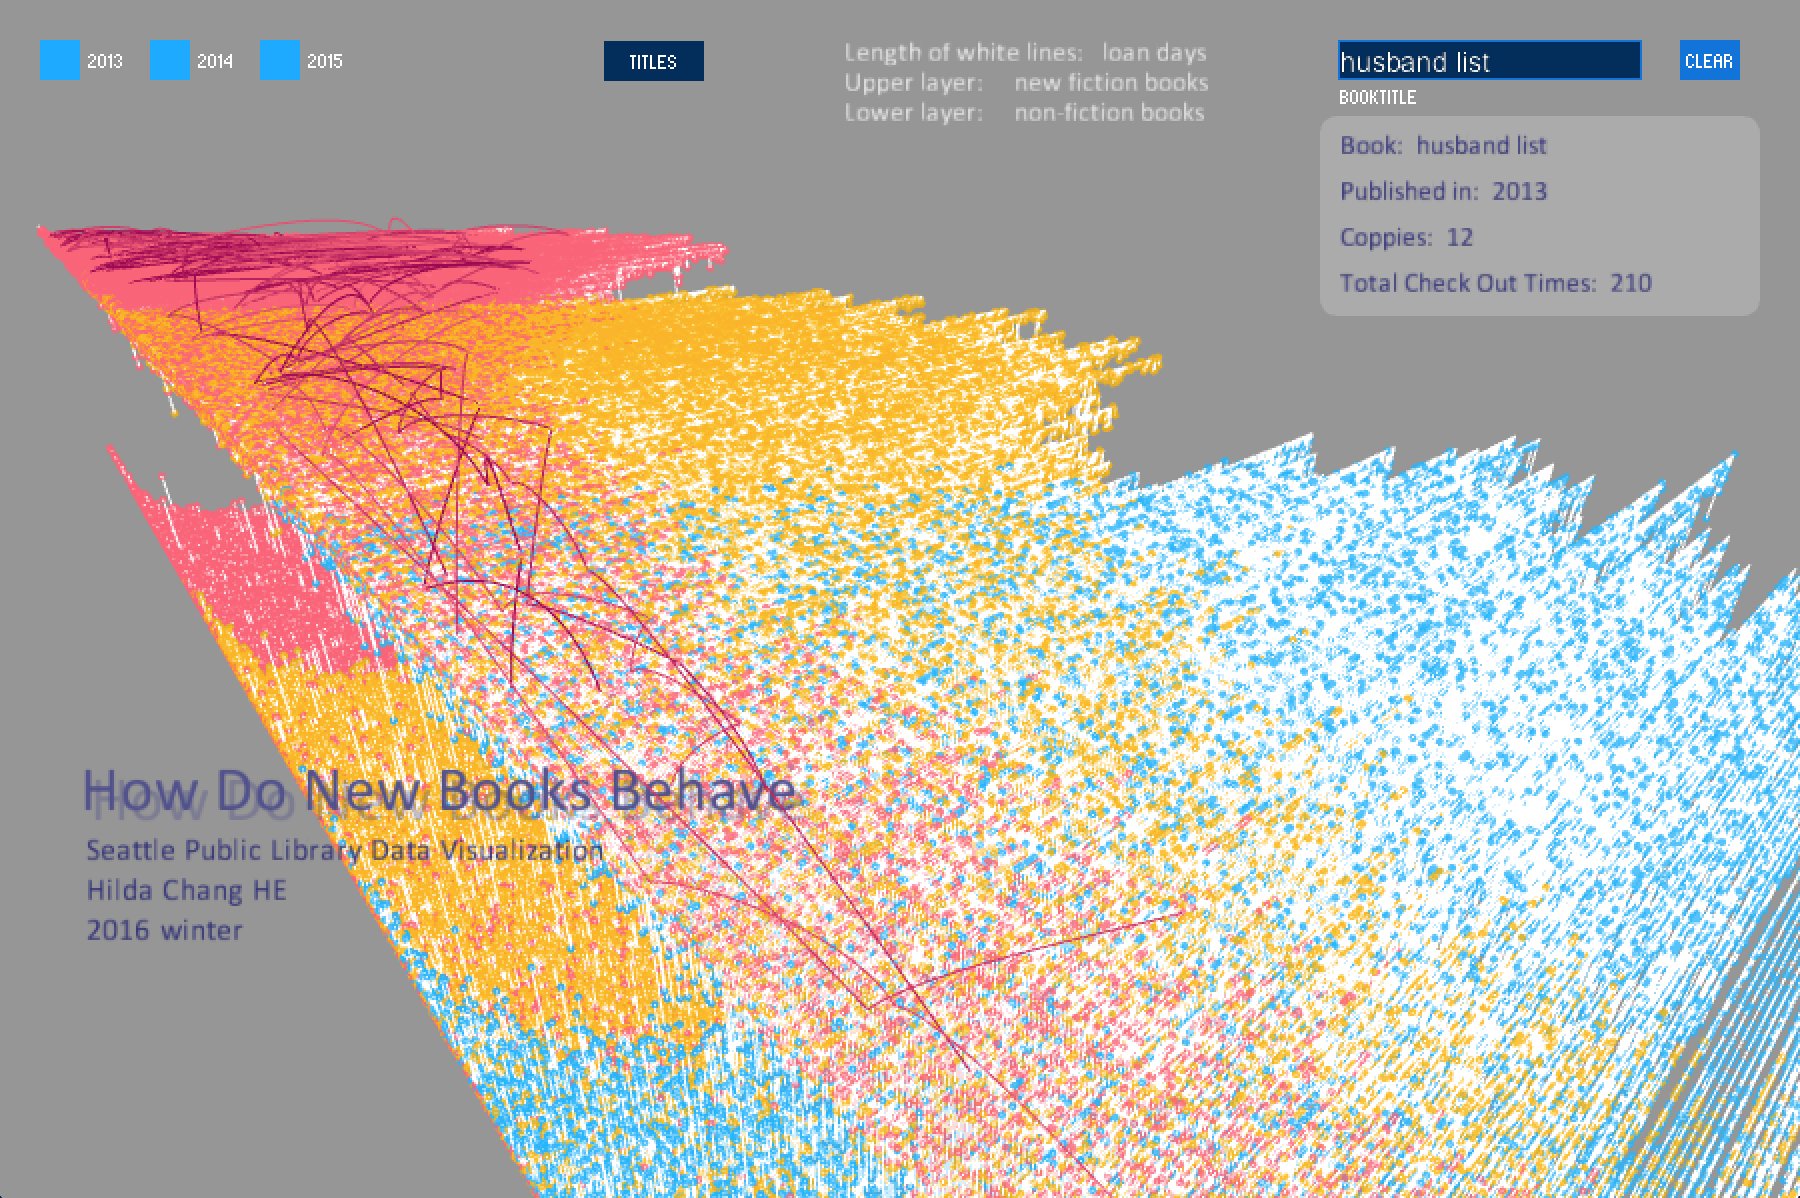
So, I added a searching function in my project. User can type in the book title, and the system returns all the corresponding records. User can see how this book was checkOut by different readers after publication based on the curves shown above the basic shape. Additionally, related information about this book will also be shown at the top right corner under the searching text field.
After implement the major part, I decided to add another funtion to reveal low-level information inside the data set. Because the data set used by my project is big, which include millions records. So the visualization tends to reveal high-level information, which is more general. User can see clearly about patterns and trends. However, I want the program also be able to show detailed information about individual books, which means the visualization can zoom out from "overview" to zoom in at "insite".
So, I added a searching function in my project. User can type in the book title, and the system returns all the corresponding records. User can see how this book was checkOut by different readers after publication based on the curves shown above the basic shape. Additionally, related information about this book will also be shown at the top right corner under the searching text field.
Final result
Every check-out records are presented by a white line with a color point at its end. It's length is determined by loan duration in days. Position is affected by its checkout time. X axis is based on time dimension. Y coordinate is defined by the book type. Fiction books are placed at top, non-fiction books are at bottom. Z axis is determined by checkout sequence in that day.
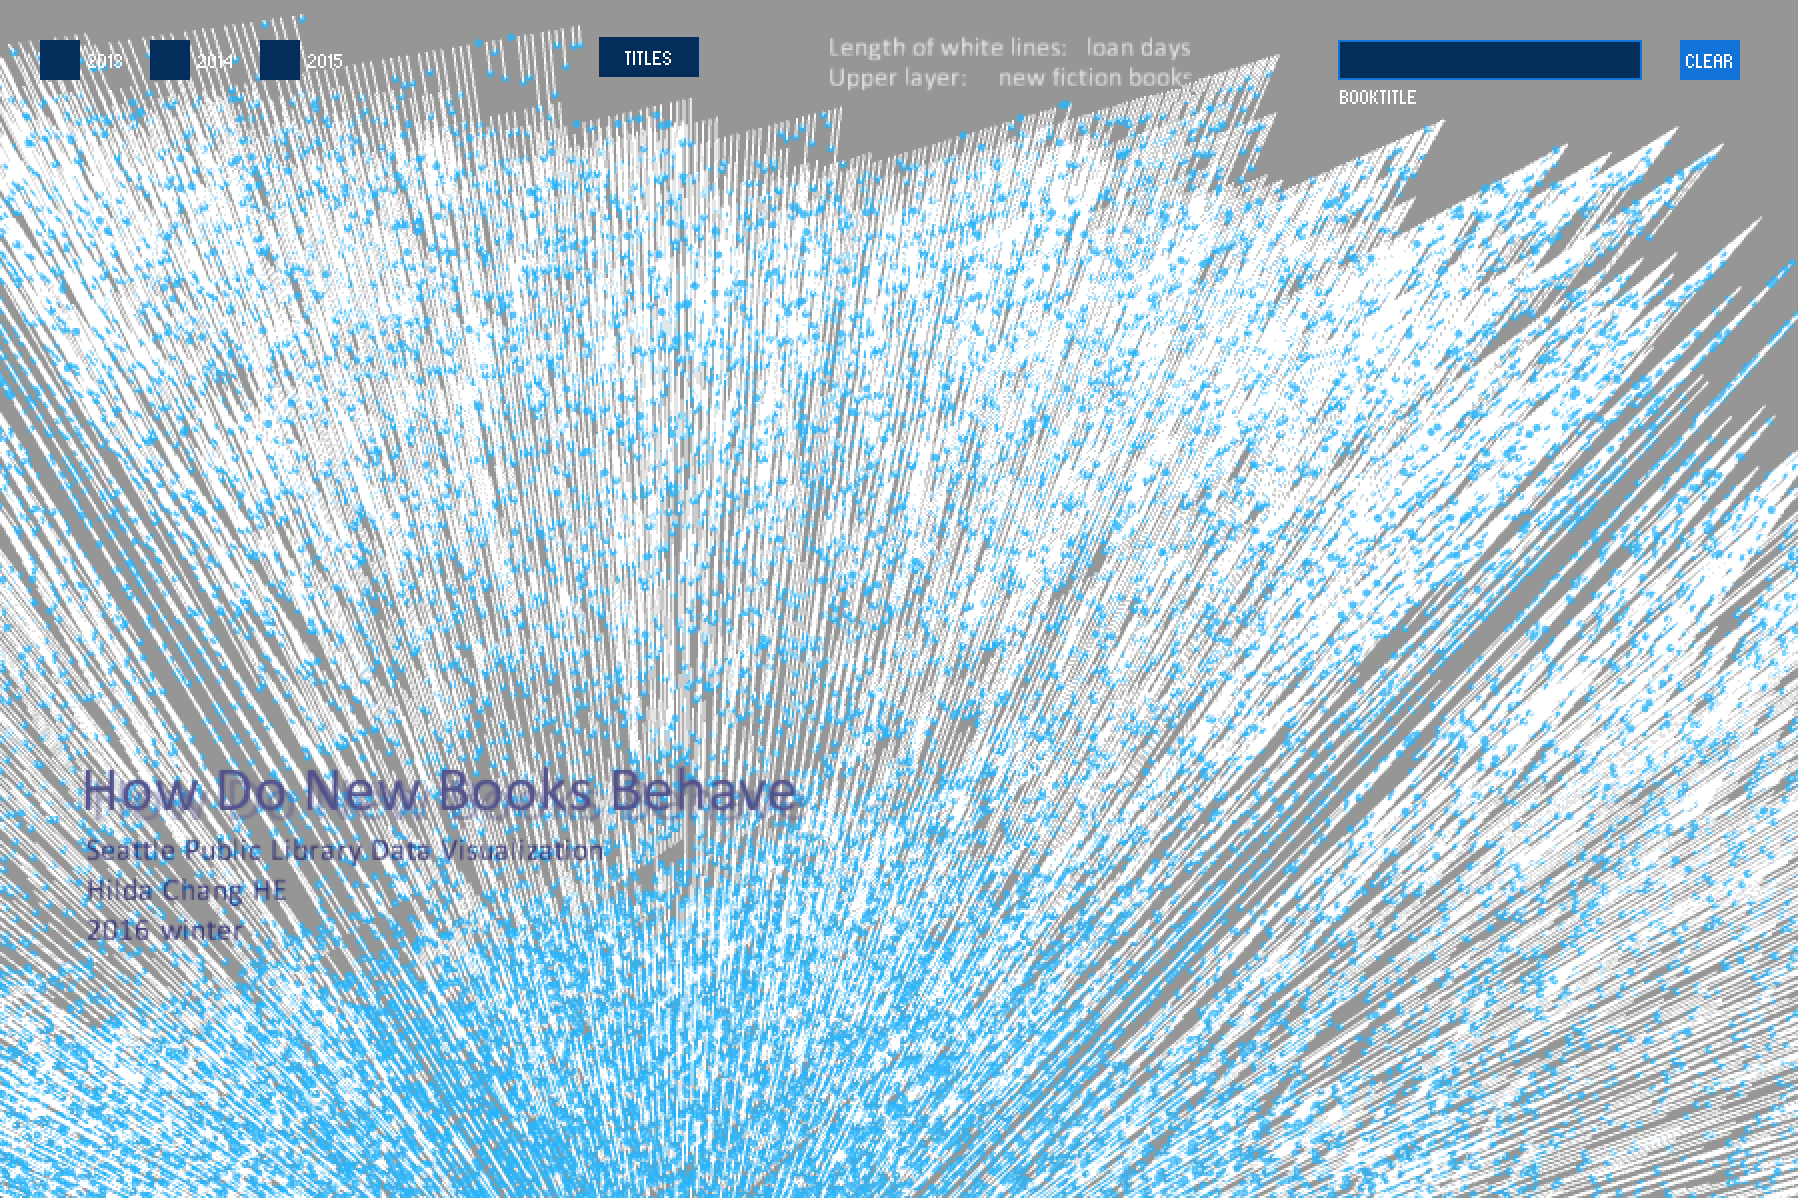
One of my inspiration of this project is OLAP cube where user can switch to different dimensions to see data in different perspective without changing data set in order to discover more valuable information. I also want my visualzation to be able to do this. So I added 3 standard views to look at my data shape. By taping 0, 1 and 2, user can see my project from 3 interesting angle: x-y(top view), x-z(side view) and detailed 3-D (x-y-z). From x-y perspective, user can see new book's population pattern after publishing. X-z can show the general loan duration information. Normal 3-D allows user to zoom into the shape of single data.
Interactions:
User can interact with my program by many ways:
1. You can use mouse and keyboard to change perspectives to see clearly at the shapes.
Available keys: 0, 1, 2, UP, DOWN, LEFT and RIGHT and your mouse.
2. You can click on the button on the top left corner to show different books based on their publication year.
Available choice: 2013, 2014 and 2015. (You can turn them on or off)
3. You can also click on the title to show and hide the subjects on the left bottom hand side.
4. The best, you can type in book name to search for specific book you want. After hit ENTER key, you will see information about this books, such as how many copies, total checkouts. And how this book has been check out by different users after its publication will be shown by curves above the white lines.
Code