Visualizing Seattle Public Library's Book Adoption and Popularity
MAT 259, 2016
Thomas Hervey
Concept
Unique and real-time datasets often brings new perspectives about both external and internal phenomena.
Our course's access to checkout data since 2006 for the Seattle Public library is both an opportunity
to explore library patron's activity as well as the internal structure and happenings at one of the
worlds most progressive libraries. This project attempts to examine the intersection of these 'frontend'
and 'backend' phenomena by exploring the relationships between a book's adoption, popularity and time.
Many would suggest that the growth of the World Wide Web has dramatically driven th user adoption of
e-media and even possibly slowed the adoption of physical media, such as library book checkouts. But is
this true? Are checkouts less since the public's online use has grown? Is this the same for all genres?
To evaluate this, I pose the following questions:
- Does a title's age affect its checkout frequency (ie. same book in 2006 v 2015)
- Do checkout frequencies increase with new media? (ie. 2006 release v 2015 release)
- Has there been an increase in young adult interest? (ie. 'youth fantasy hype)
Query
After a series of reevaluations followed by question changes, I am able to generate my SQL query pulls.
In addition, in order to gather pertinent publication information, I query data from table generated
from a web scrape, and then built an Amazon API call by providing ISBN numbers. The following links are
to the SQL queries and PHP program that I used to generate my final dataset before visualization.
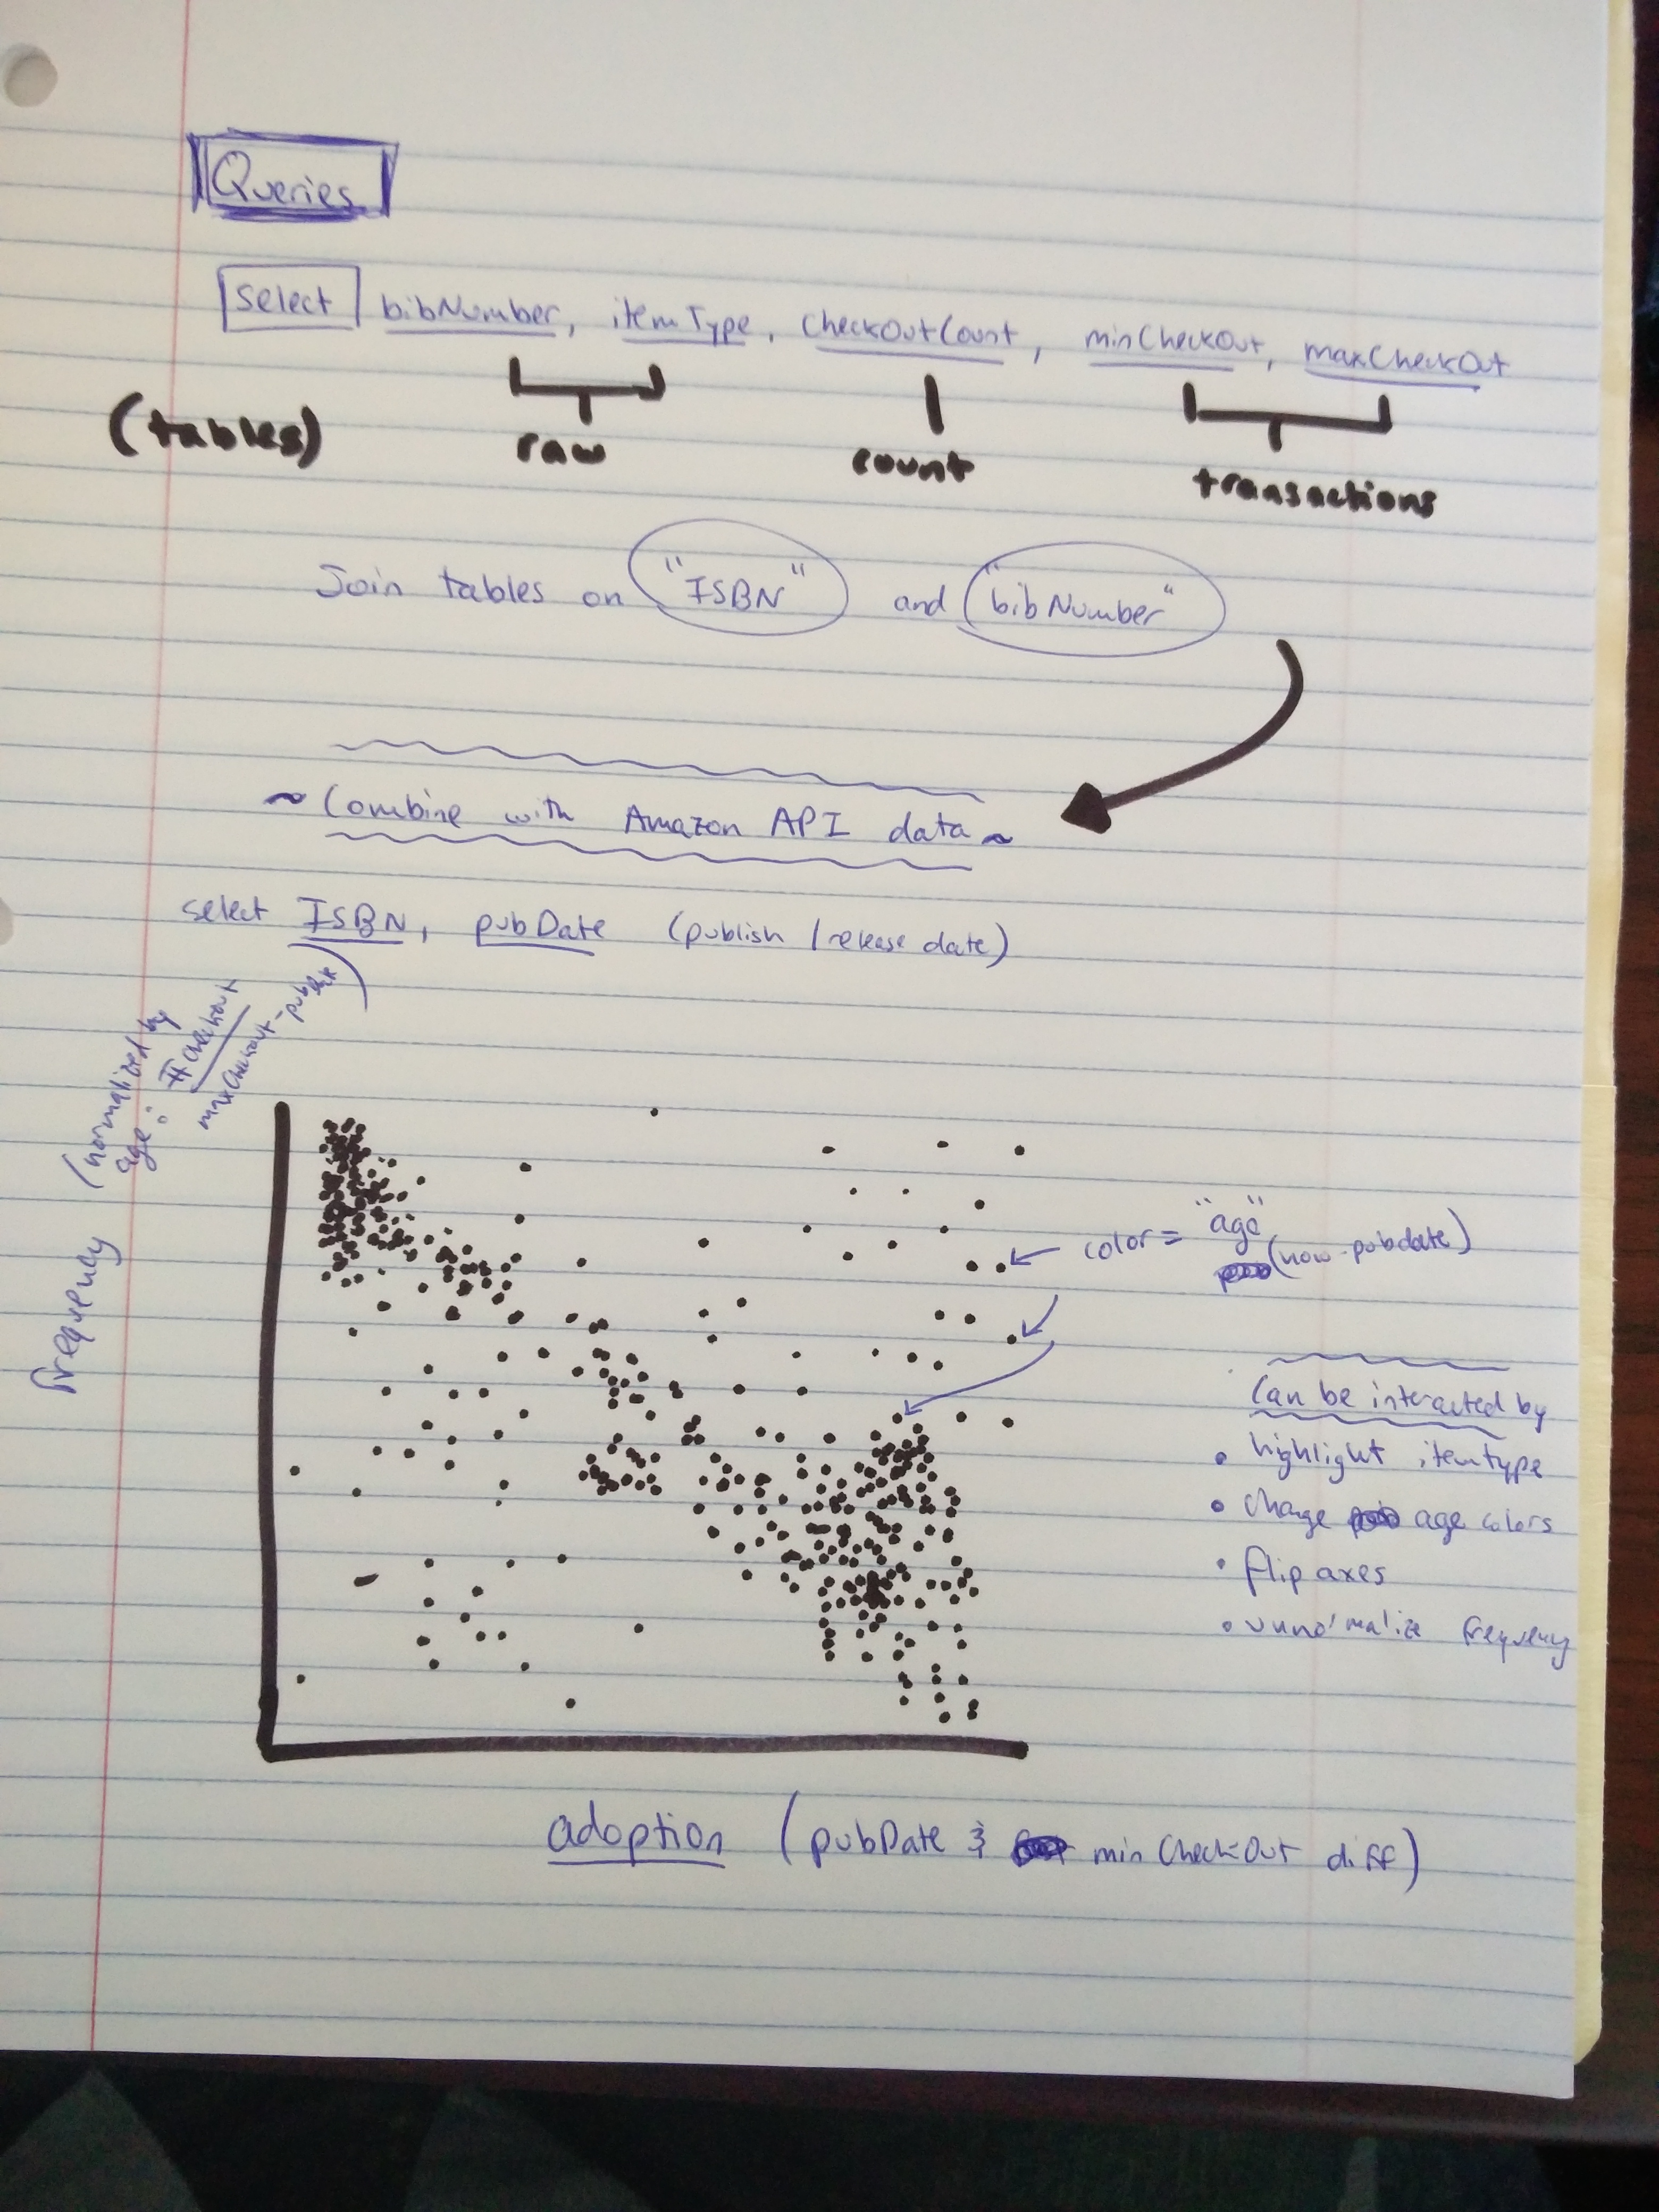
Preliminary sketches
To investigate my data, I begin with several sketches investigating the trends that I expect as well aside
as well as pair these trends with a strong visualization. Originating as an interactive scatter-plot, a user
is able to explore the data on their own while making minute changes to the axis normalizations and color
scheme.
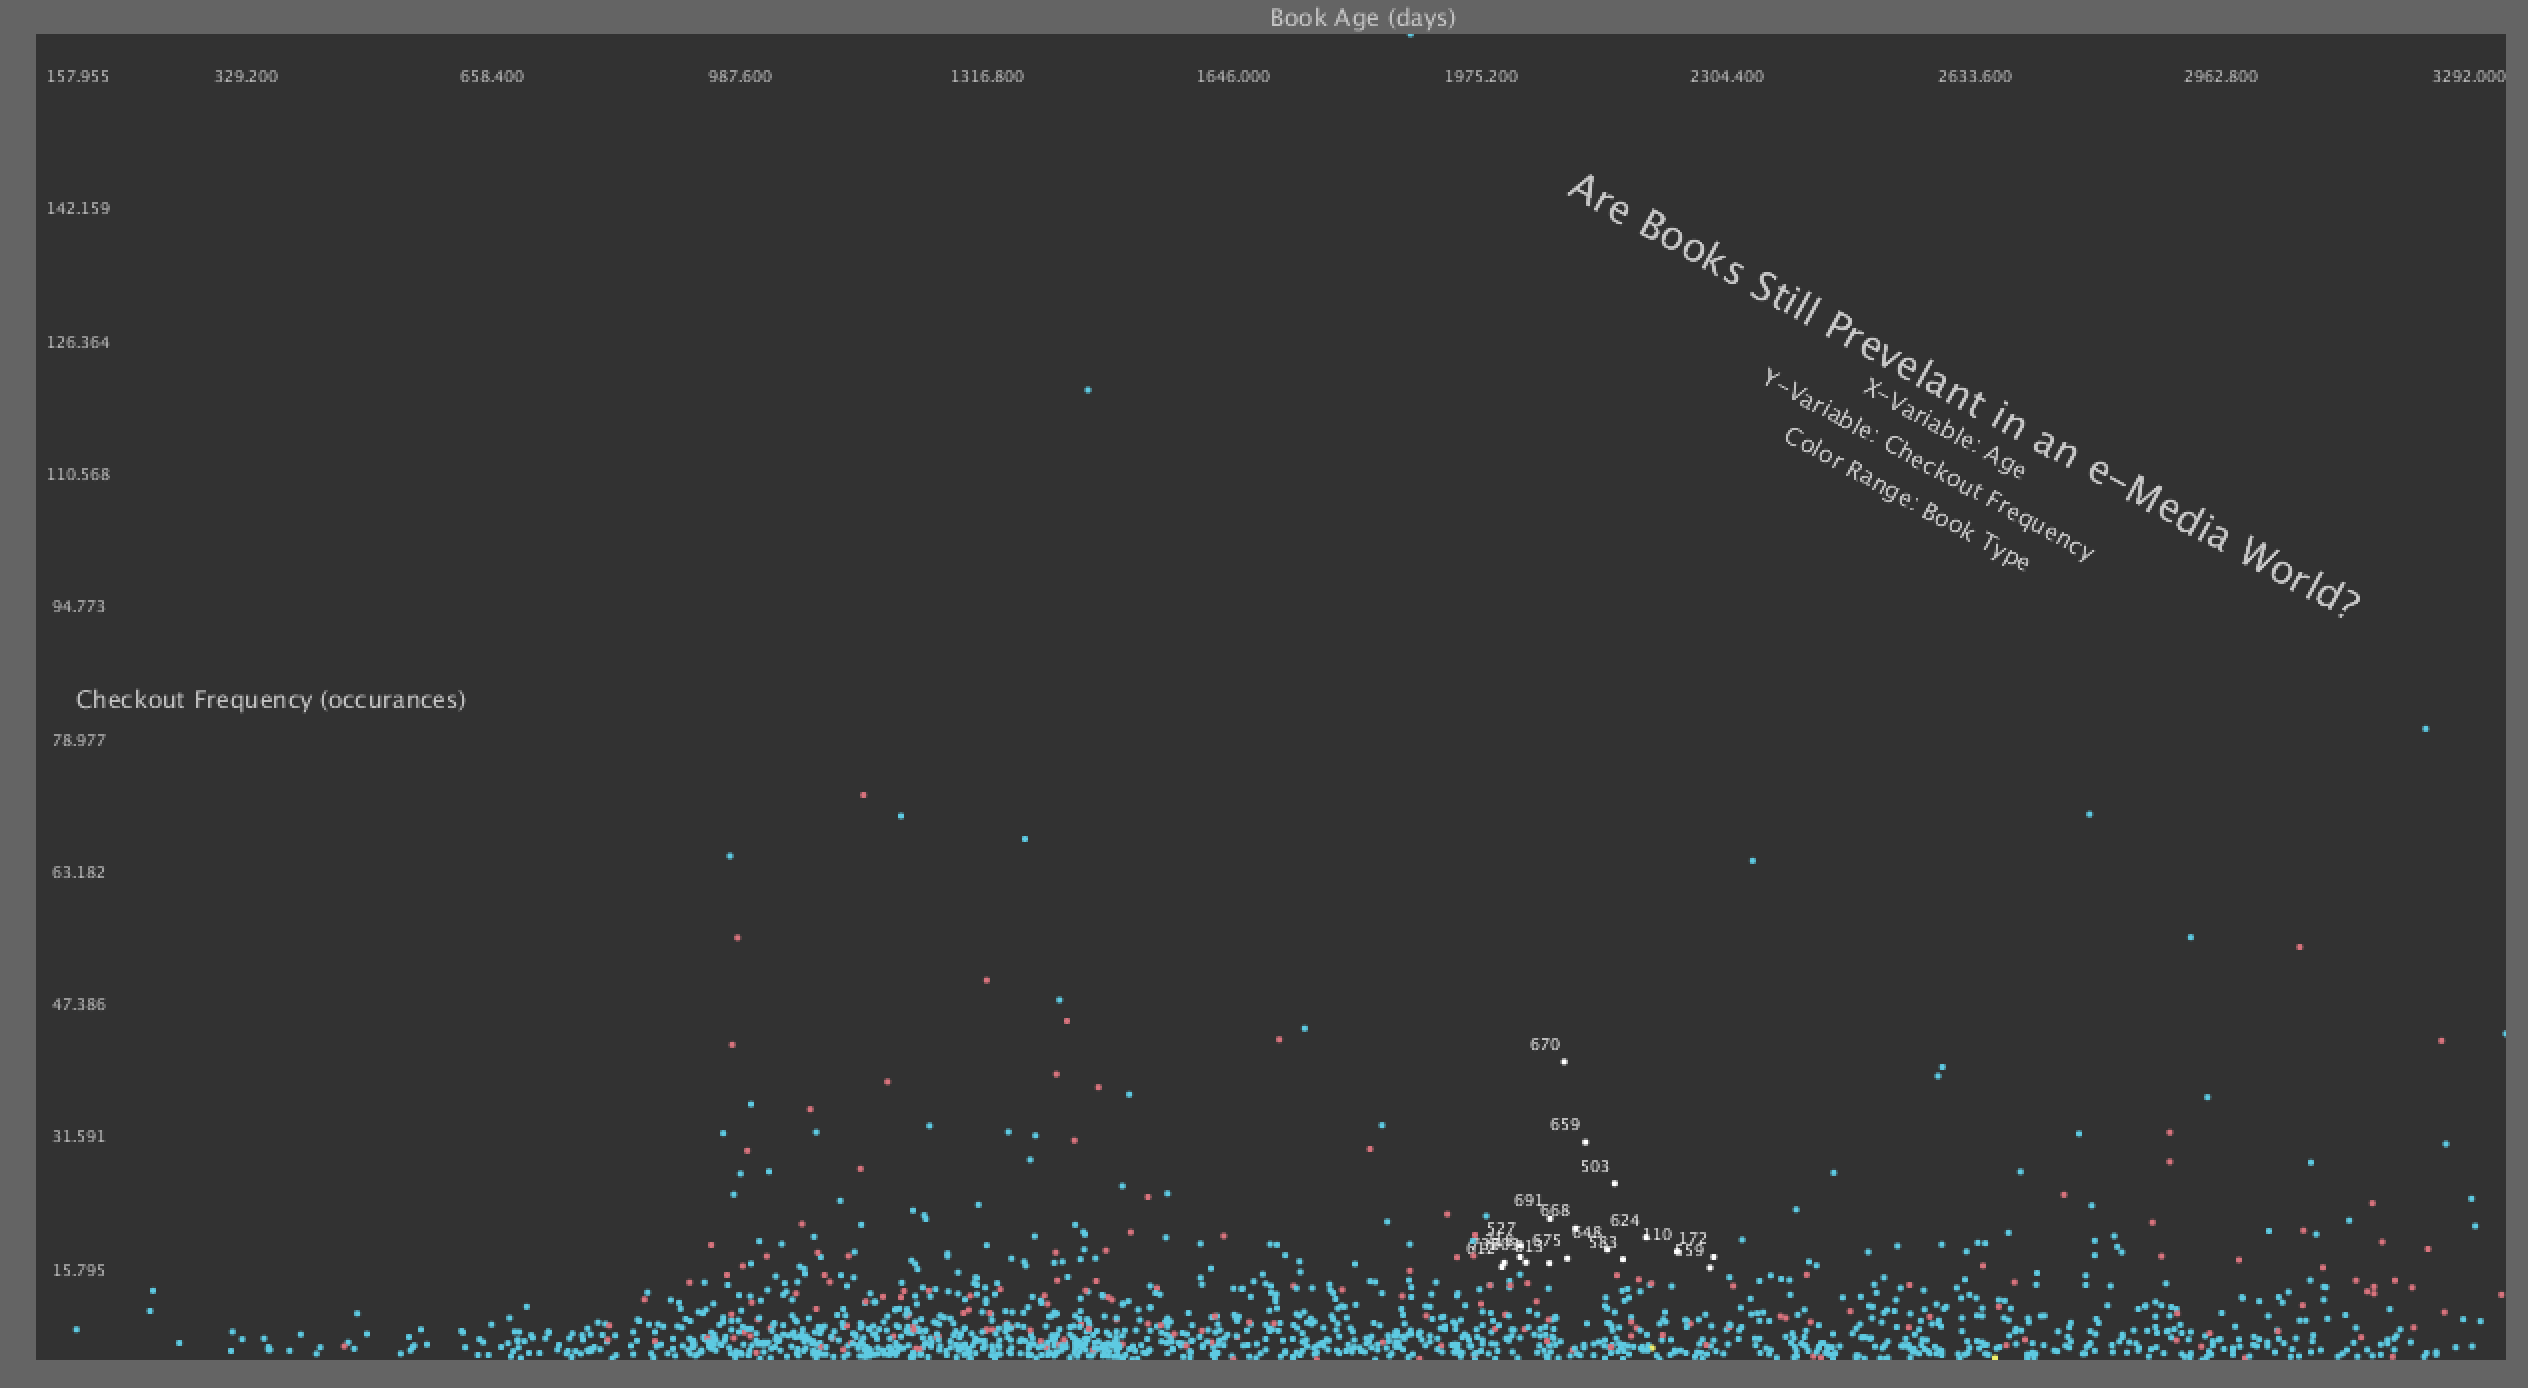
Process
Initially, my data didn't look like what I had expected. Thinking that the publication date would have had
a larger influence on total checkout count, I determined that this needs to be invesitgated further as well
as include the relationship to adoption. This work in progress had limited interaction, but allows for
hovring which reveals further information about the data point (such as title and important dates).
The results are 1607 records that I was able to obtain full details including the much needed publication date.
All of these records were published in 2006 or later, were books, and had at least some checkouts over the 10
year span.
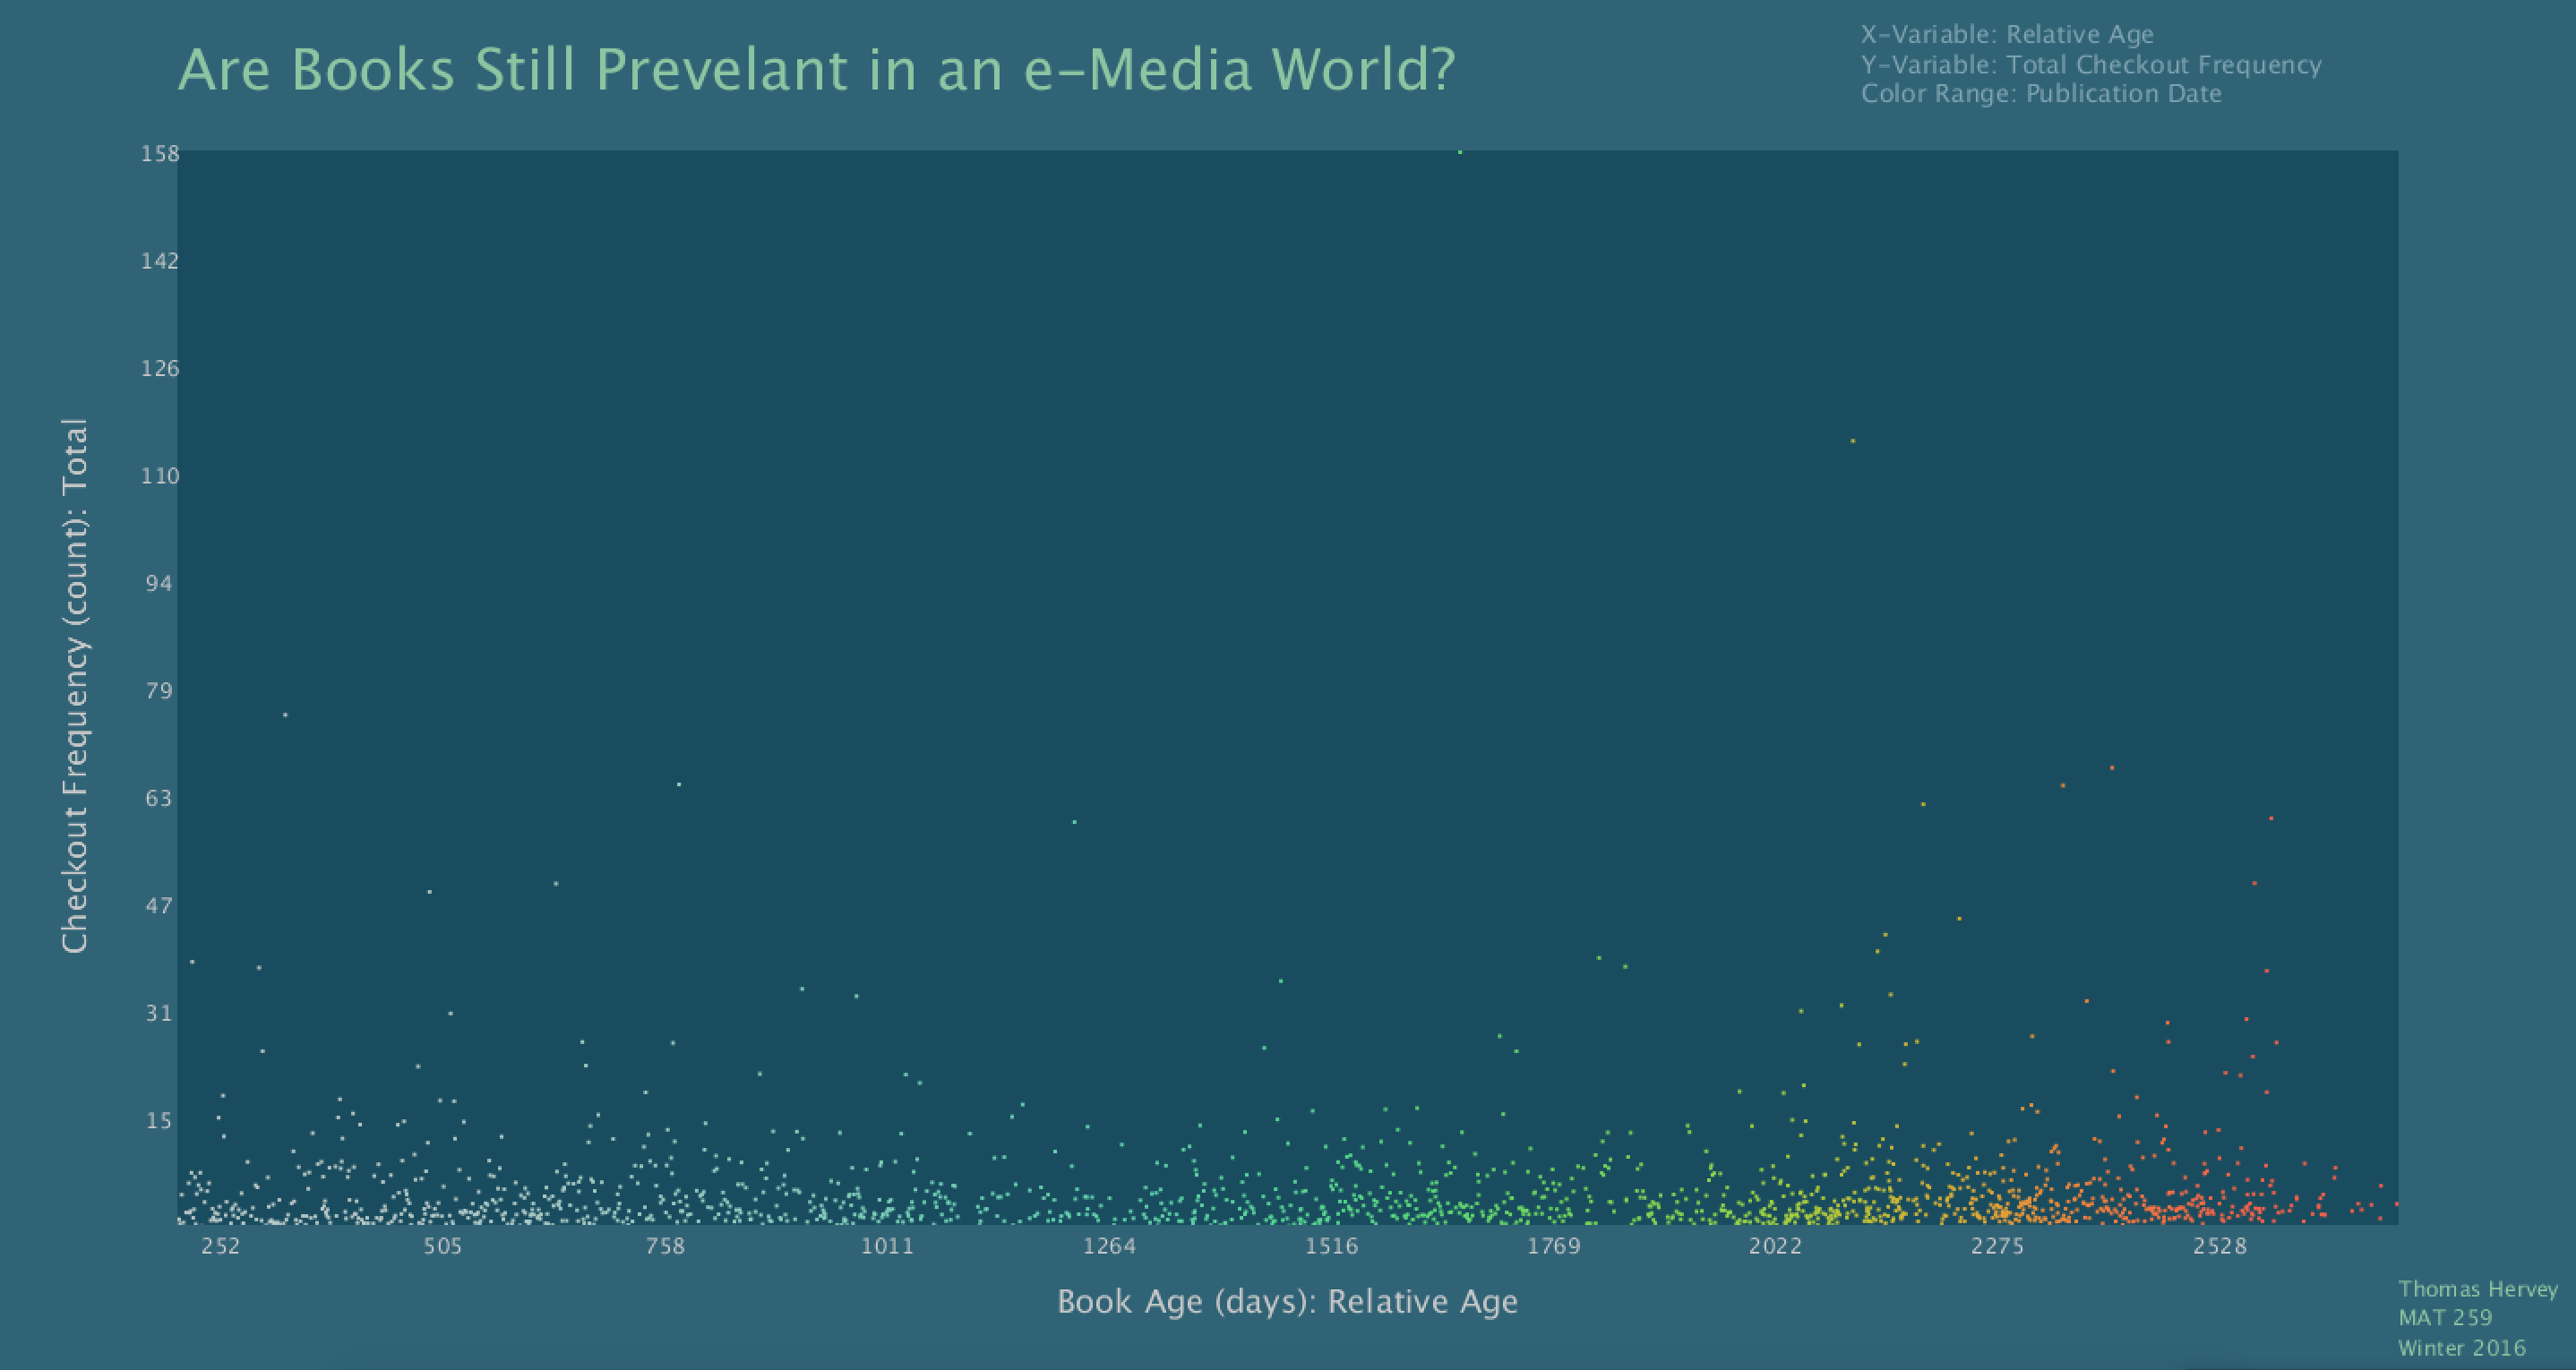
Final result
The final result uses stronger colors and more meaningful interactions. In addition to more display features
for highlighted elements, a user can toggle between axis representations, showing the transition of each
data point. This result led to me once again adjust my questions and find further ways to explore the internal
structure of the Seattle Public Library's data. To see the next steps including a 3D visualization that leverages
statistics, please see my second project and third project.
Code