Do people in Seattle read generic or specialized books? Can labeling be used to increase the checkout rate for items?
Introducing a dynamic comparative tool for labeling analysis
MAT 259, 2016
May ElSherif
Concept
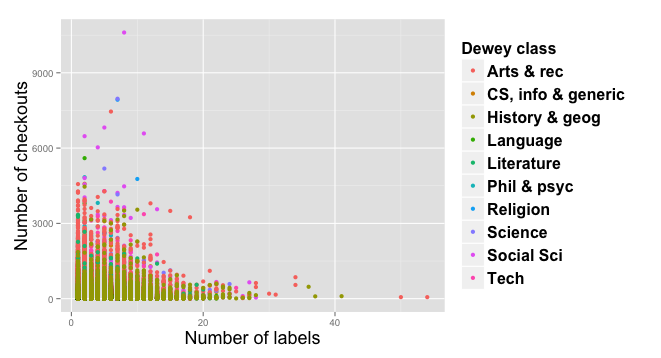
Initial question: For non-fictional items, is there a correlation between the number of subject entries (labels/tags) that describe an item in the Seattle Public Library and the number of checkouts? Does it differ across different Dewey classes?
Labeling and tagging items with keywords are important aspects in data organization. It is used to create search indexes that help users, especially on the web retrieve the information they need.
To tackle the aforementioned question, I began by investigating the deweyClass table, the x_checkOutCountBib, and the subject table. To acquire the data in the needed form to answer the question, a triple join was needed between the previously mentioned tables.
Query
SELECT deweyClass AS Dewey, spl3.deweyClass.bibNumber, checkOutCount, COUNT(spl3.subject.bibNumber) AS SubjectEntriesCount FROM spl3.x_checkOutCountBib, spl3.deweyClass, spl3.subject WHERE deweyClass > 0 AND spl3.x_checkOutCountBib.bibNumber = spl3.deweyClass.bibNumber AND spl3.x_checkOutCountBib.bibNumber = spl3.subject.bibNumber AND (spl3.subject.subject != '' OR spl3.subject.subject IS NOT NULL)
GROUP BY bibNumber
ORDER BY deweyClass;
Preliminary sketches
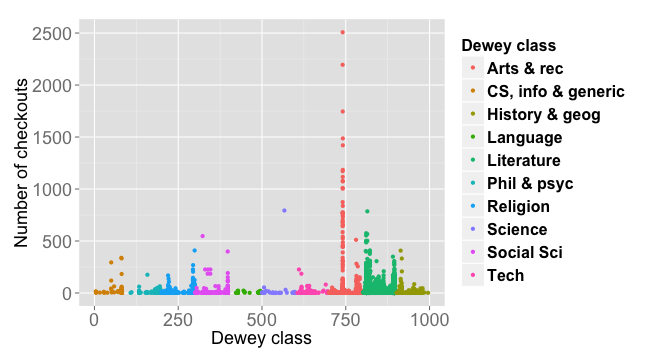
As we can see from the first sketch, there is a trend of a decreasing number of checkouts when the number of labels increases. Although many aspects affect the number of checkouts, this result can be interpreted in the sense that people in the Seattle public library tend to check out very specific books. Since a generic book incorporates multiple topics, the probability of this book having more than one subject entry increases. A specialty book (i.e. a book that focuses on fewer points) has the probability of having fewer labels. The above result suggests that people tend to check specialty books more than generic books. On the other hand, the question still remains: "What about unlabeled items?" (i.e. items without subject entries). If we compare the first sketch and the second sketch, we can see that the rate of checkout for labeled items is on average higher than the rate of checkout for unlabeled items. This indicates that labeling an item could result in higher checkout rates for that item.
Process
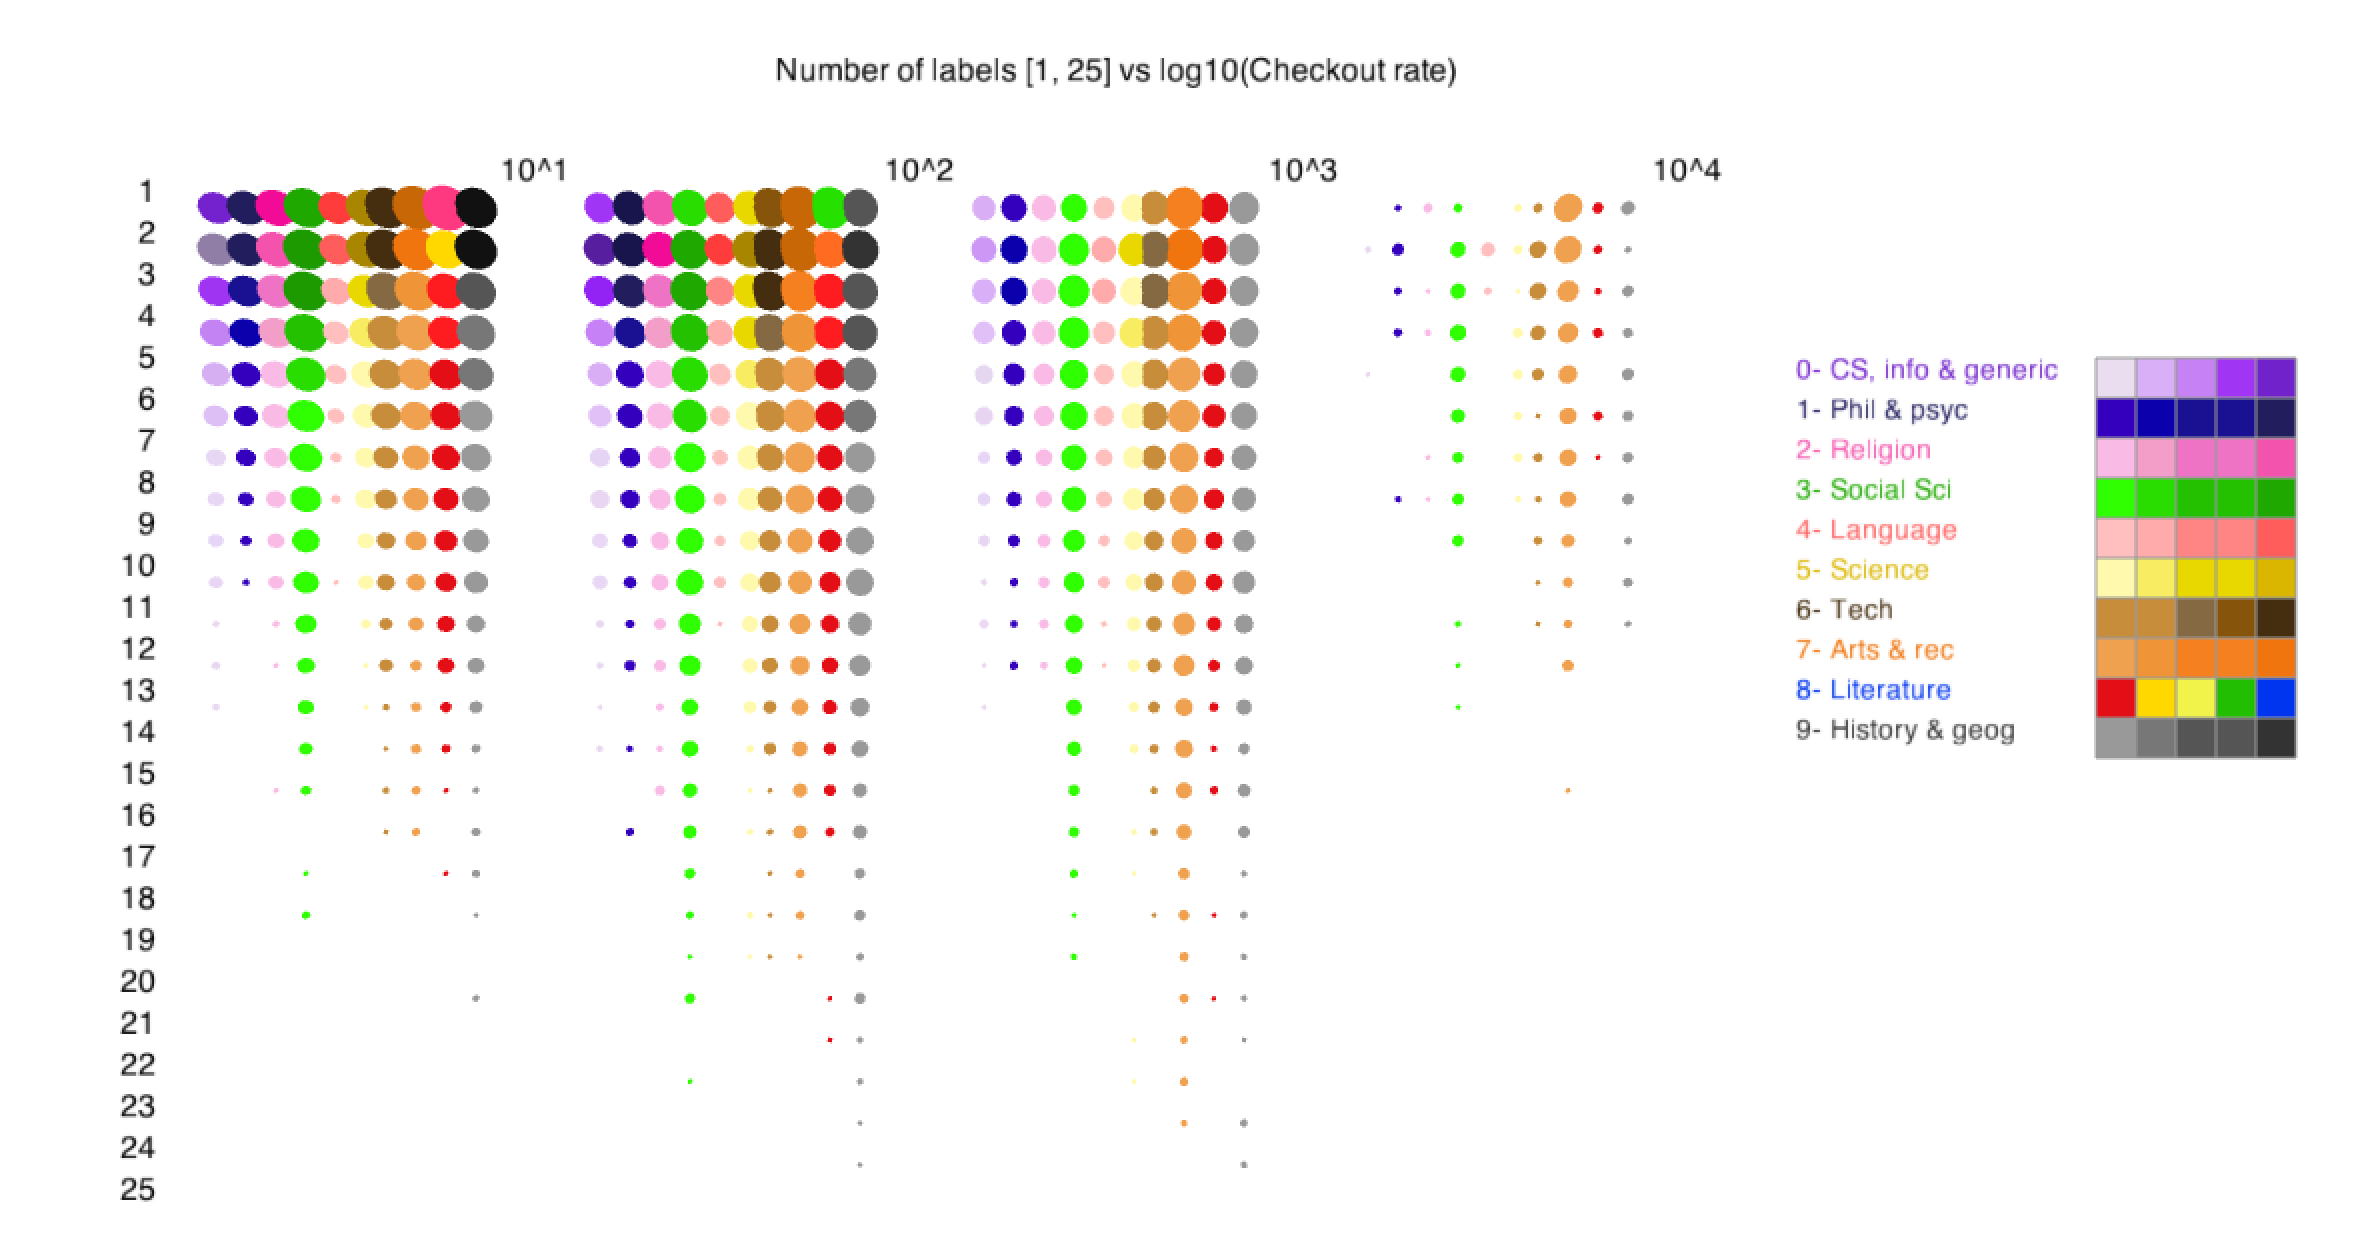
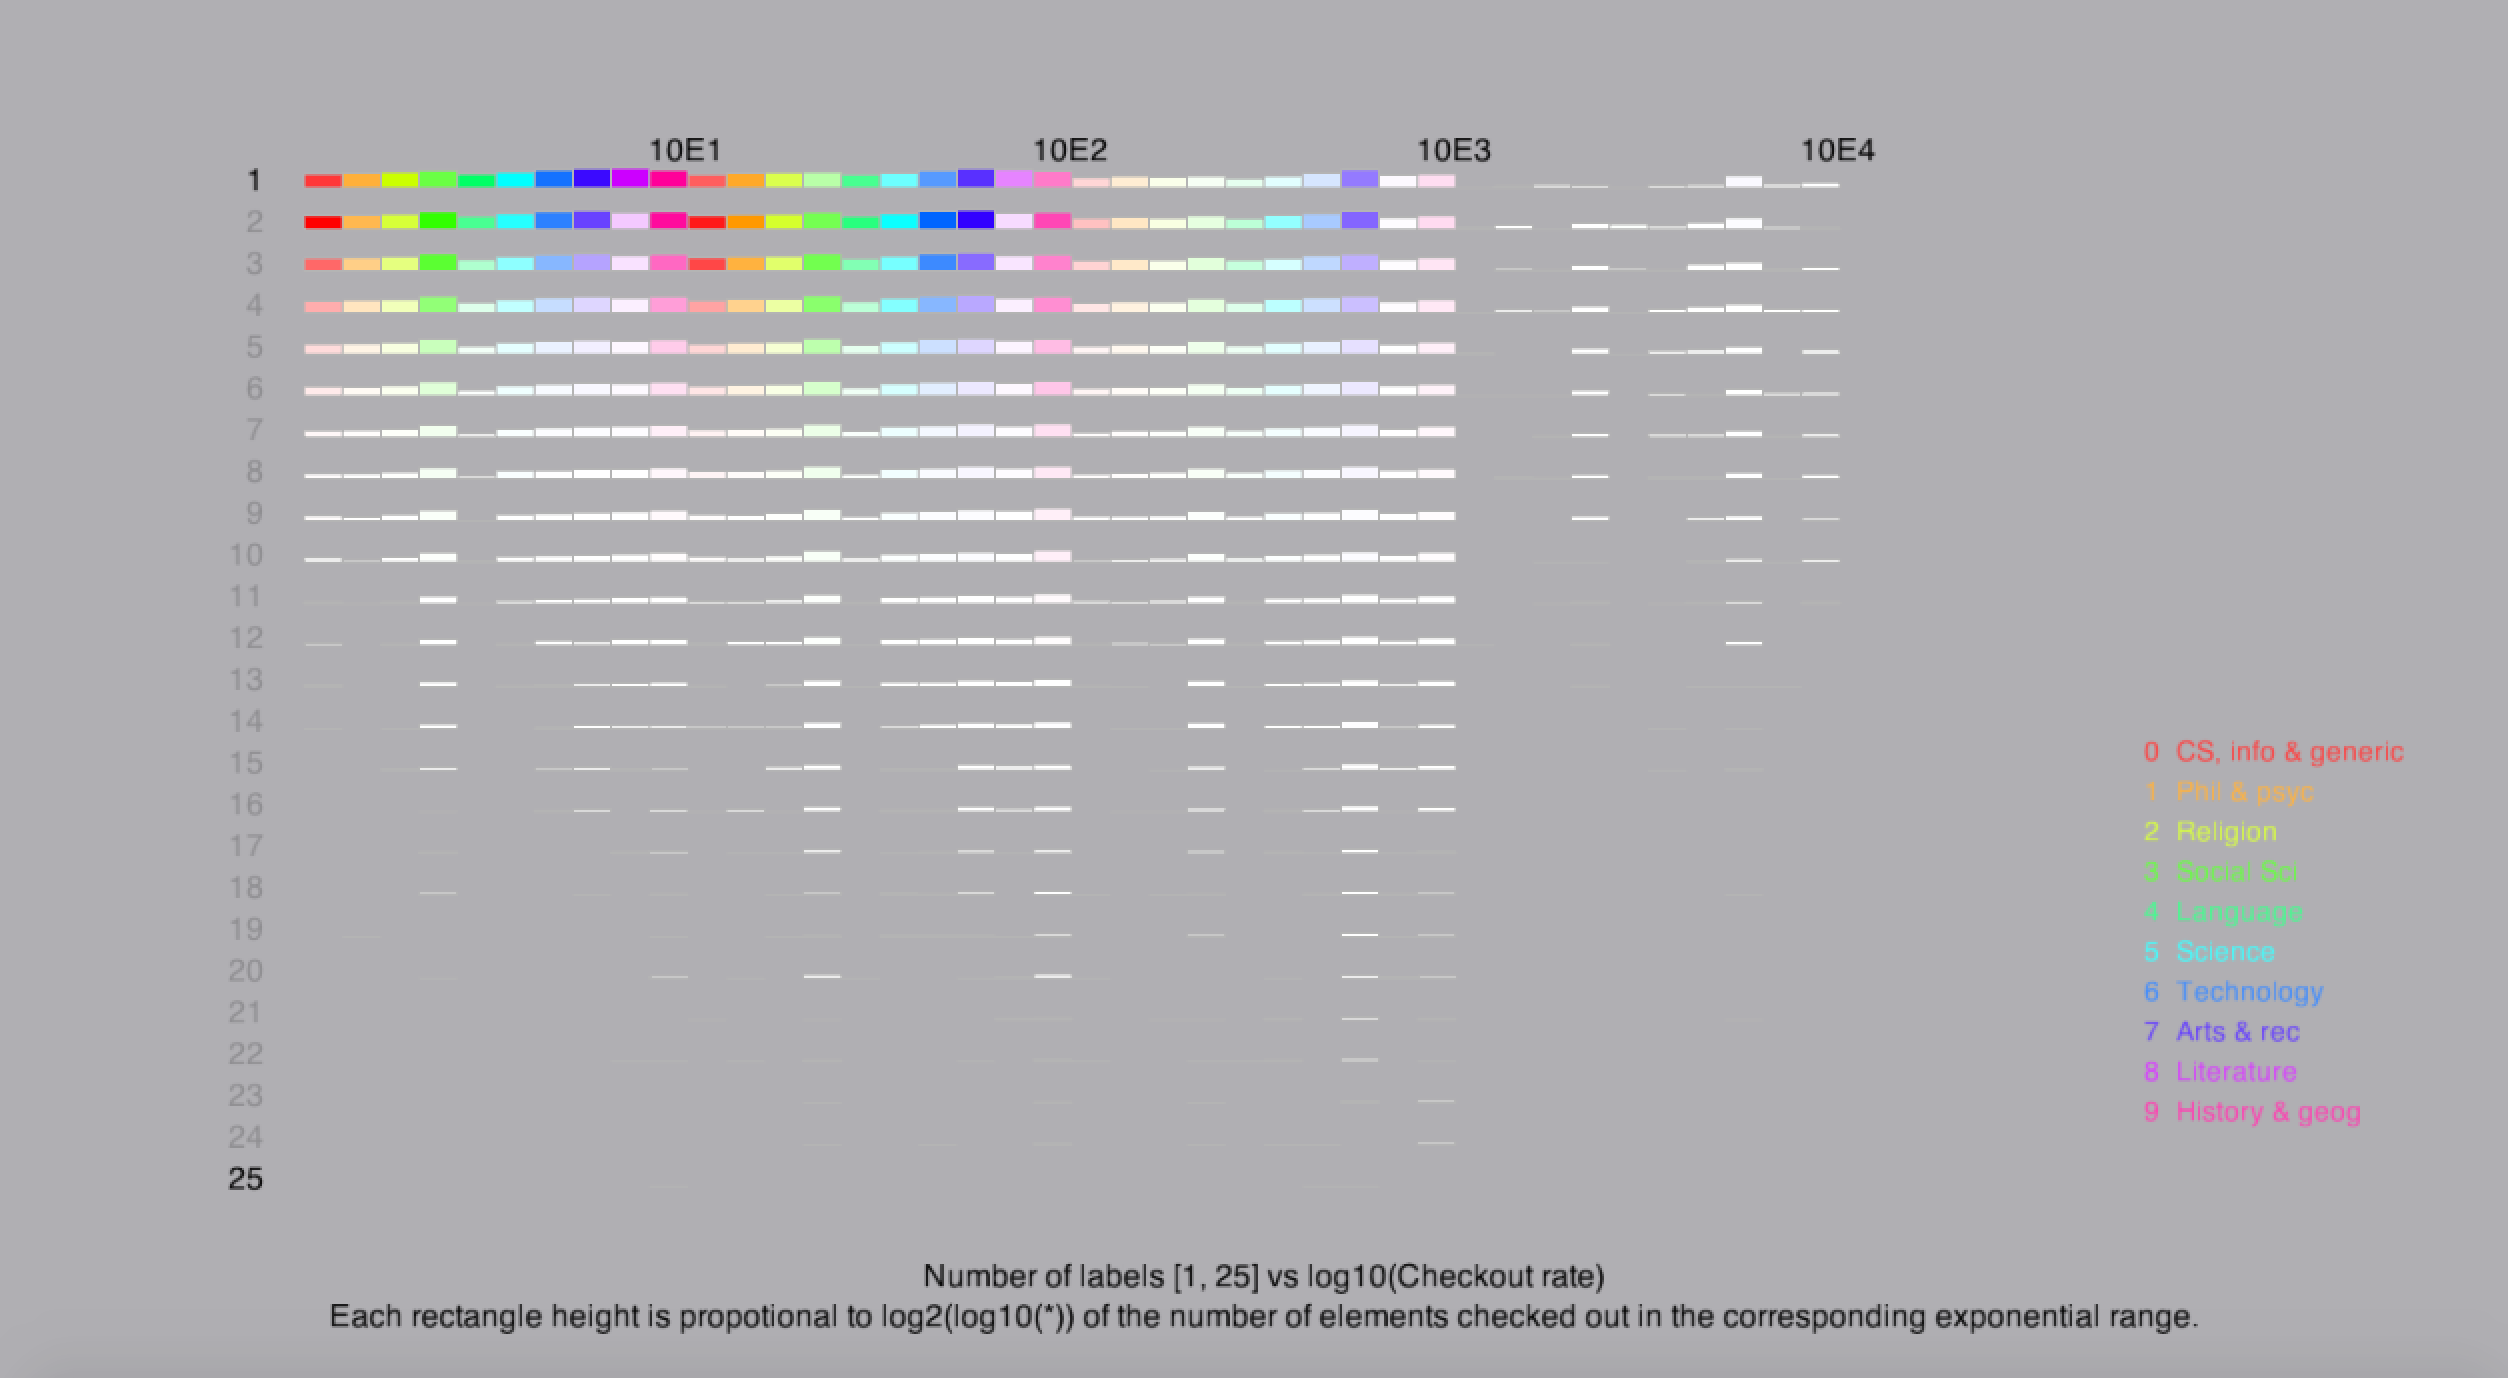
After getting the canvas up and running, you can start comparing different Dewey Classes using different keyboard keys. If you press a, which represents all Dewey Classes, you will see the canvas filled with different spheres each representing the checkout rate per Dewey Class as in the first process sketch. The size of the sphere is proportional to the value of the log to the base 2 of the number of items in the same checkout range. The color is directly correlated with the number of items of the same checkout rate as well. Simply, a big sphere with darker color symbolizes a large number of items in that checkout range and vice versa.
To clear the canvas again, all you have to do is press c (i.e. clear).
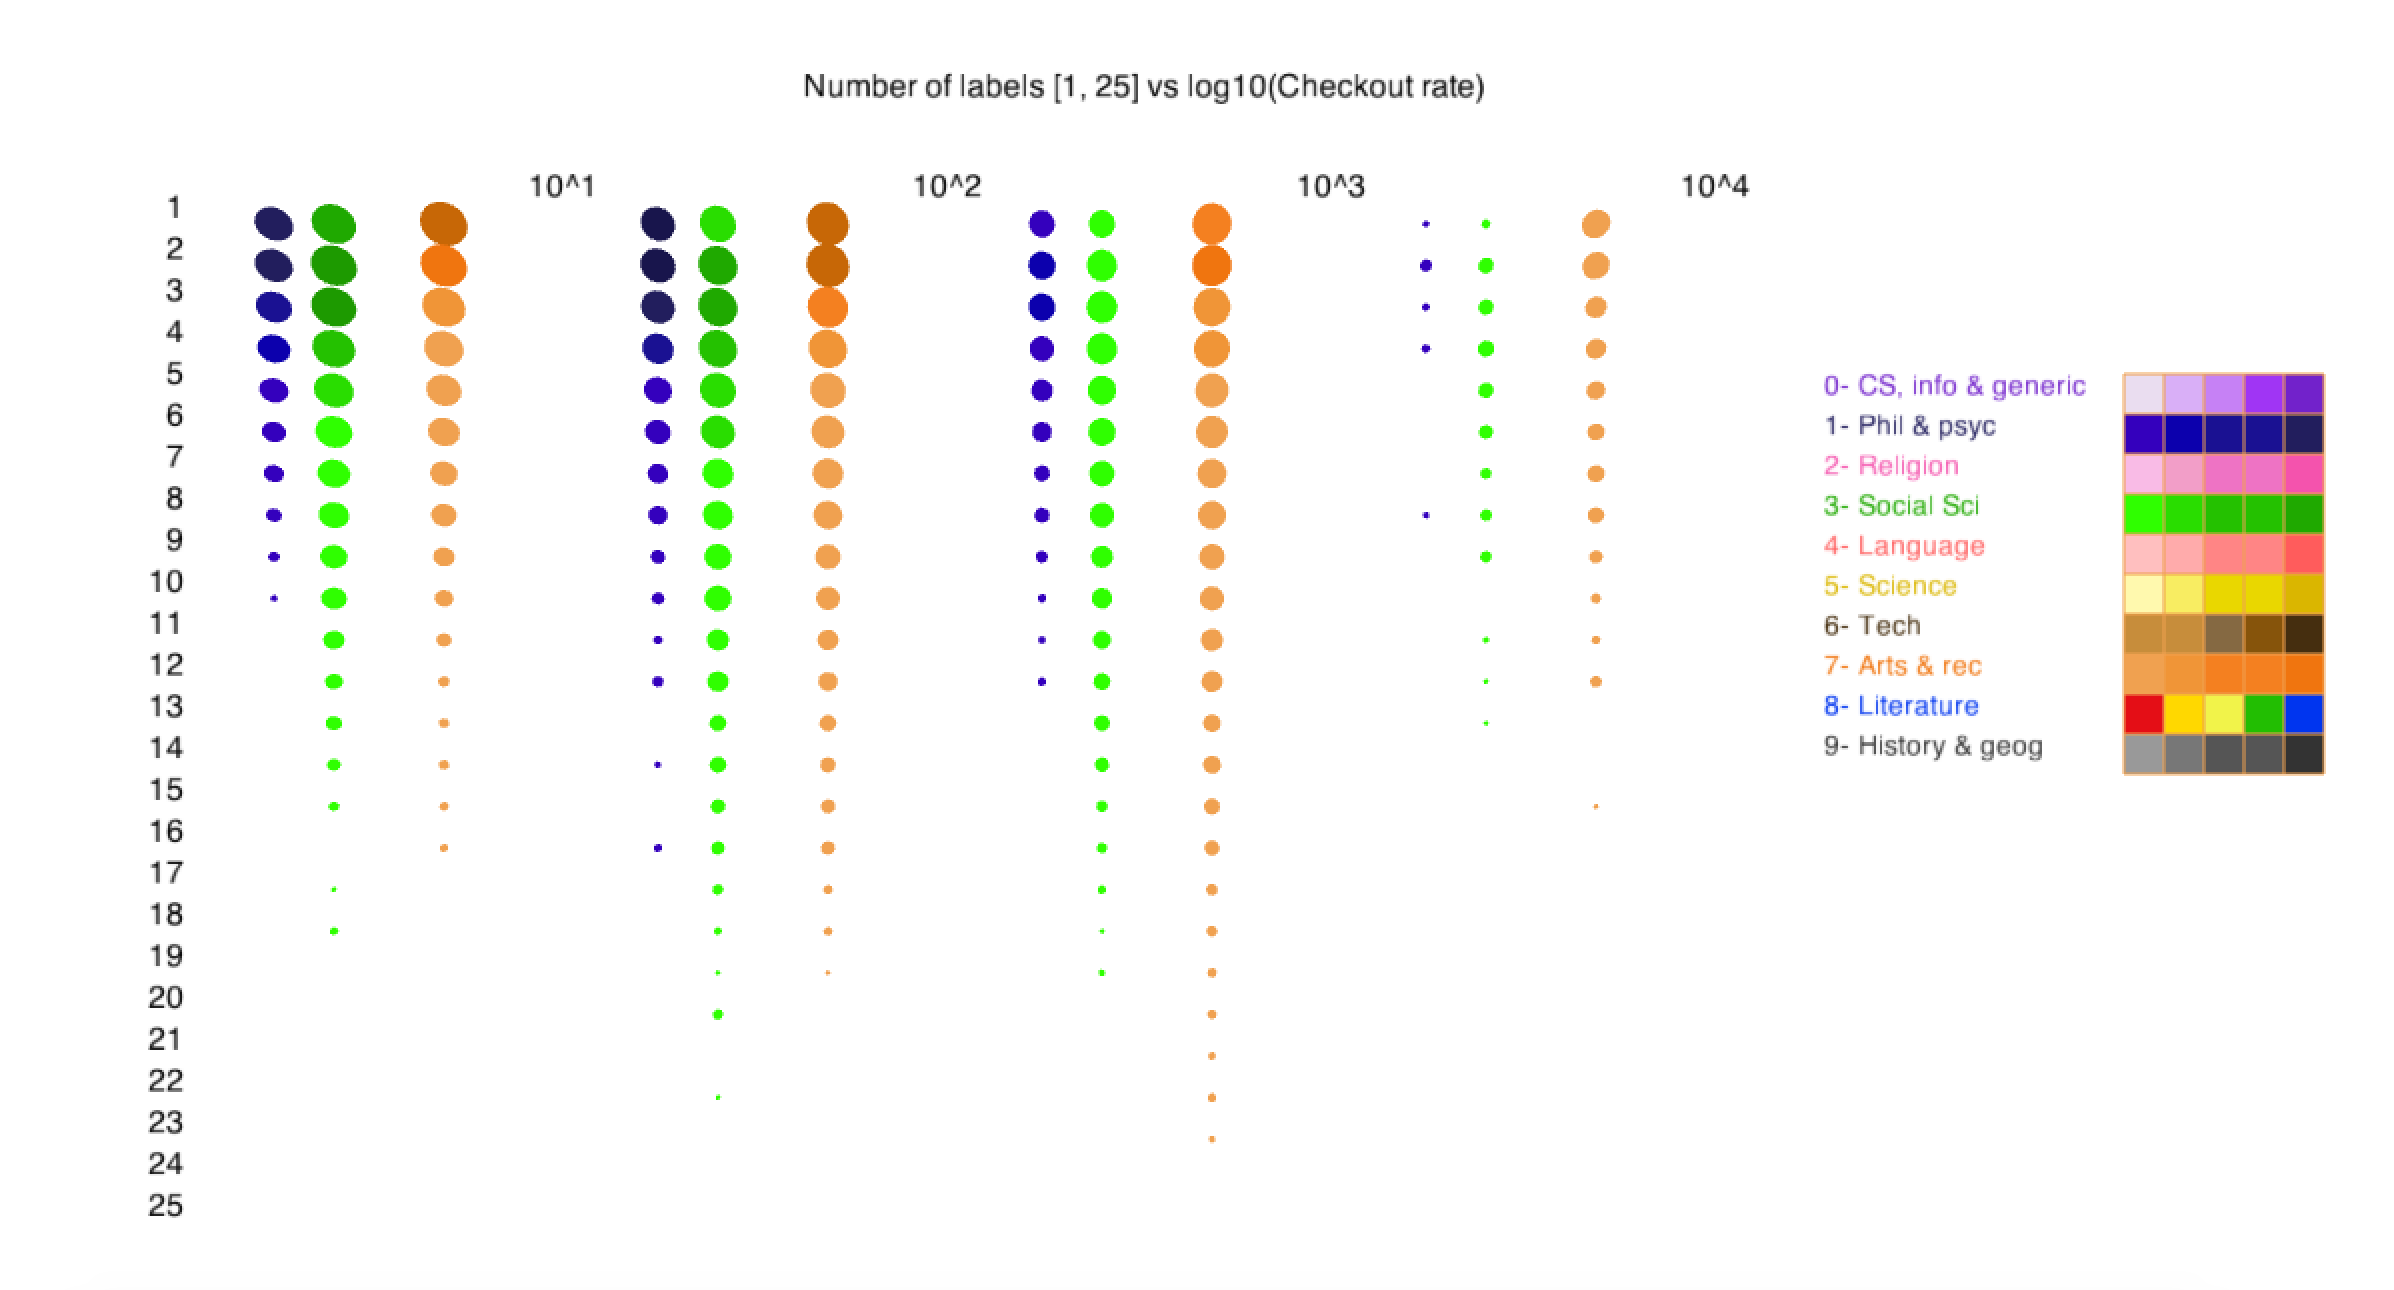
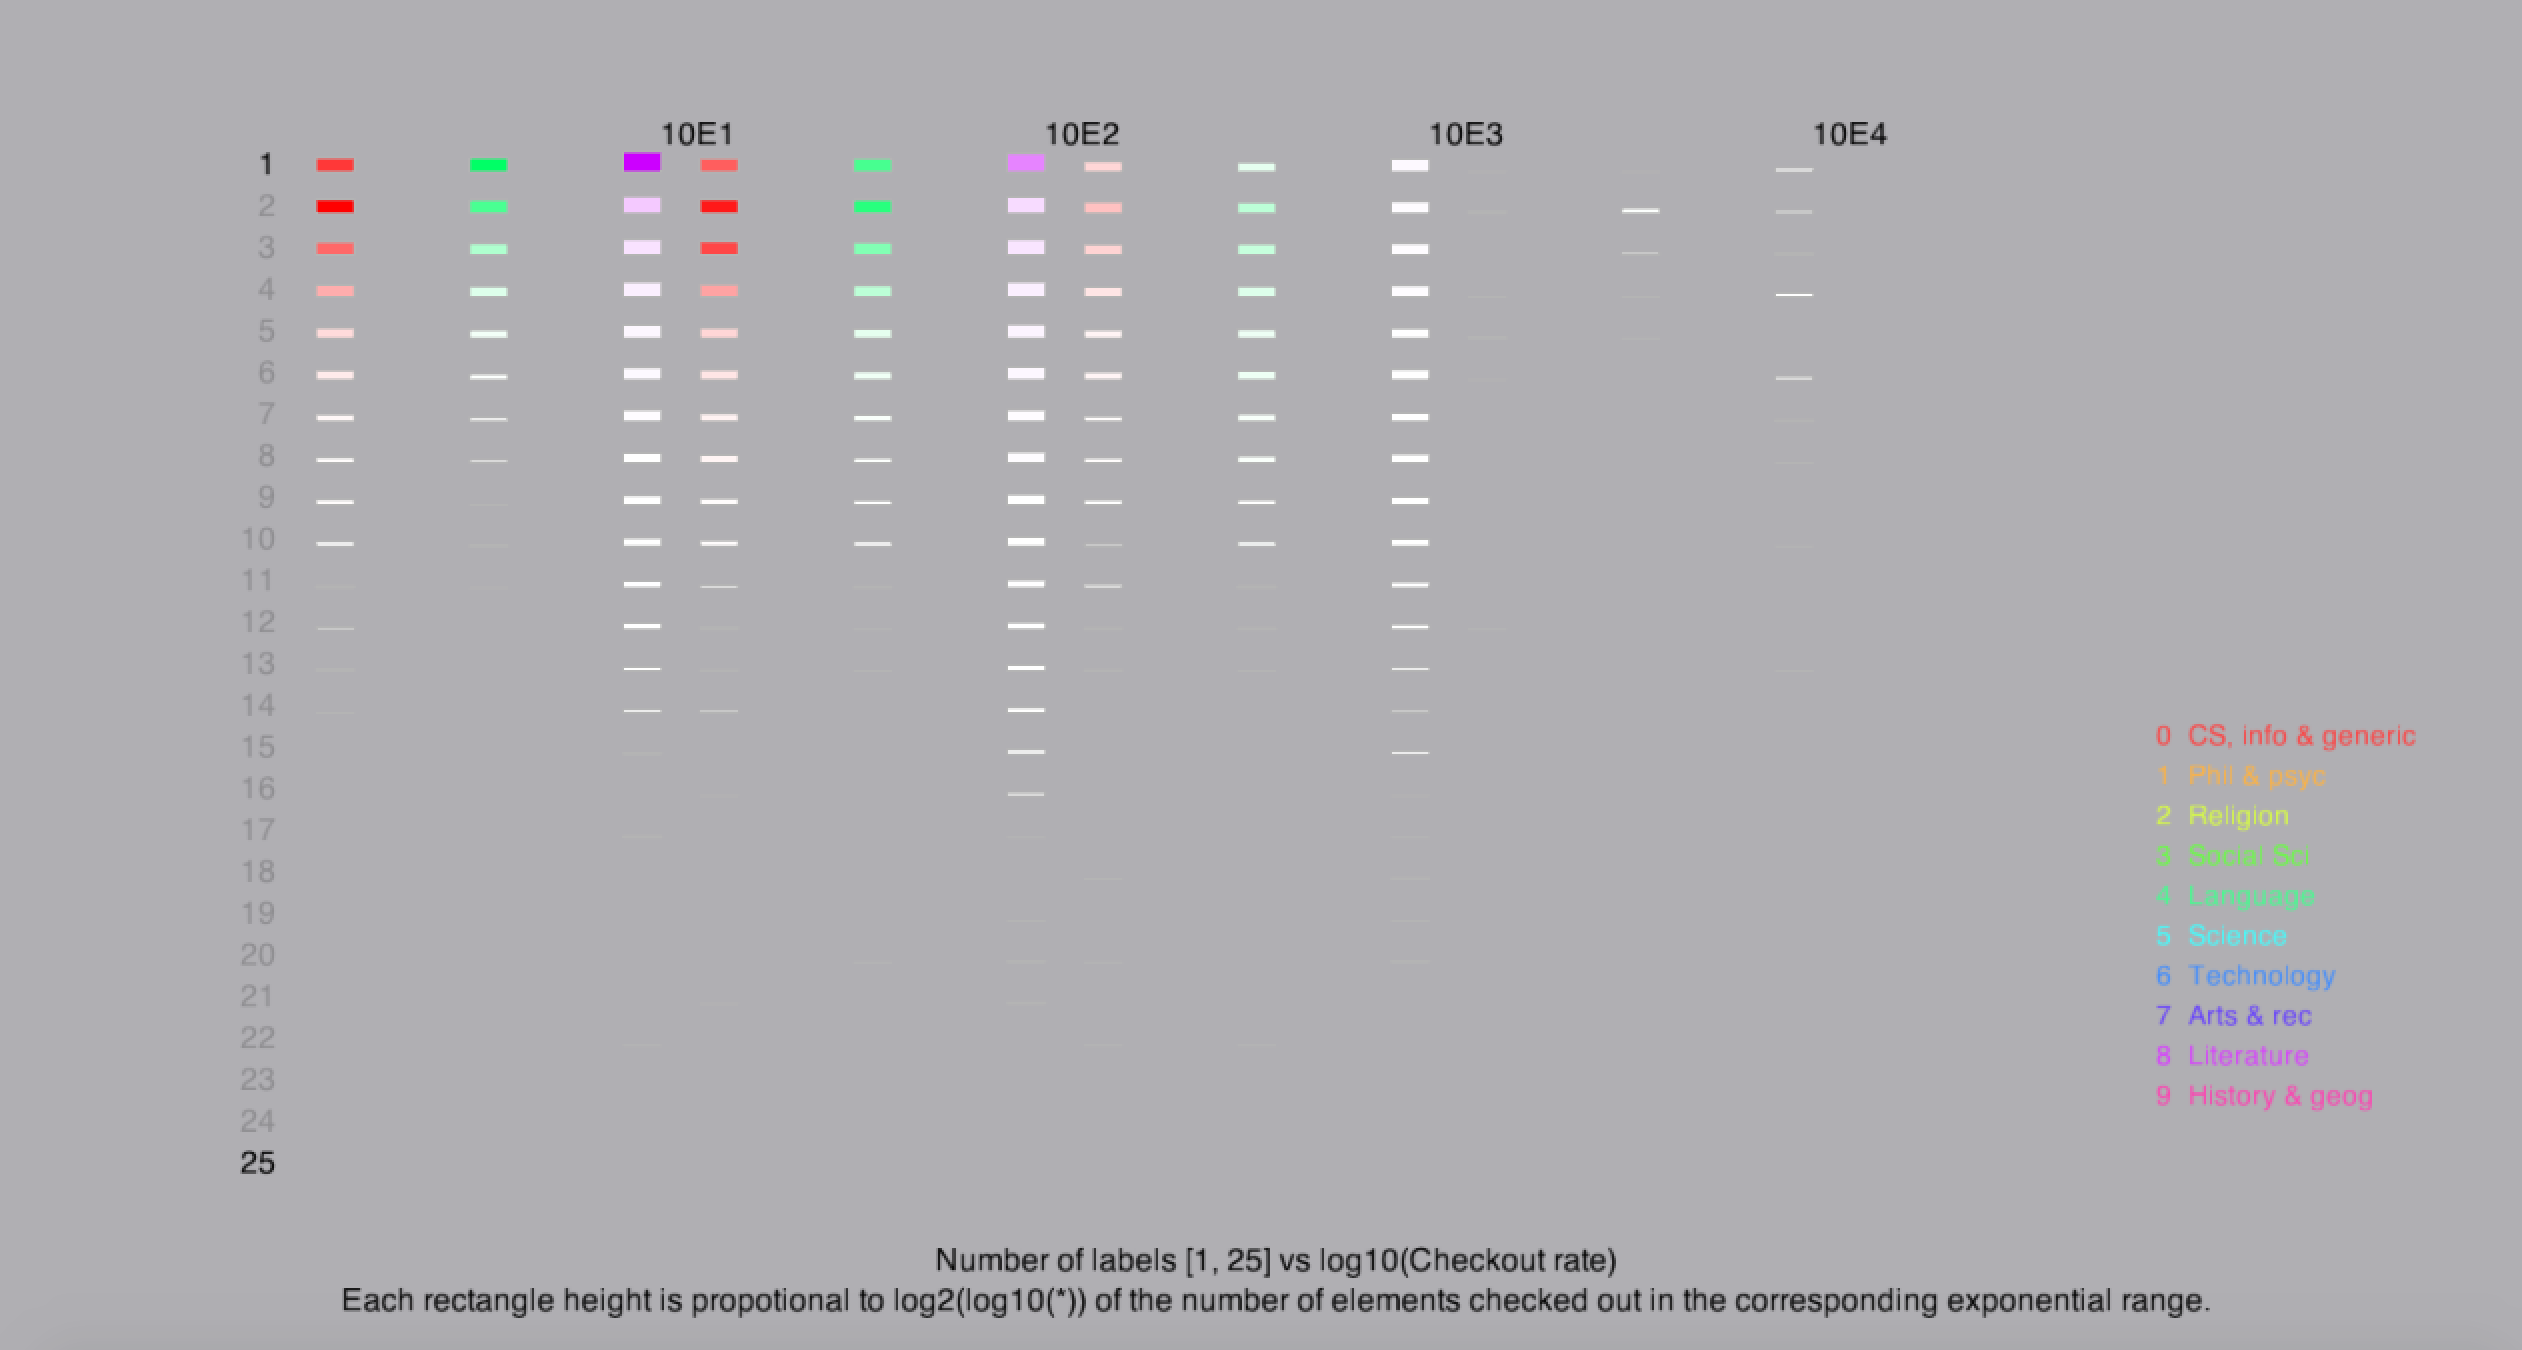
To compare different elements of different Dewey Classes, simply press the number associated with this class in the legend after you clear the canvas as you can see in the second process sketch. In the second process sketch, we were interested in comparing the entries of the Dewey Classes corresponding to Philosophy and Psychology, Social Sciences and Arts and recreation. So, we pressed 1, 3 and 7 after clearing the canvas(by pressing the letter 'c'). The canvas plotted the different checkout rates for these categories.
Final result
In the final visualization, each rectangle height is proportional to log2(log10()) of the number of elements checked out in the corresponding exponential range.
Code