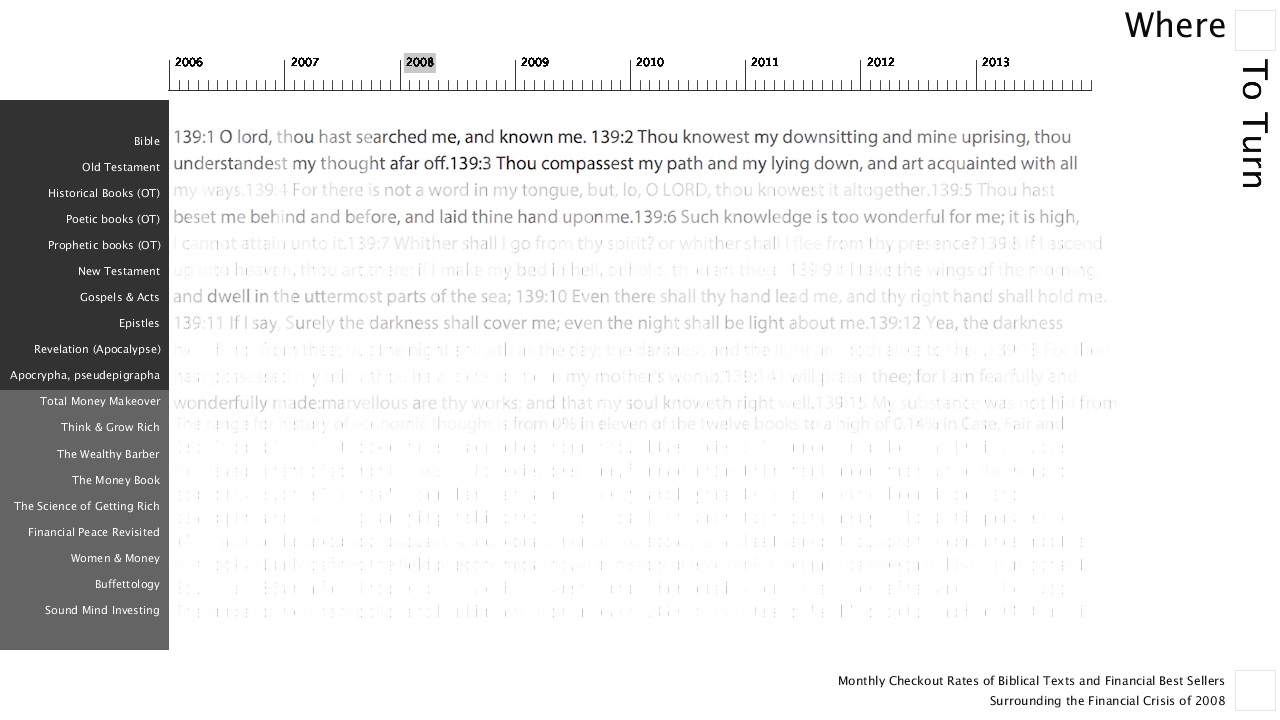
As an institution based on the collection and dissemination of knowledge in the service of the public, our access to the data set of the Seattle Public Library provides an insightful window into the behaviors and patterns of the public’s acquisition of knowledge over time. The time span of this collected data, 2006-2015, naturally encapsulates one of the most important events of recent history: the bursting of the American housing market bubble and resulting financial crisis of 2008. Given this glimpse into a people’s means for seeking & acquiring information, we can begin to focus one lens for studying the public’s reaction to the 2008 financial crisis. By studying relationships of check-out frequency for Biblical Texts & Financial Best Sellers, in relation to the financial fulcrum of 2008, it is possible to make gain an understanding on the way a particular public (that of Seattle) reacts in the wake of financial crisis. Do they turn towards their faith? Or do they place their faith in understanding the world of finance. This visualization creates a 2D matrix in which higher checkout rates correlate to a more visible display of the text representing each category.
SELECT
MONTH(checkOut), YEAR(checkOut),
COUNT(IF( deweyClass >=220 AND deweyClass < 221, 1, NULL)) as "220",
COUNT(IF( deweyClass >=221 AND deweyClass < 222, 1, NULL)) as "221",
COUNT(IF( deweyClass >=222 AND deweyClass < 223, 1, NULL)) as "222",
COUNT(IF( deweyClass >=223 AND deweyClass < 224, 1, NULL)) as "223",
COUNT(IF( deweyClass >=224 AND deweyClass < 225, 1, NULL)) as "224",
COUNT(IF( deweyClass >=225 AND deweyClass < 226, 1, NULL)) as "225",
COUNT(IF( deweyClass >=226 AND deweyClass < 227, 1, NULL)) as "226",
COUNT(IF( deweyClass >=227 AND deweyClass < 228, 1, NULL)) as "227",
COUNT(IF( deweyClass >=228 AND deweyClass < 229, 1, NULL)) as "228",
COUNT(IF( deweyClass >=229 AND deweyClass < 230, 1, NULL)) as "229",
COUNT(IF( title LIKE '%total money makeover%', 1, NULL)) as "Total Money Makeover",
COUNT(IF( title LIKE '%think and grow rich%', 1, NULL)) as "Think and Grow Rich",
COUNT(IF( title LIKE '%wealthy barber%', 1, NULL)) as "the wealthy barber",
COUNT(IF( title LIKE '%money book for the young, fabulous & broke%', 1, NULL)) as "the money book for the young fabulous, & broke",
COUNT(IF( title LIKE '%science of getting rich%', 1, NULL)) as "the science of getting rich",
COUNT(IF( title LIKE '%financial peace revisited%', 1, NULL)) as "financial peace revisited",
COUNT(IF( title LIKE '%women & money%', 1, NULL)) as "women & money",
COUNT(IF( title LIKE '%buffettology%', 1, NULL)) as "buffettology",
COUNT(IF( title LIKE '%sound mind investing%', 1, NULL)) as "sound mind investing"
FROM
spl3._rawXmlDataCheckOuts
WHERE
(deweyClass >= 220 AND deweyClass < 230) OR (deweyClass >= 330 AND deweyClass < 340) OR deweyClass = 650 AND DATE(checkOut) >= '20060101' AND DATE(checkOut) <= '20141231'
GROUP BY MONTH(checkOut), YEAR(checkOut)
ORDER BY YEAR(checkOut), MONTH(checkOut)
To visualize the data, I departed from the more traditional graphical method--in which abstract geometries correlate to aspects of the data--in favor of a method that directly represented the actual content of the data. Here, we see text from the various books represented in the visualization. The opacity of the text relates to the frequency with which these books were checked out. The more clearly the text is able to be read, the higher the frequency of checkout for that book.
Taken as a whole, one can see that in 2008 (the year of the crisis) and the following two years, the frequency of Bible checkouts increased--the text becoming fully defined and clear in the visualization.
In contrast, (and curiously) the checkout frequency of best-selling books on Finance seemed to be unaffected by the financial crisis.