How does the dead rock star stay alive?
:: 2D Matrix visualization
:: 2D Matrix visualization
MAT 259, 2016
Jing Yan / Eye
Concept
On January 10, 2016, David Bowie, one of the most influential musicians of his era, whose persistent innovations and personal reinventions transformed him into a larger-than-life rock star and cultural icon, passed away.
When rock stars are dead, they are never gone. They keep being memorized by millions of their fans, music lovers, and the public. Their songs went on again and again. And as culture icons, their life stories are discovered, passed on, and exaggerated year by year.
Question
I am interested in the topic: how the dead rock star, like David Bowie, stays alive. If the users in the Seattle Public Library can be considered as a miniature of society, I would like to examine the aliveness of David Bowie through analyzing the checkout information of his CDs and related books. From 2005-2015, how does the times verify of CDs being checked out? Will the results have some patterns related to specific important dates such as birthday? What influence would happen after the musician released a new album? Is there anything interesting that the different checkout duration of books and CDs can reveal? Those questions make me curious, and based on them I set up my query.
Approach
In my view, the aliveness of David Bowie can be examined through two dimension: the quantity and quality. While the checkout times could be regarded as the quantity index, the checkout duration could be considered as the quality index. I select the data of David Bowies CDs and related books checkout times of every day and month and year separately, and each items(with the same title) checkout duration.
Query
The call Numbers of all David Bowies related items contain the same part which is 782.42166 B679 and CD starts with the type CD. Moreover, items with the 782.42166 B679 in call numbers are exclusively related to David Bowie. Thus, I use this special condition to select all David Bowies CDs and related books.
According to the call number, I select the bibNumber for each of them and use this as condition to pick out items.
each CD's checkout times per month
SELECT
itemType,
title,
barcode,
DATE_FORMAT(checkout, '20%y-%m') AS date,
COUNT(checkout) AS checkoutTimes,
AVG(TIMESTAMPDIFF(DAY, checkout, checkin)) AS itemDuration
FROM
spl3._rawXmlDataCheckIns
WHERE
bibNumber = '1952906'
OR bibNumber = '2148651'
OR bibNumber = '2023159'
OR bibNumber = '2362135'
OR bibNumber = '3029080'
OR bibNumber = '2023157'
OR bibNumber = '2299335'
OR bibNumber = '1954184'
OR bibNumber = '1736211'
OR bibNumber = '2627462'
OR bibNumber = '2128387'
OR bibNumber = '3061214'
OR bibNumber = '1959048'
OR bibNumber = '1950899'
OR bibNumber = '2444123'
OR bibNumber = '2515298'
OR bibNumber = '1976192'
OR bibNumber = '2086964'
OR bibNumber = '1953017'
OR bibNumber = '2867039'
OR bibNumber = '3057303'
OR bibNumber = '1639110'
OR bibNumber = '2363644'
OR bibNumber = '2567243'
OR bibNumber = '2211550'
OR bibNumber = '3067034'
OR bibNumber = '2631168'
OR bibNumber = '1954182'
OR bibNumber = '1880152'
OR bibNumber = '2412531'
OR bibNumber = '1976321'
OR bibNumber = '2296937'
OR bibNumber = '1972971'
OR bibNumber = '2448150'
OR bibNumber = '2612658'
OR bibNumber = '1953009'
GROUP BY title,date
ORDER BY date,title
each Book's checkout times per month
SELECT
itemType,
title,
barcode,
DATE_FORMAT(checkout, '20%y-%m') AS date,
COUNT(checkout) AS checkoutTimes,
AVG(TIMESTAMPDIFF(DAY, checkout, checkin)) AS itemDuration
FROM
spl3._rawXmlDataCheckIns
WHERE
bibNumber = '1836438' OR bibNumber = '1965047'
OR bibNumber = '2277690'
OR bibNumber = '1823619'
OR bibNumber = '2613601'
OR bibNumber = '2707908'
OR bibNumber = '2723037'
OR bibNumber = '2815071'
OR bibNumber = '2917442'
OR bibNumber = '2941304'
OR bibNumber = '3029321'
GROUP BY title,date
ORDER BY date,title
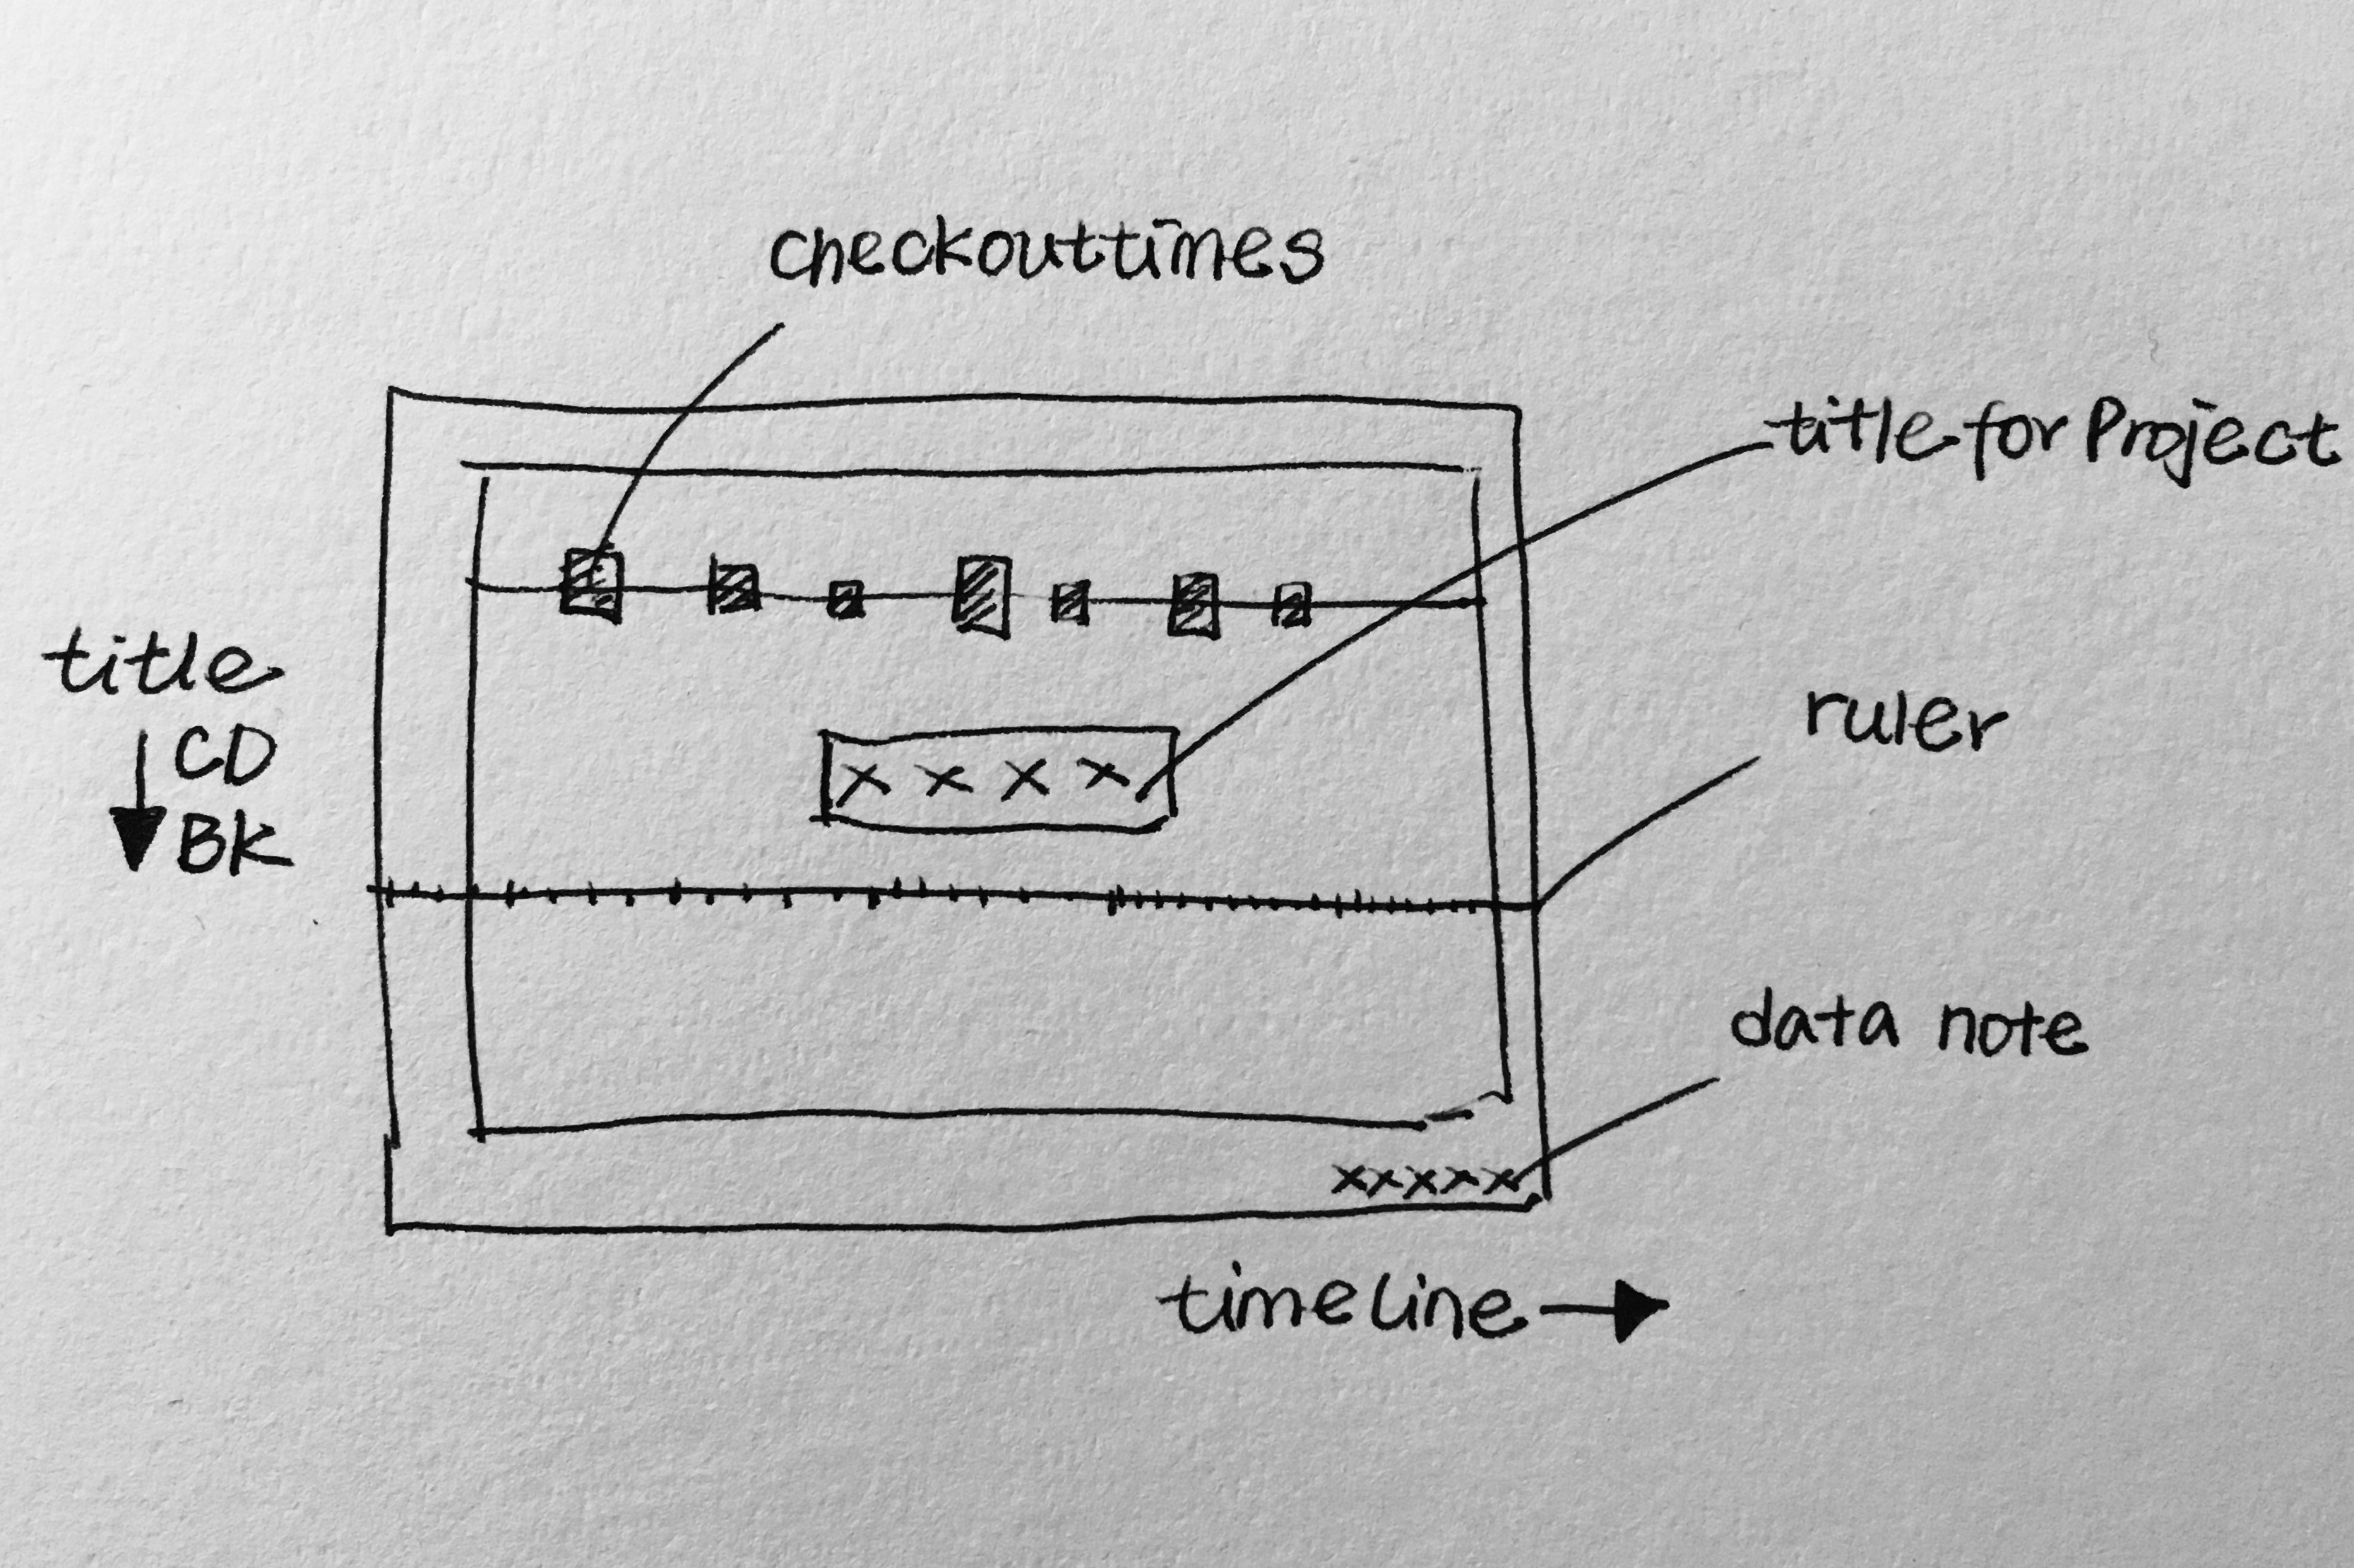
Preliminary sketches
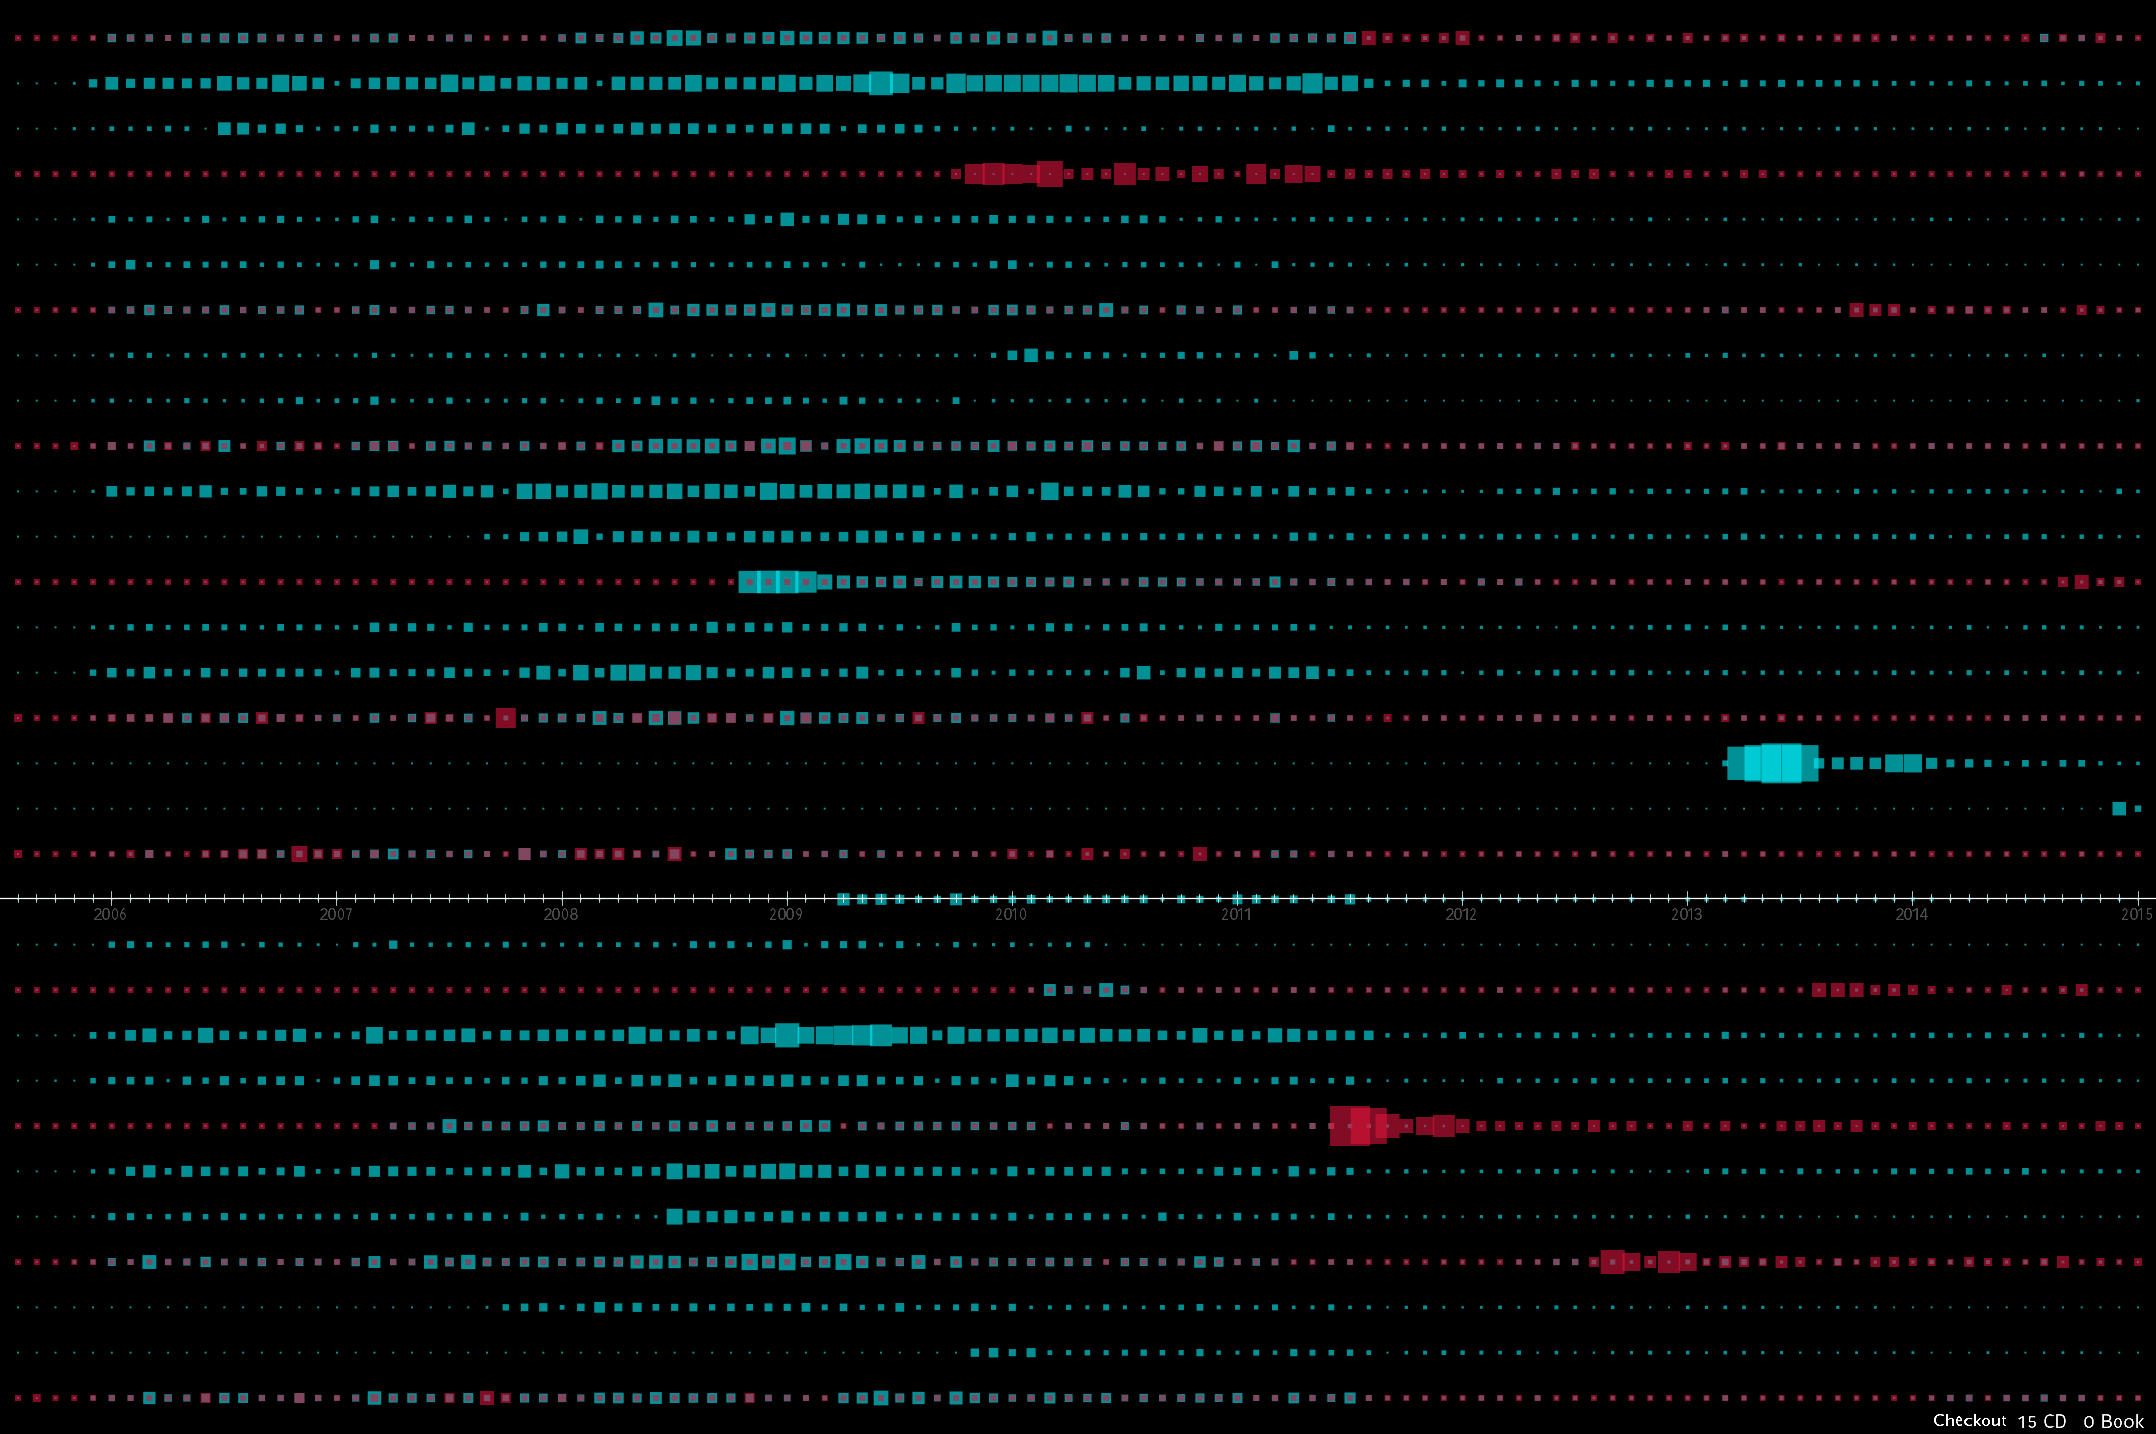
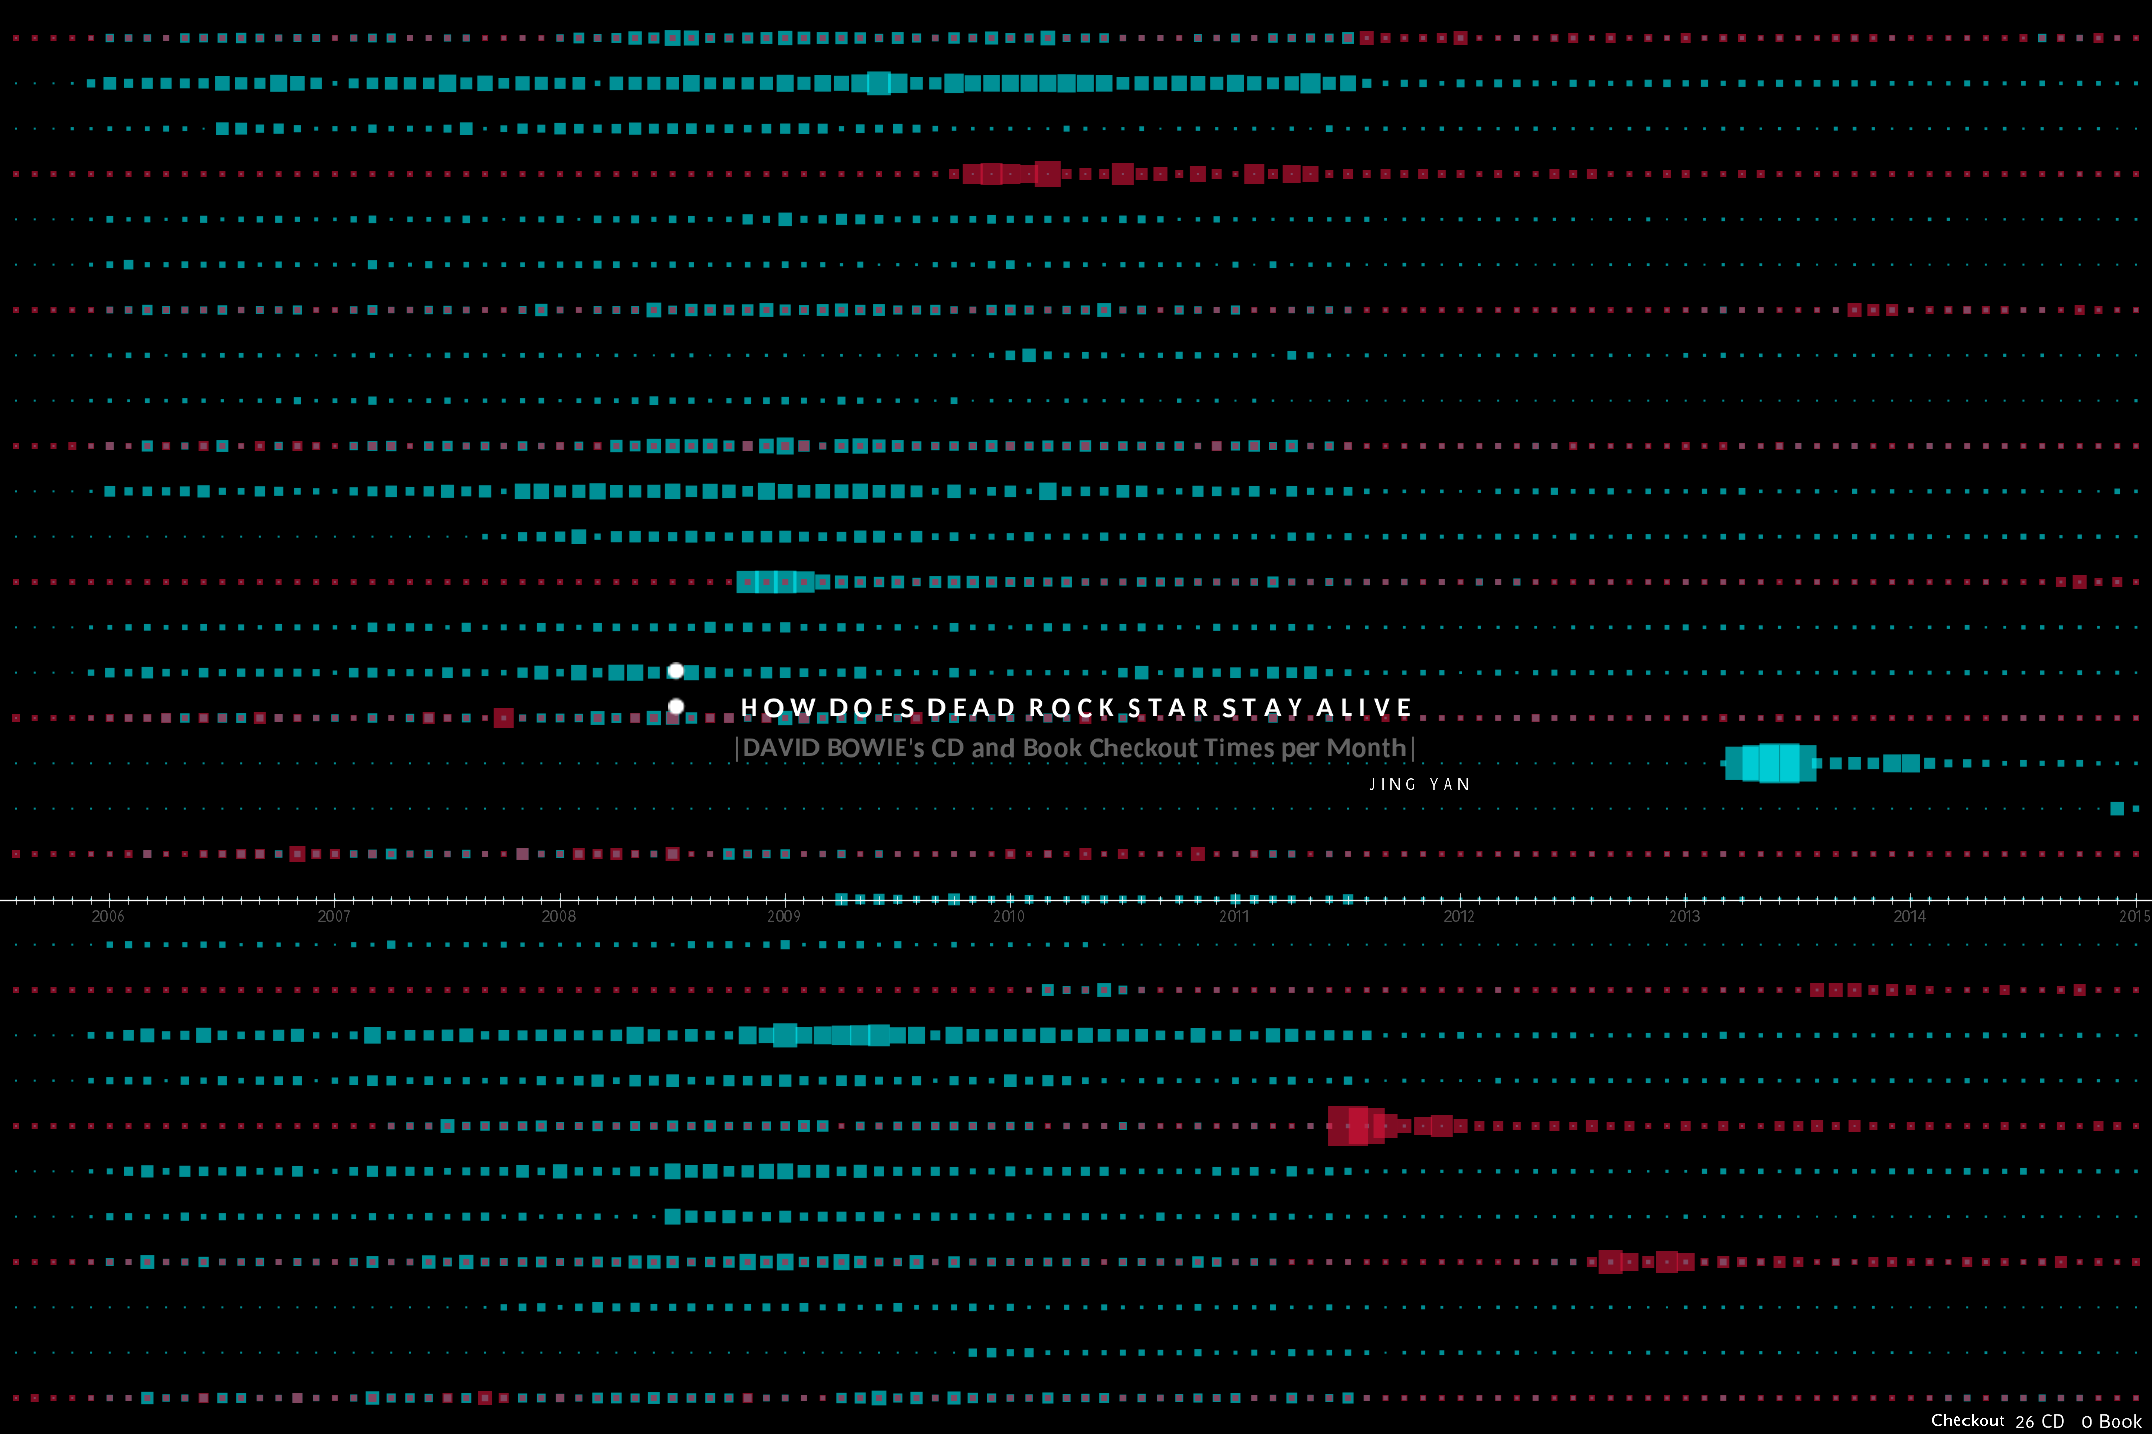
I mainly focus on the quantity dimension. I select the data of David Bowies CDs and related books checkout times per month from 2005 to 2015 in the Seattle Public Library.
Visualization layout
I put the titles on the Y-axis. And the X-axis is still the timeline. The Data of CD and book are distinguished by different color: blue for CD, and red for book. And they are all to some extent transparent to get an overlay view. The checkout times per month is mapping to the length of the square
Process
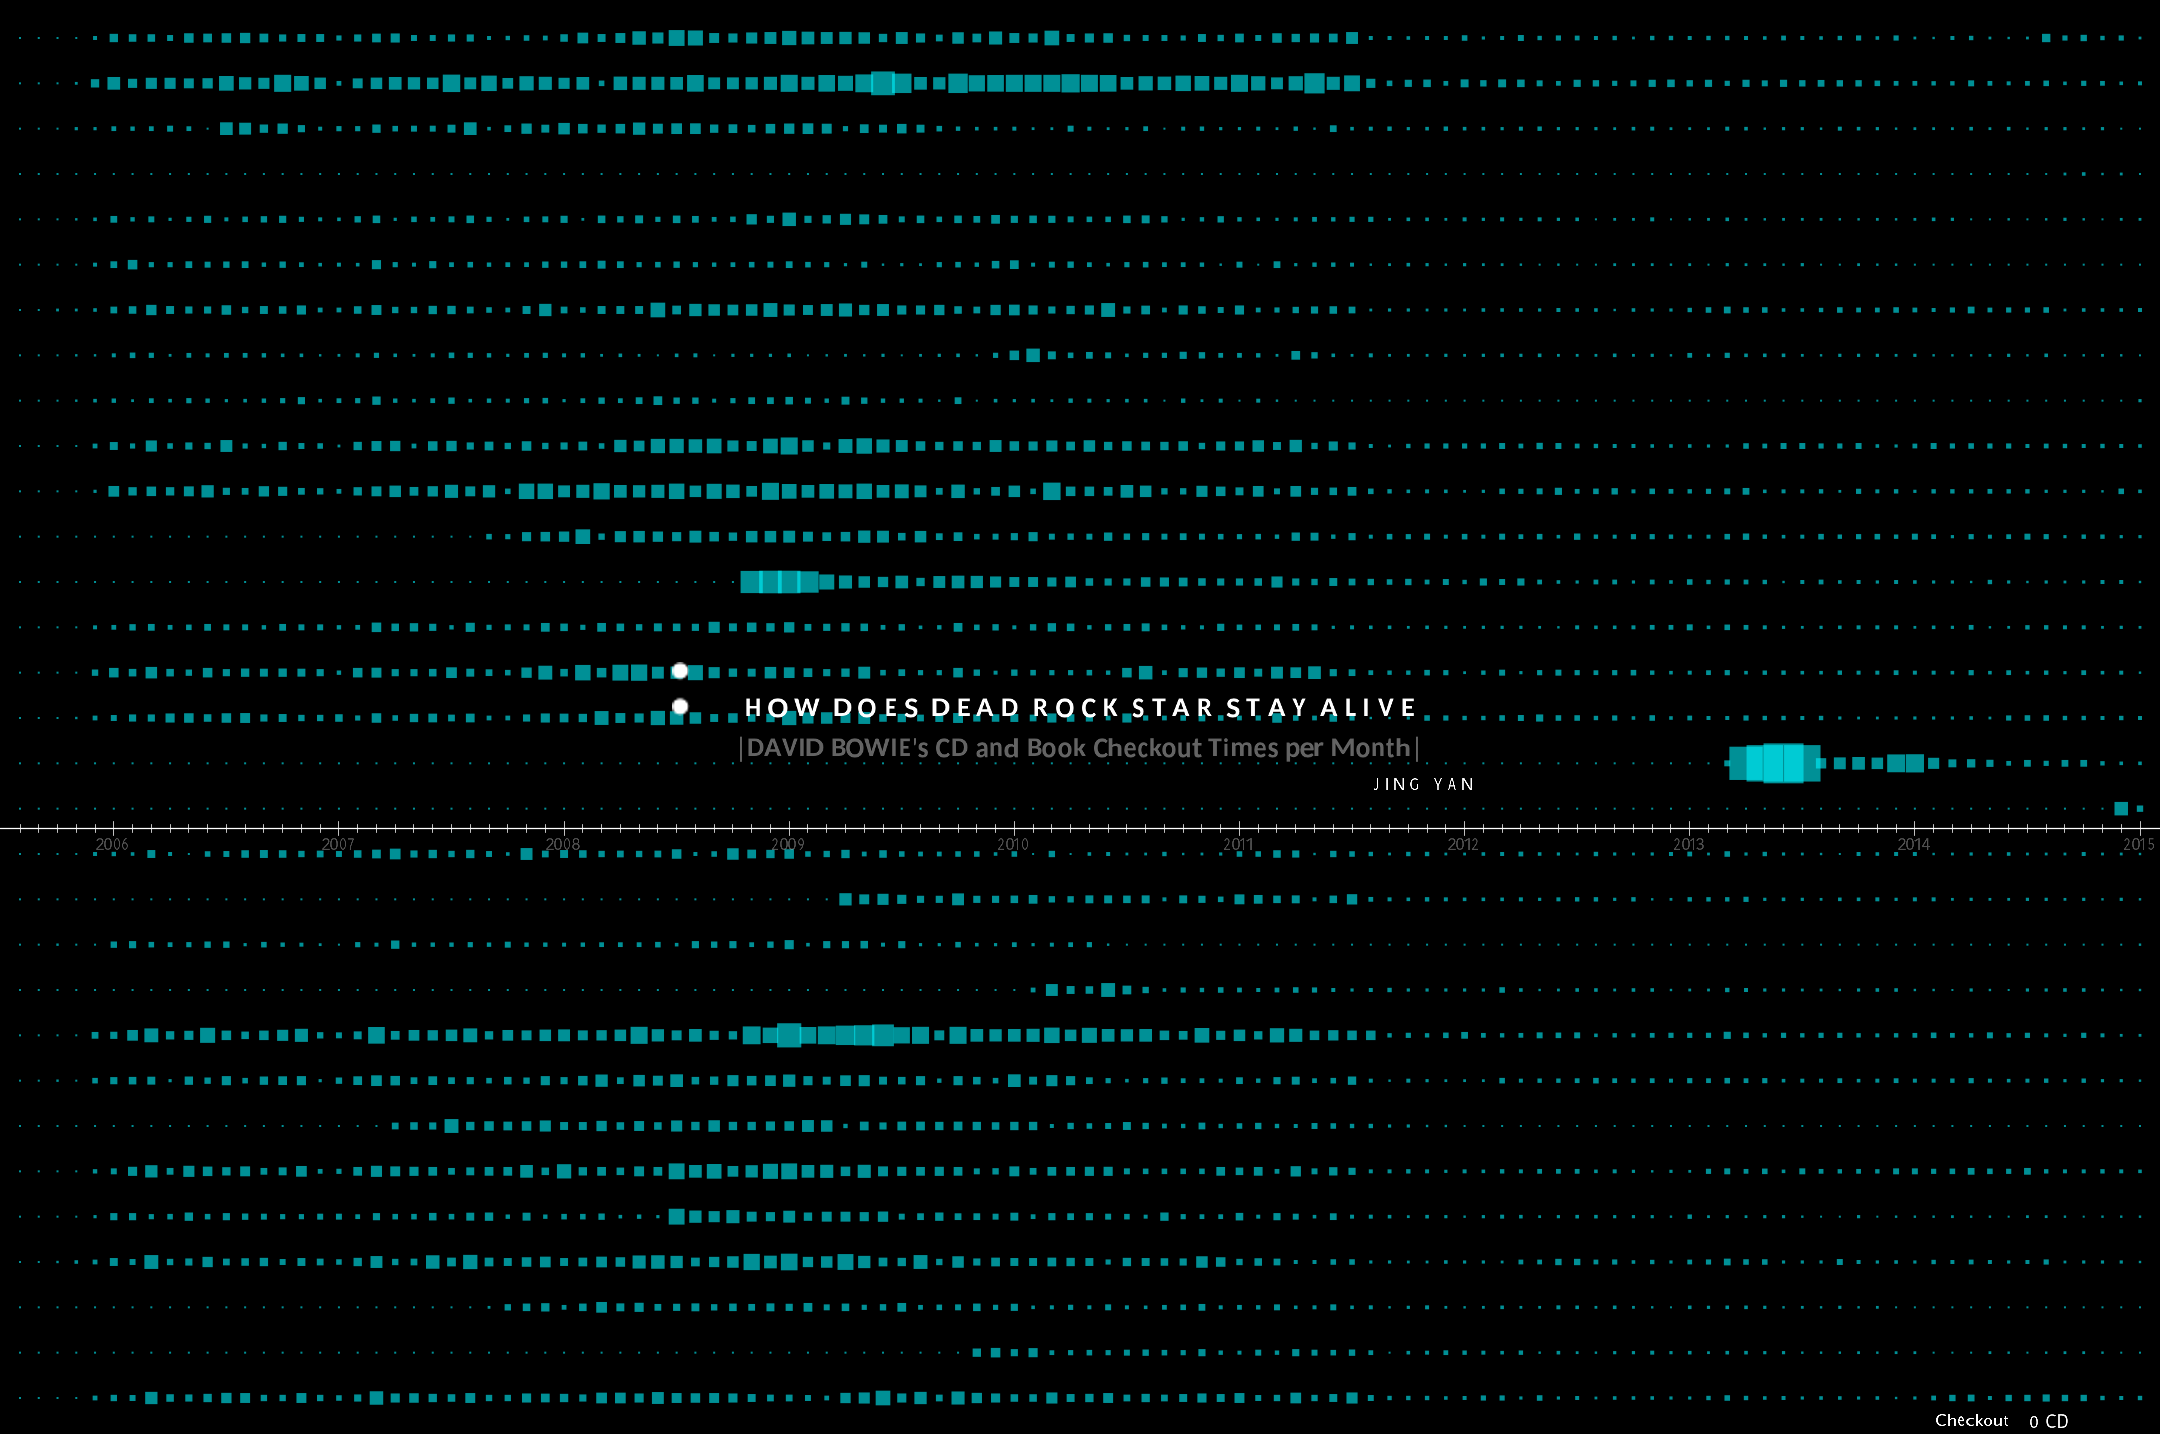
/ CD data with normalization
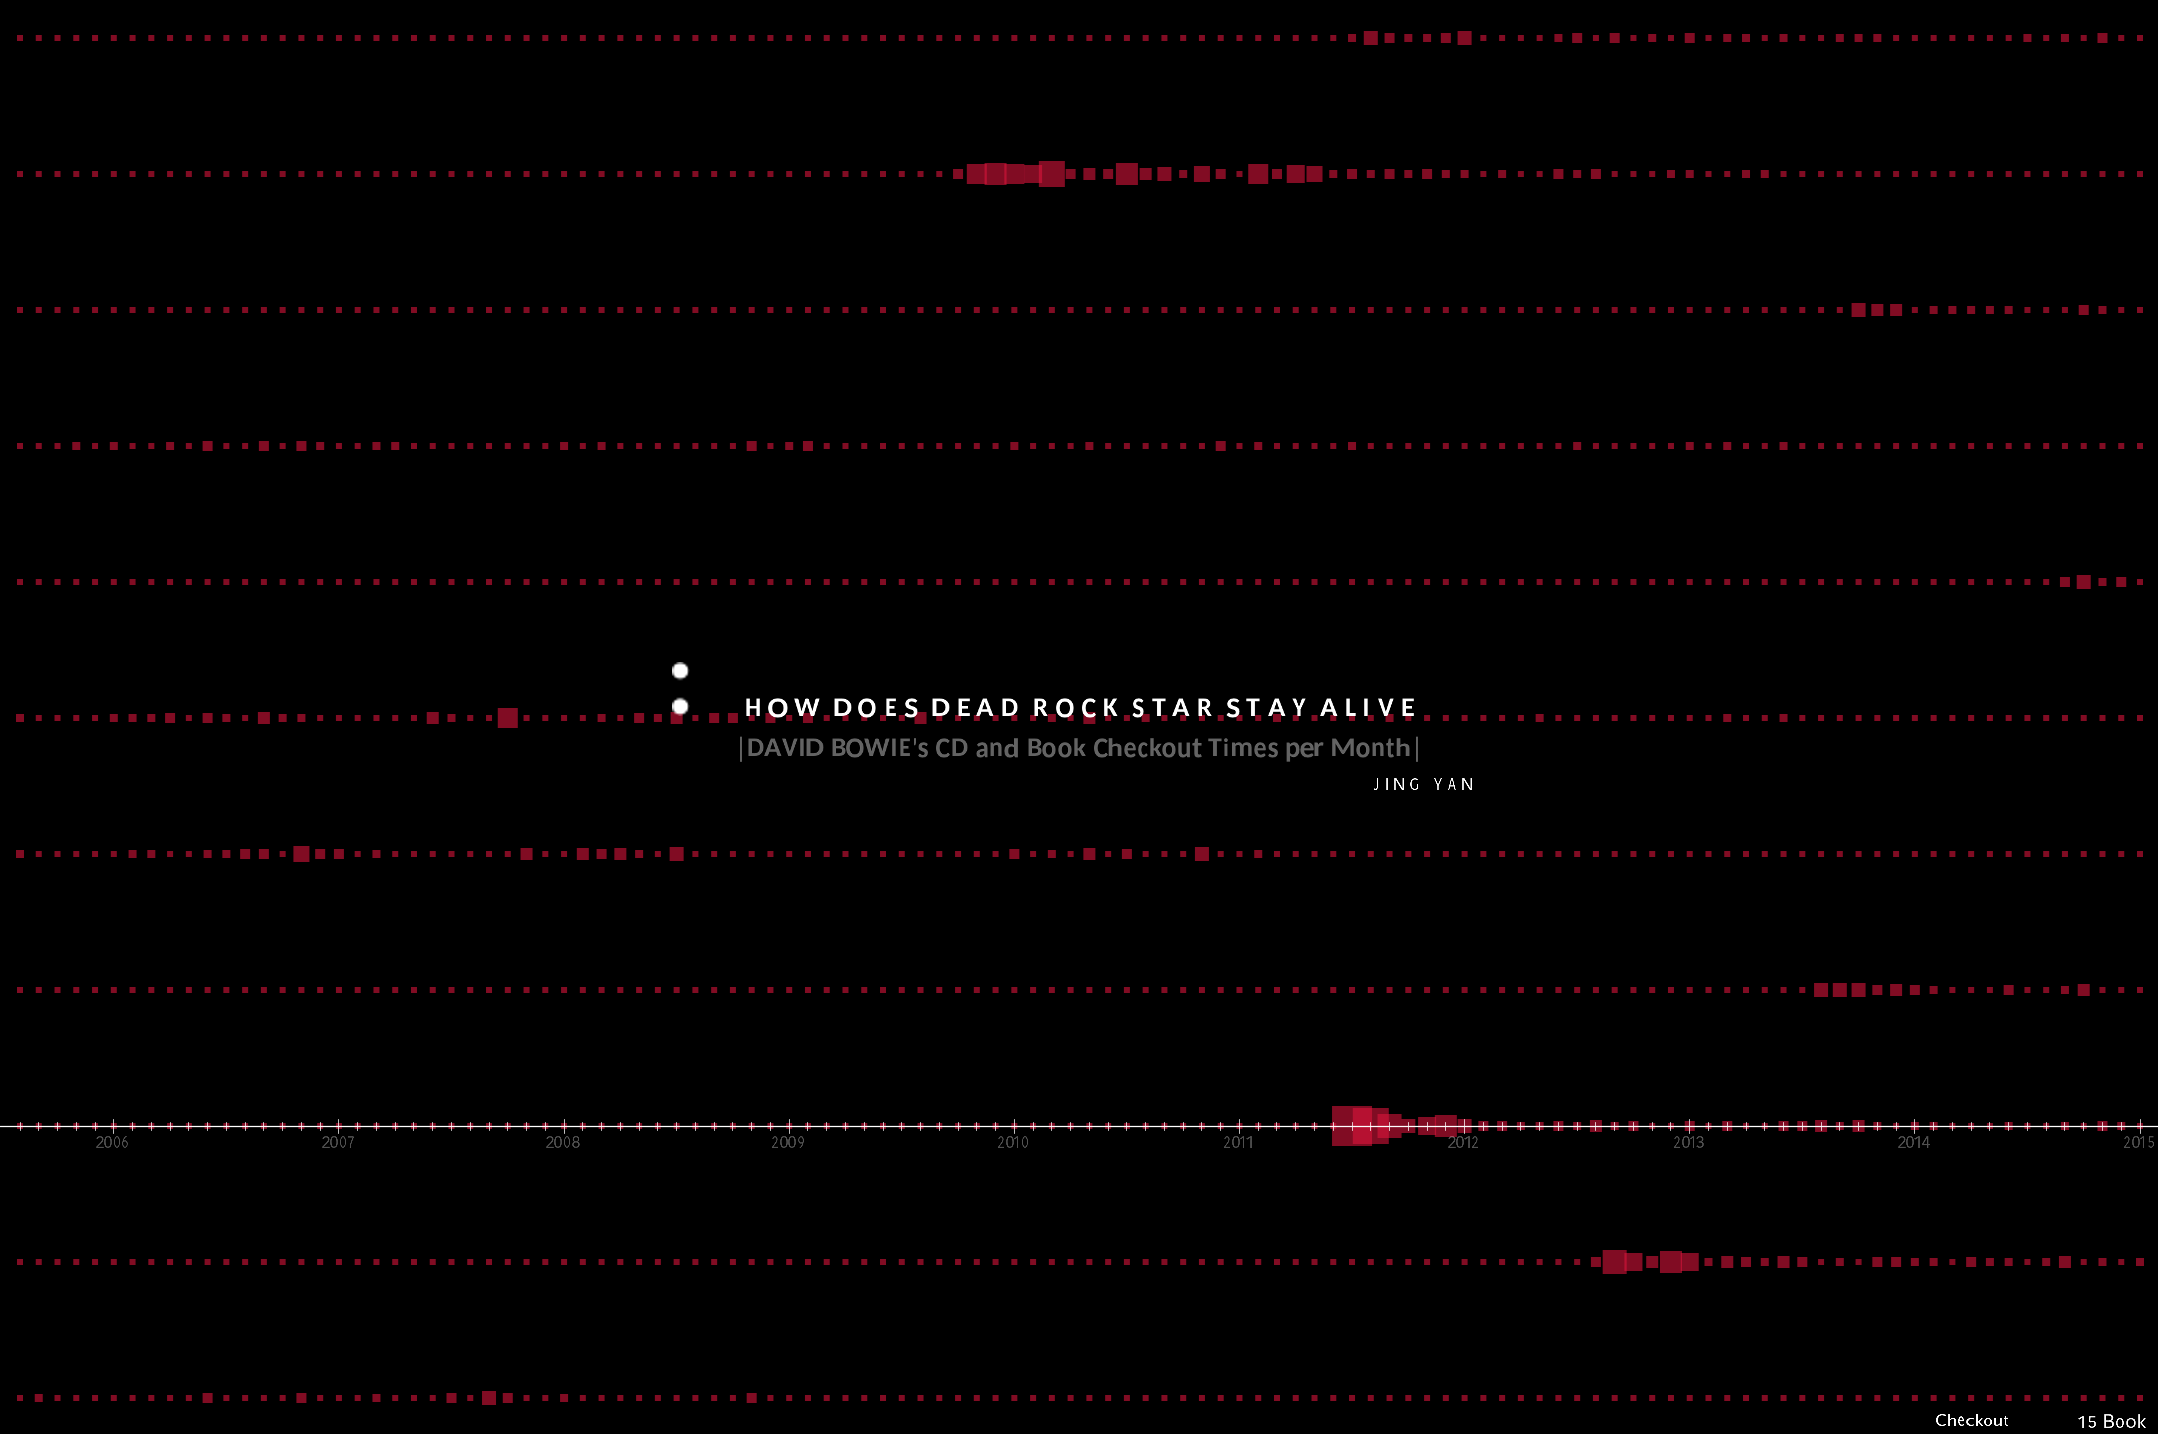
/ book data with normalization
Final result
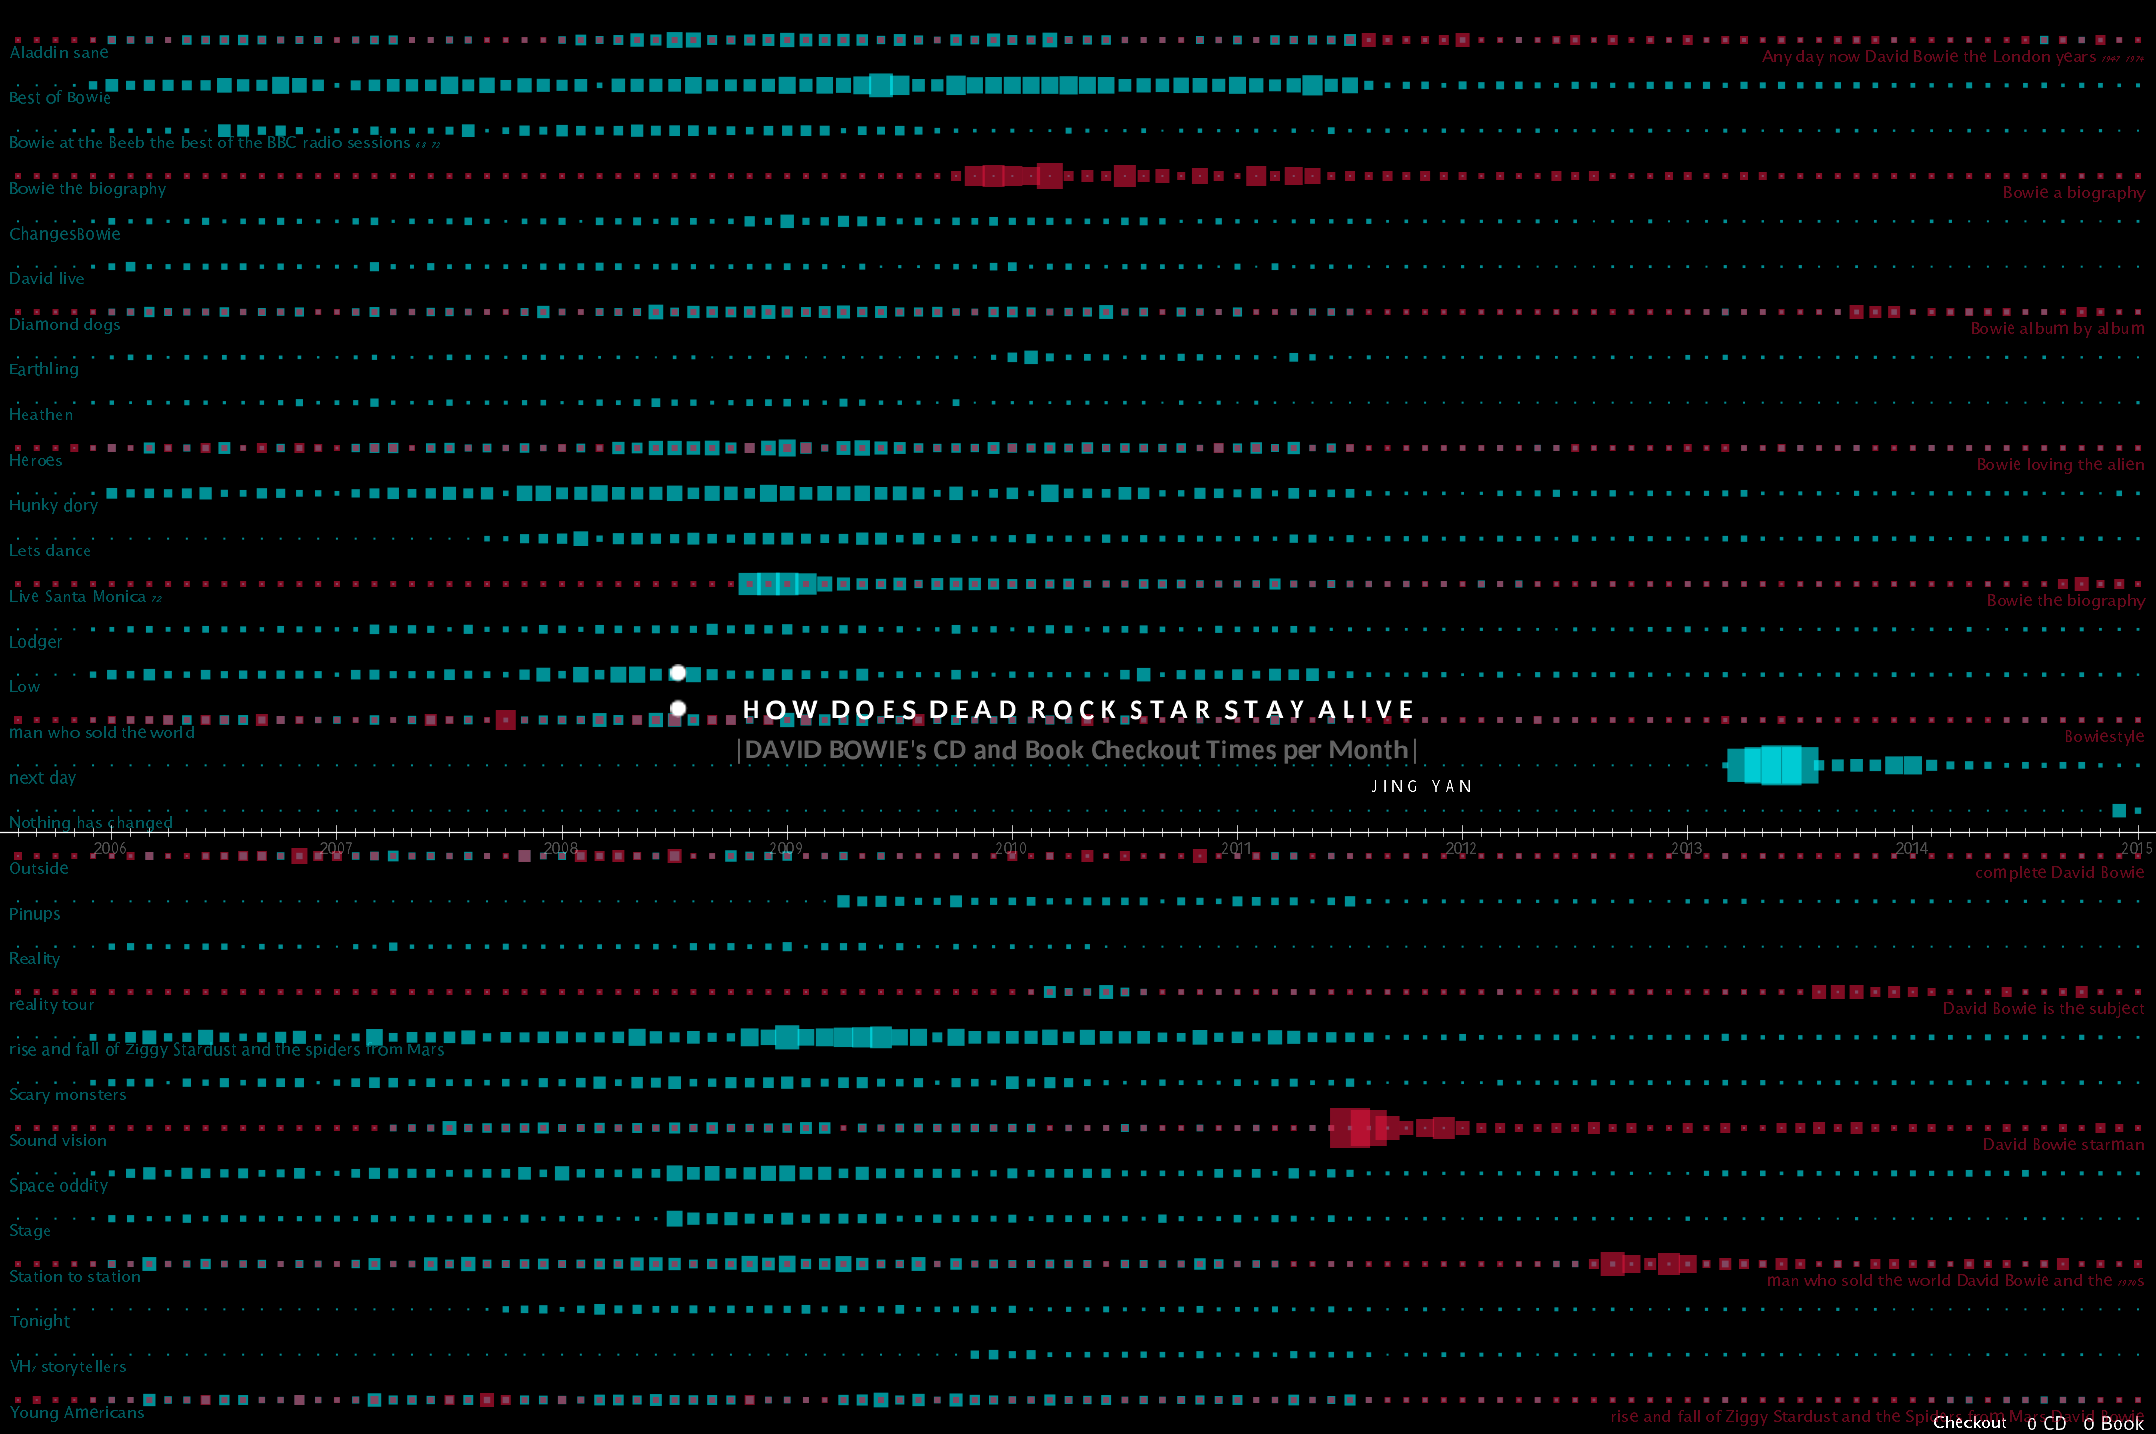
/ all on general layout
Interaction
I like the way data pattern speaks for themselves, thus I spread them all over the screen. And make them the most obvious thing on the interface. To eliminate the distraction, I make switches which allows you to shut off the title and labels.
By press the key R/r, a ruler of timeline will show up for positioning time. The ruler follows the mouse movement to indicate the exact time. Moreover, a footnote-data will show each value where the mouse points at.
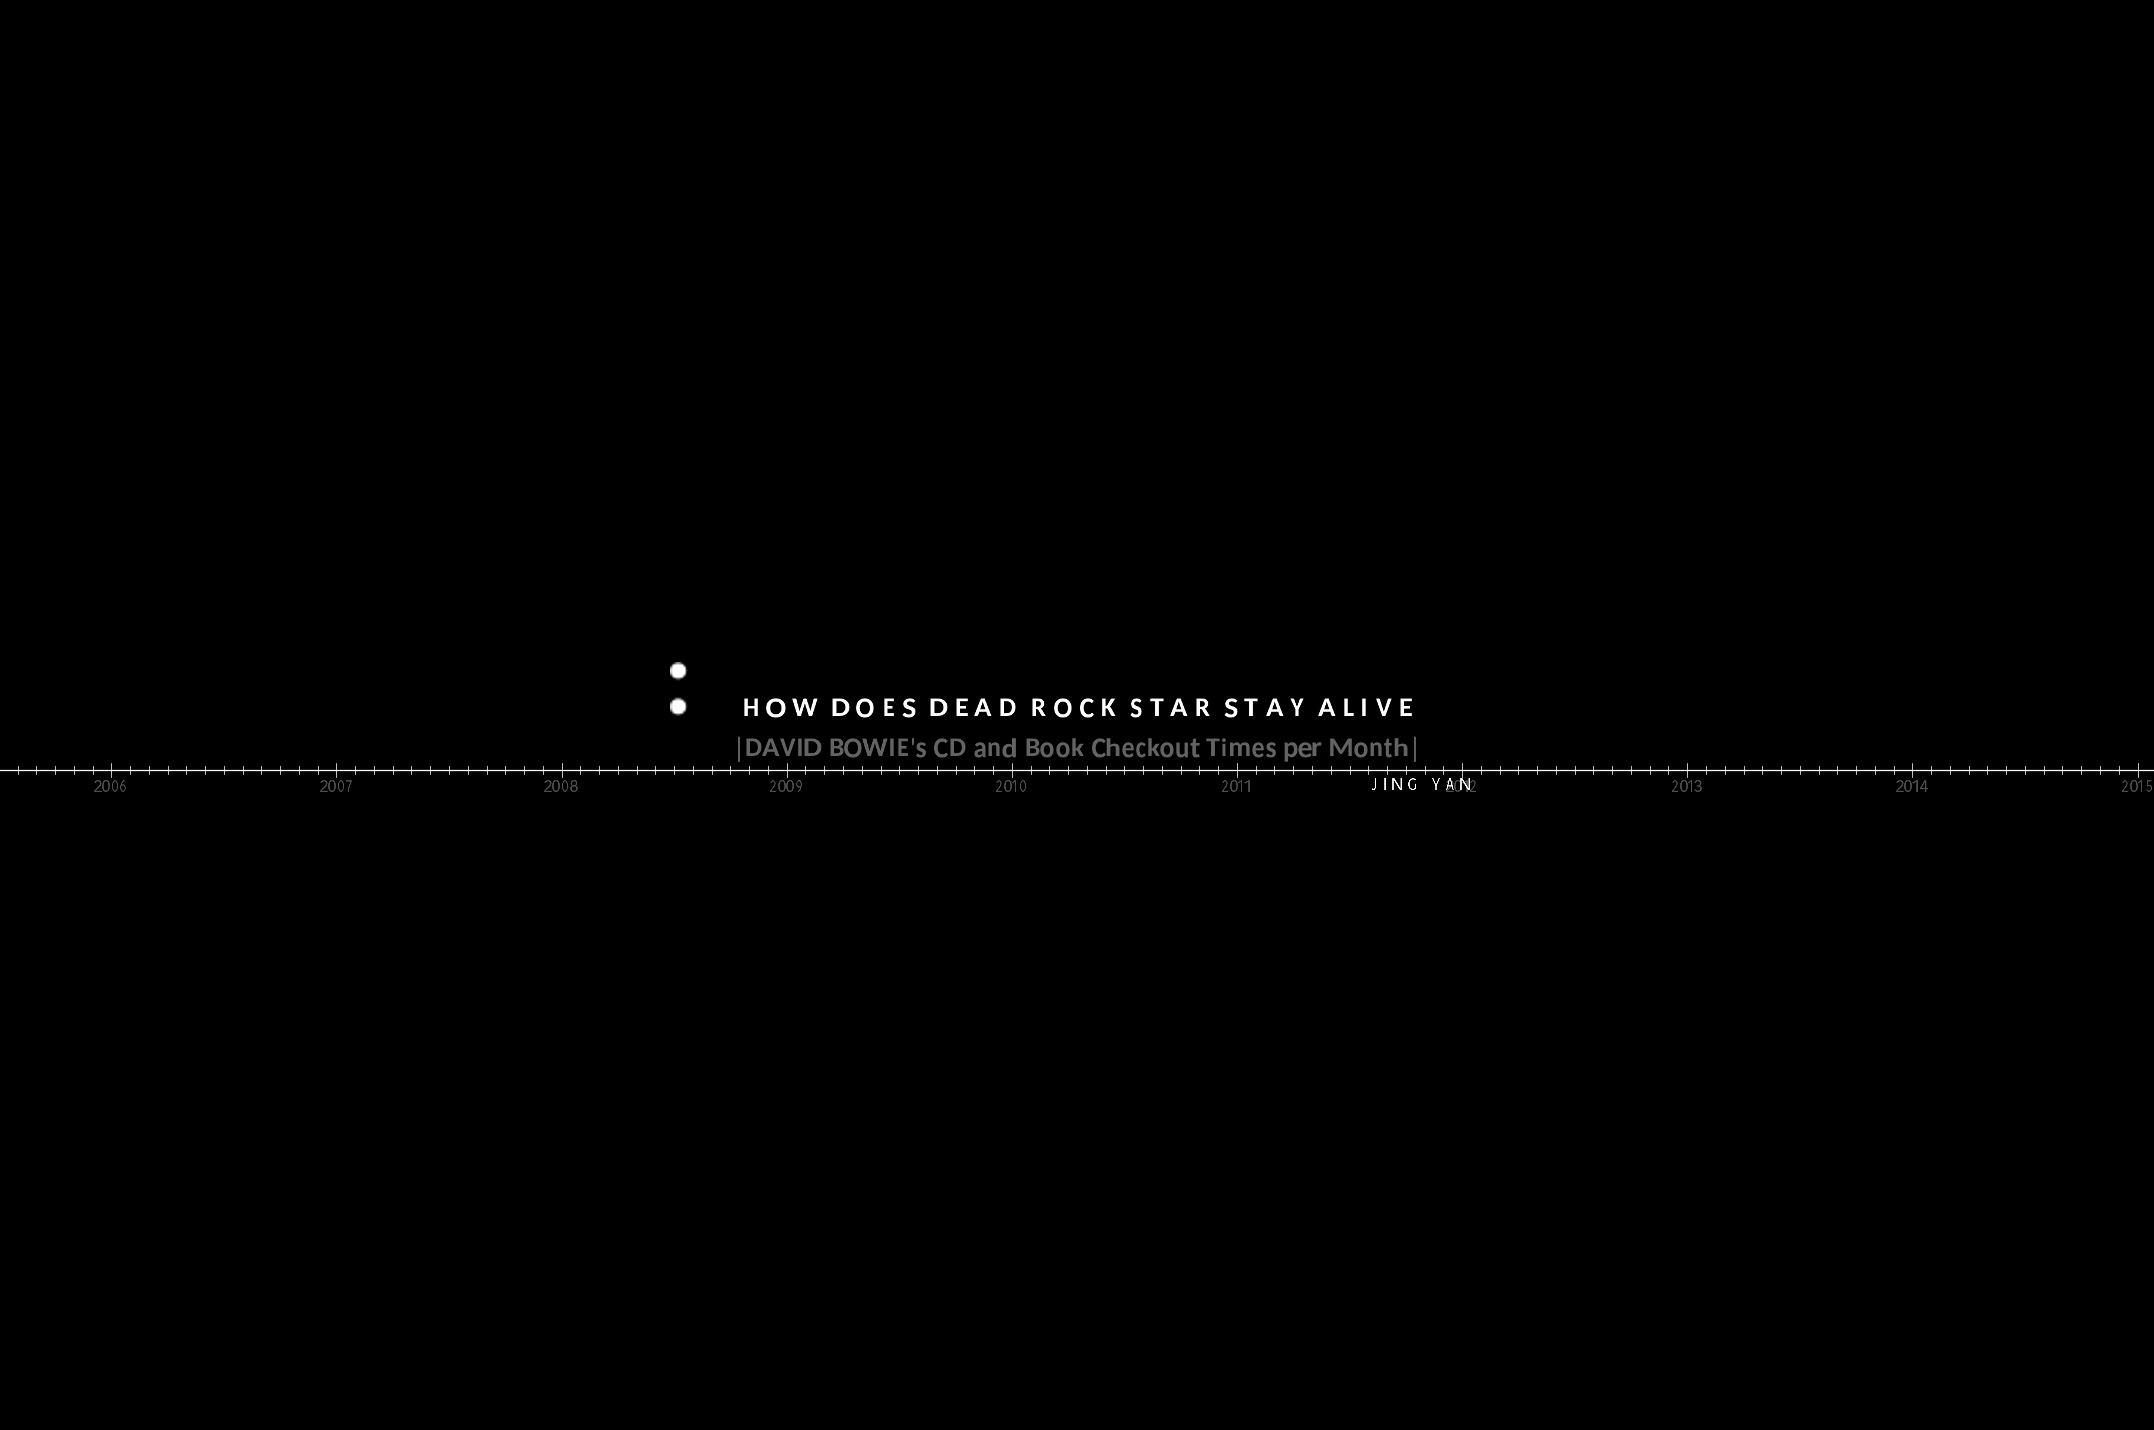
/ first view
/ title off
/ label off
Style
In this revision, I explore more about Ryoji Ikeda art style. The background is changed from white to black to express a sense of empty both in time and space. The design is another attempt to create a feeling of calm, rationality and accuracy.
Code