Total Number of Checkout Books at SPL from 2006-2014
MAT 259, 2016
Han-Wei Kung
Concept
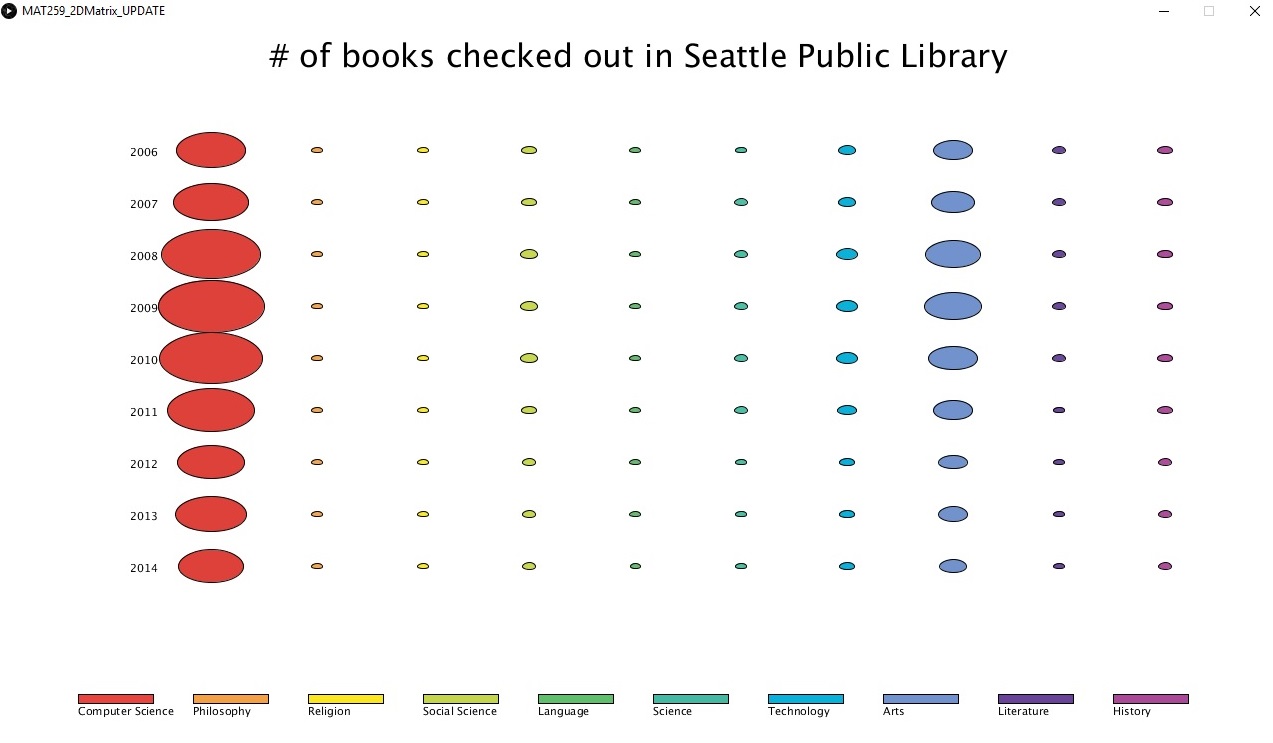
I would like to visualize the amount of books checked out in each category from 2006 and 2014.
Query
My query runs as follows:
SELECT
SUM(CASE WHEN YEAR(checkOut) = 2006 THEN 1 ELSE 0 END) `2006`,
SUM(CASE WHEN YEAR(checkOut) = 2007 THEN 1 ELSE 0 END) `2007`,
SUM(CASE WHEN YEAR(checkOut) = 2008 THEN 1 ELSE 0 END) `2008`,
SUM(CASE WHEN YEAR(checkOut) = 2009 THEN 1 ELSE 0 END) `2009`,
SUM(CASE WHEN YEAR(checkOut) = 2010 THEN 1 ELSE 0 END) `2010`,
SUM(CASE WHEN YEAR(checkOut) = 2011 THEN 1 ELSE 0 END) `2011`,
SUM(CASE WHEN YEAR(checkOut) = 2012 THEN 1 ELSE 0 END) `2012`,
SUM(CASE WHEN YEAR(checkOut) = 2013 THEN 1 ELSE 0 END) `2013`,
SUM(CASE WHEN YEAR(checkOut) = 2014 THEN 1 ELSE 0 END) `2014` FROM spl3._rawXmlDataCheckIns
WHERE
deweyClass >= 000 AND deweyClass < 100
AND DATE(checkOut) >= '20060101'
AND DATE(checkOut) <= '20141231'
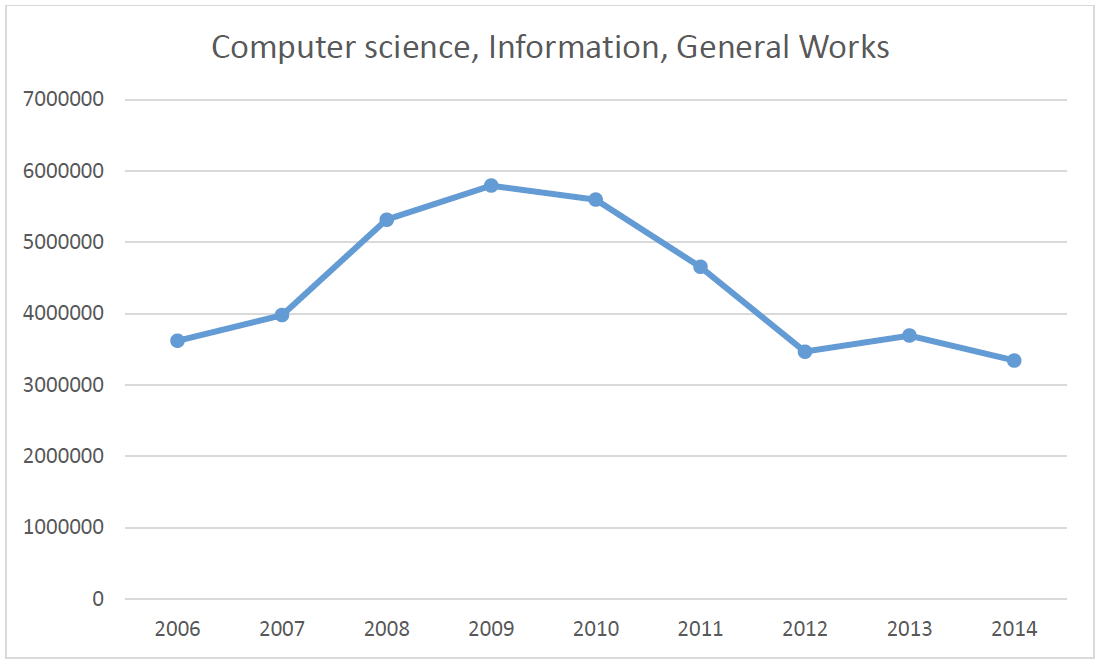
I modified deweyClass for each Dewey Classification. For example, the above query will return the number of books checked out in the category of Computer Science, Information and General Works.
SELECT
SUM(CASE WHEN YEAR(checkOut) = 2006 THEN 1 ELSE 0 END) `2006`,
SUM(CASE WHEN YEAR(checkOut) = 2007 THEN 1 ELSE 0 END) `2007`,
SUM(CASE WHEN YEAR(checkOut) = 2008 THEN 1 ELSE 0 END) `2008`,
SUM(CASE WHEN YEAR(checkOut) = 2009 THEN 1 ELSE 0 END) `2009`,
SUM(CASE WHEN YEAR(checkOut) = 2010 THEN 1 ELSE 0 END) `2010`,
SUM(CASE WHEN YEAR(checkOut) = 2011 THEN 1 ELSE 0 END) `2011`,
SUM(CASE WHEN YEAR(checkOut) = 2012 THEN 1 ELSE 0 END) `2012`,
SUM(CASE WHEN YEAR(checkOut) = 2013 THEN 1 ELSE 0 END) `2013`,
SUM(CASE WHEN YEAR(checkOut) = 2014 THEN 1 ELSE 0 END) `2014` FROM spl3._rawXmlDataCheckIns
WHERE
deweyClass >= 000 AND deweyClass < 100
AND DATE(checkOut) >= '20060101'
AND DATE(checkOut) <= '20141231'
I modified deweyClass for each Dewey Classification. For example, the above query will return the number of books checked out in the category of Computer Science, Information and General Works.
Process
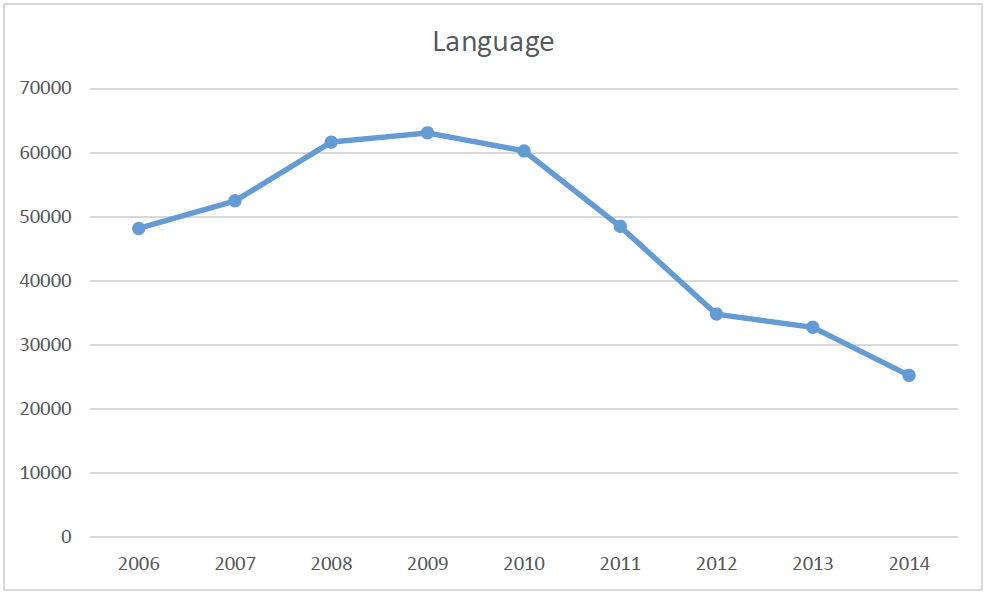
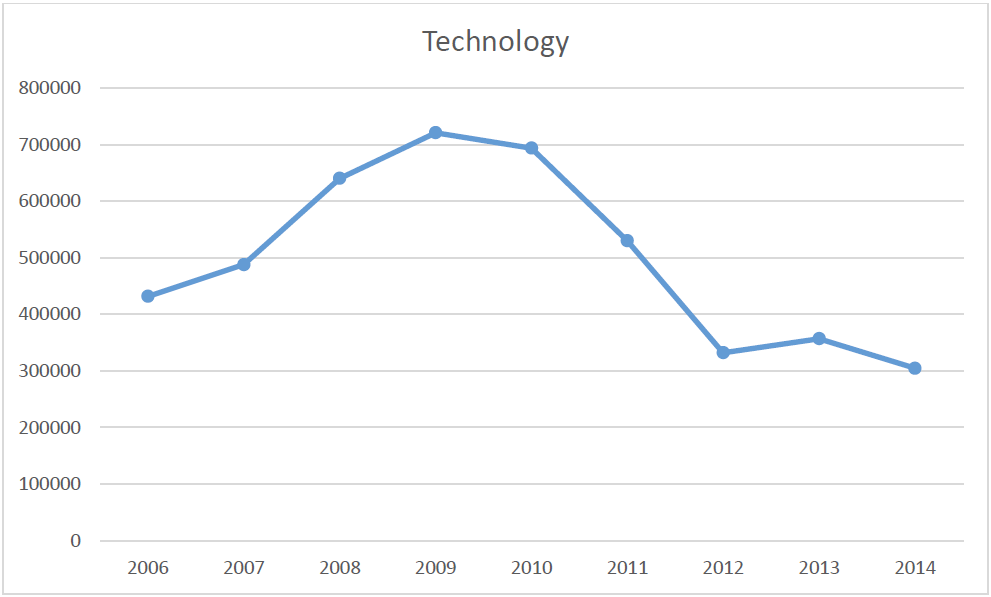
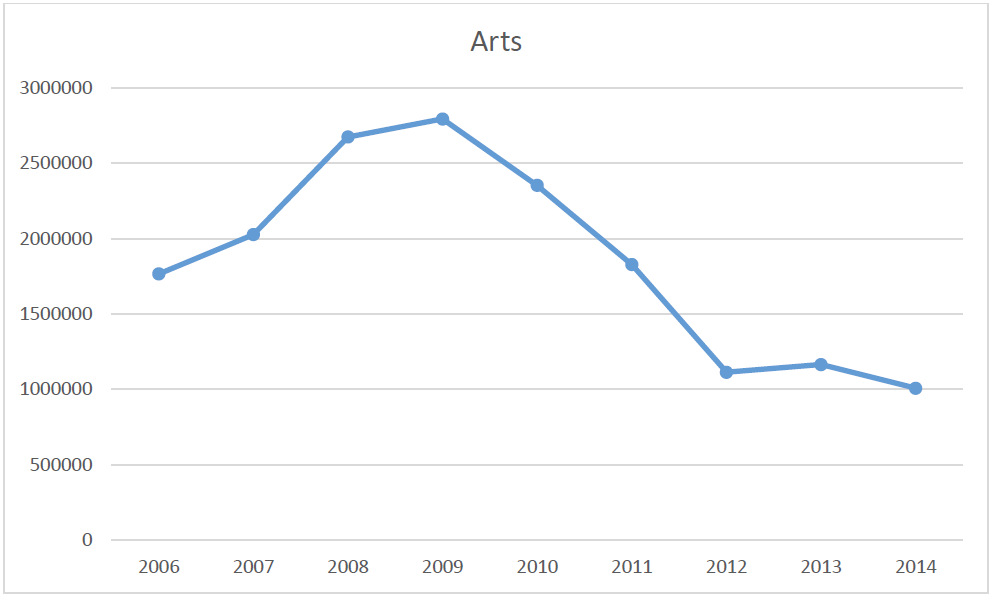
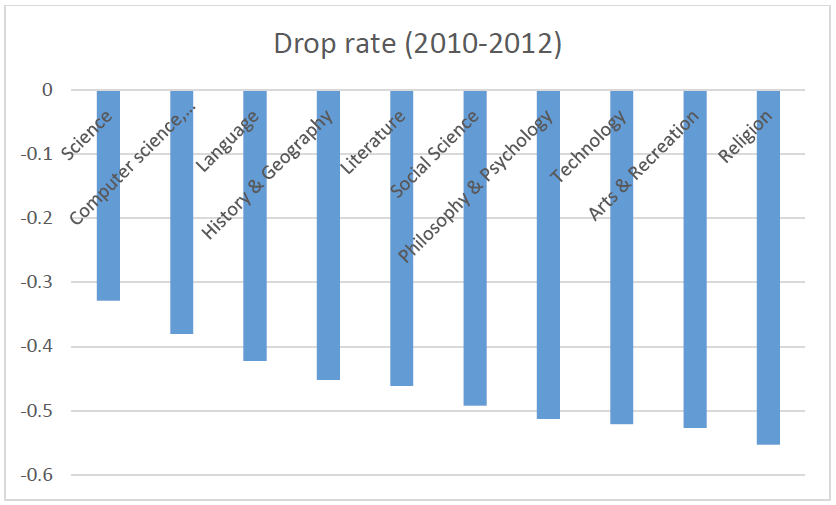
These charts show that the amount of books checked out dropped sharply in all categories between 2010 and 2012.
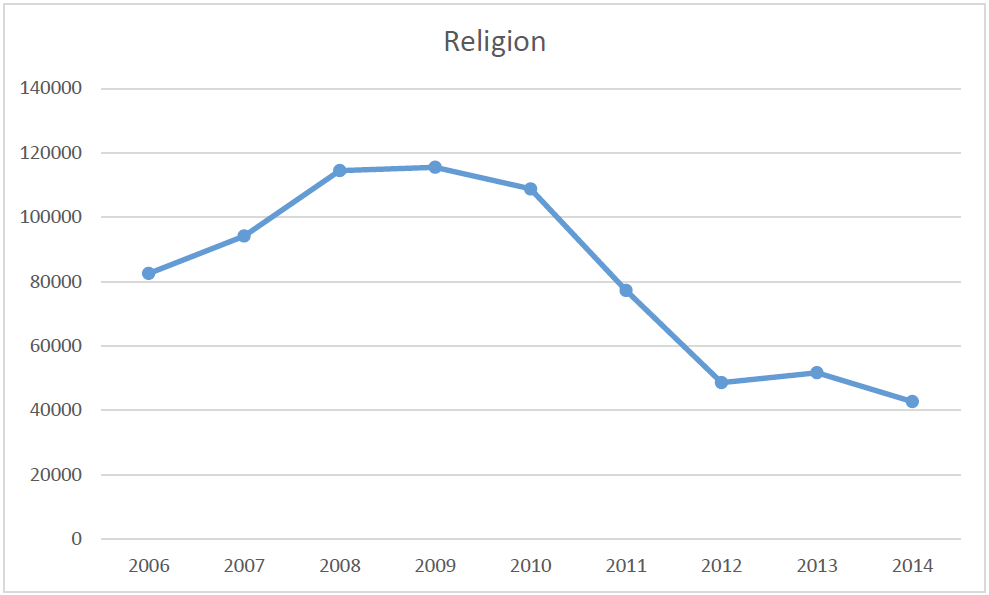

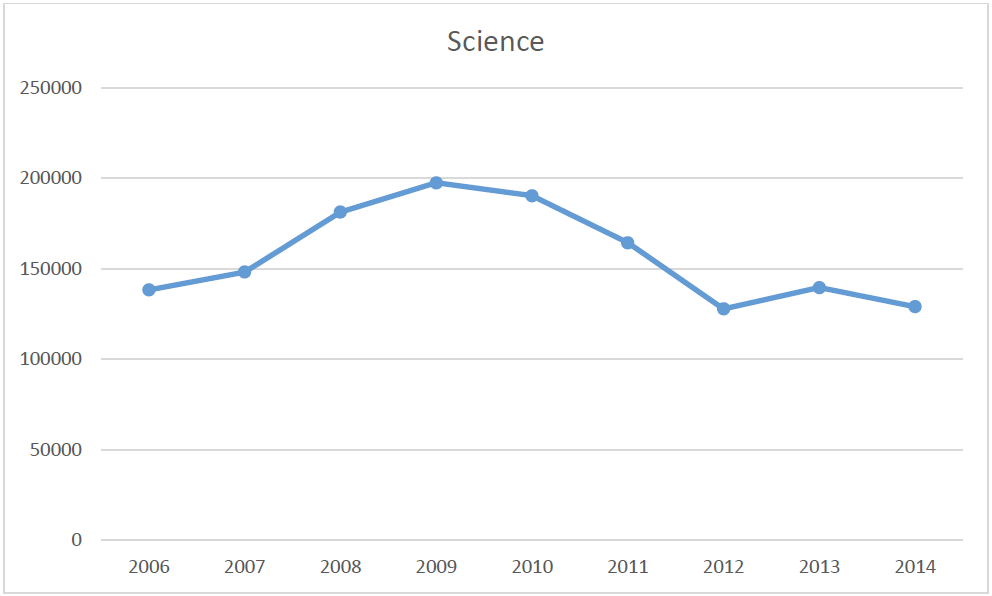
During this two-year period, the drop rate of books checked out in the category of Science remains the least while the rate appears the most in the category of Religion.
During this two-year period, the drop rate of books checked out in the category of Science remains the least while the rate appears the most in the category of Religion.
Final result
The result shows that there were falls in the amount of books checked out after 2010.
Code