When "New" Books Are No Longer New
MAT 259, 2016
Chang HE (Hilda)
Concept
It's a common situation that library buys new books every several months or each year, so does Seattle Public Library. Therefore my idea is to explore the checkout frequencies and popularities of recently bought new books in Seattle Public Library. The interesting question is how does these "new" book attract readers over time? Is it the truth that those new books won't be as popular as they firstly arrived compared with 3 years later?
I was also inspired by the data after I started looking up into SPL database that there might be more interesting patterns if I categorize those new books based on the characteristics of content. So I separated them into fiction books and non-fiction books, and compared them.
I was also inspired by the data after I started looking up into SPL database that there might be more interesting patterns if I categorize those new books based on the characteristics of content. So I separated them into fiction books and non-fiction books, and compared them.
Query
SELECT
    right(callNumber, 4) as versionYear,
    CASE
        WHEN length(deweyClass) > 0 THEN 'non-fiction'
        ELSE 'fiction'
    END as isFiction,
    AVG(TIMESTAMPDIFF(DAY, checkOut, checkIn))  AS 'Average Days',
    SUM(CASE WHEN Year(checkOut) = 2006 THEN 1 ELSE 0 END) AS '2006',
    SUM(CASE WHEN Year(checkOut) = 2007 THEN 1 ELSE 0 END) AS '2007',
    SUM(CASE WHEN Year(checkOut) = 2008 THEN 1 ELSE 0 END) AS '2008',
    SUM(CASE WHEN Year(checkOut) = 2009 THEN 1 ELSE 0 END) AS '2009',
    SUM(CASE WHEN Year(checkOut) = 2010 THEN 1 ELSE 0 END) AS '2010',
    SUM(CASE WHEN Year(checkOut) = 2011 THEN 1 ELSE 0 END) AS '2011',
    SUM(CASE WHEN Year(checkOut) = 2012 THEN 1 ELSE 0 END) AS '2012',
    SUM(CASE WHEN Year(checkOut) = 2013 THEN 1 ELSE 0 END) AS '2013',
    SUM(CASE WHEN Year(checkOut) = 2014 THEN 1 ELSE 0 END) AS '2014',
    SUM(CASE WHEN Year(checkOut) = 2015 THEN 1 ELSE 0 END) AS '2015'
FROM
    spl3._rawXmlDataCheckIns
WHERE
    substring(collectionCode from 3 for 3) = 'new'
    AND right(callNumber, 4) > 2005
    AND right(callNumber, 4) < 2016
    AND itemType = 'acbk'
    AND checkOut != "1970-01-01 00:00:00"
GROUP BY versionYear , isFiction
ORDER BY versionYear , isFiction
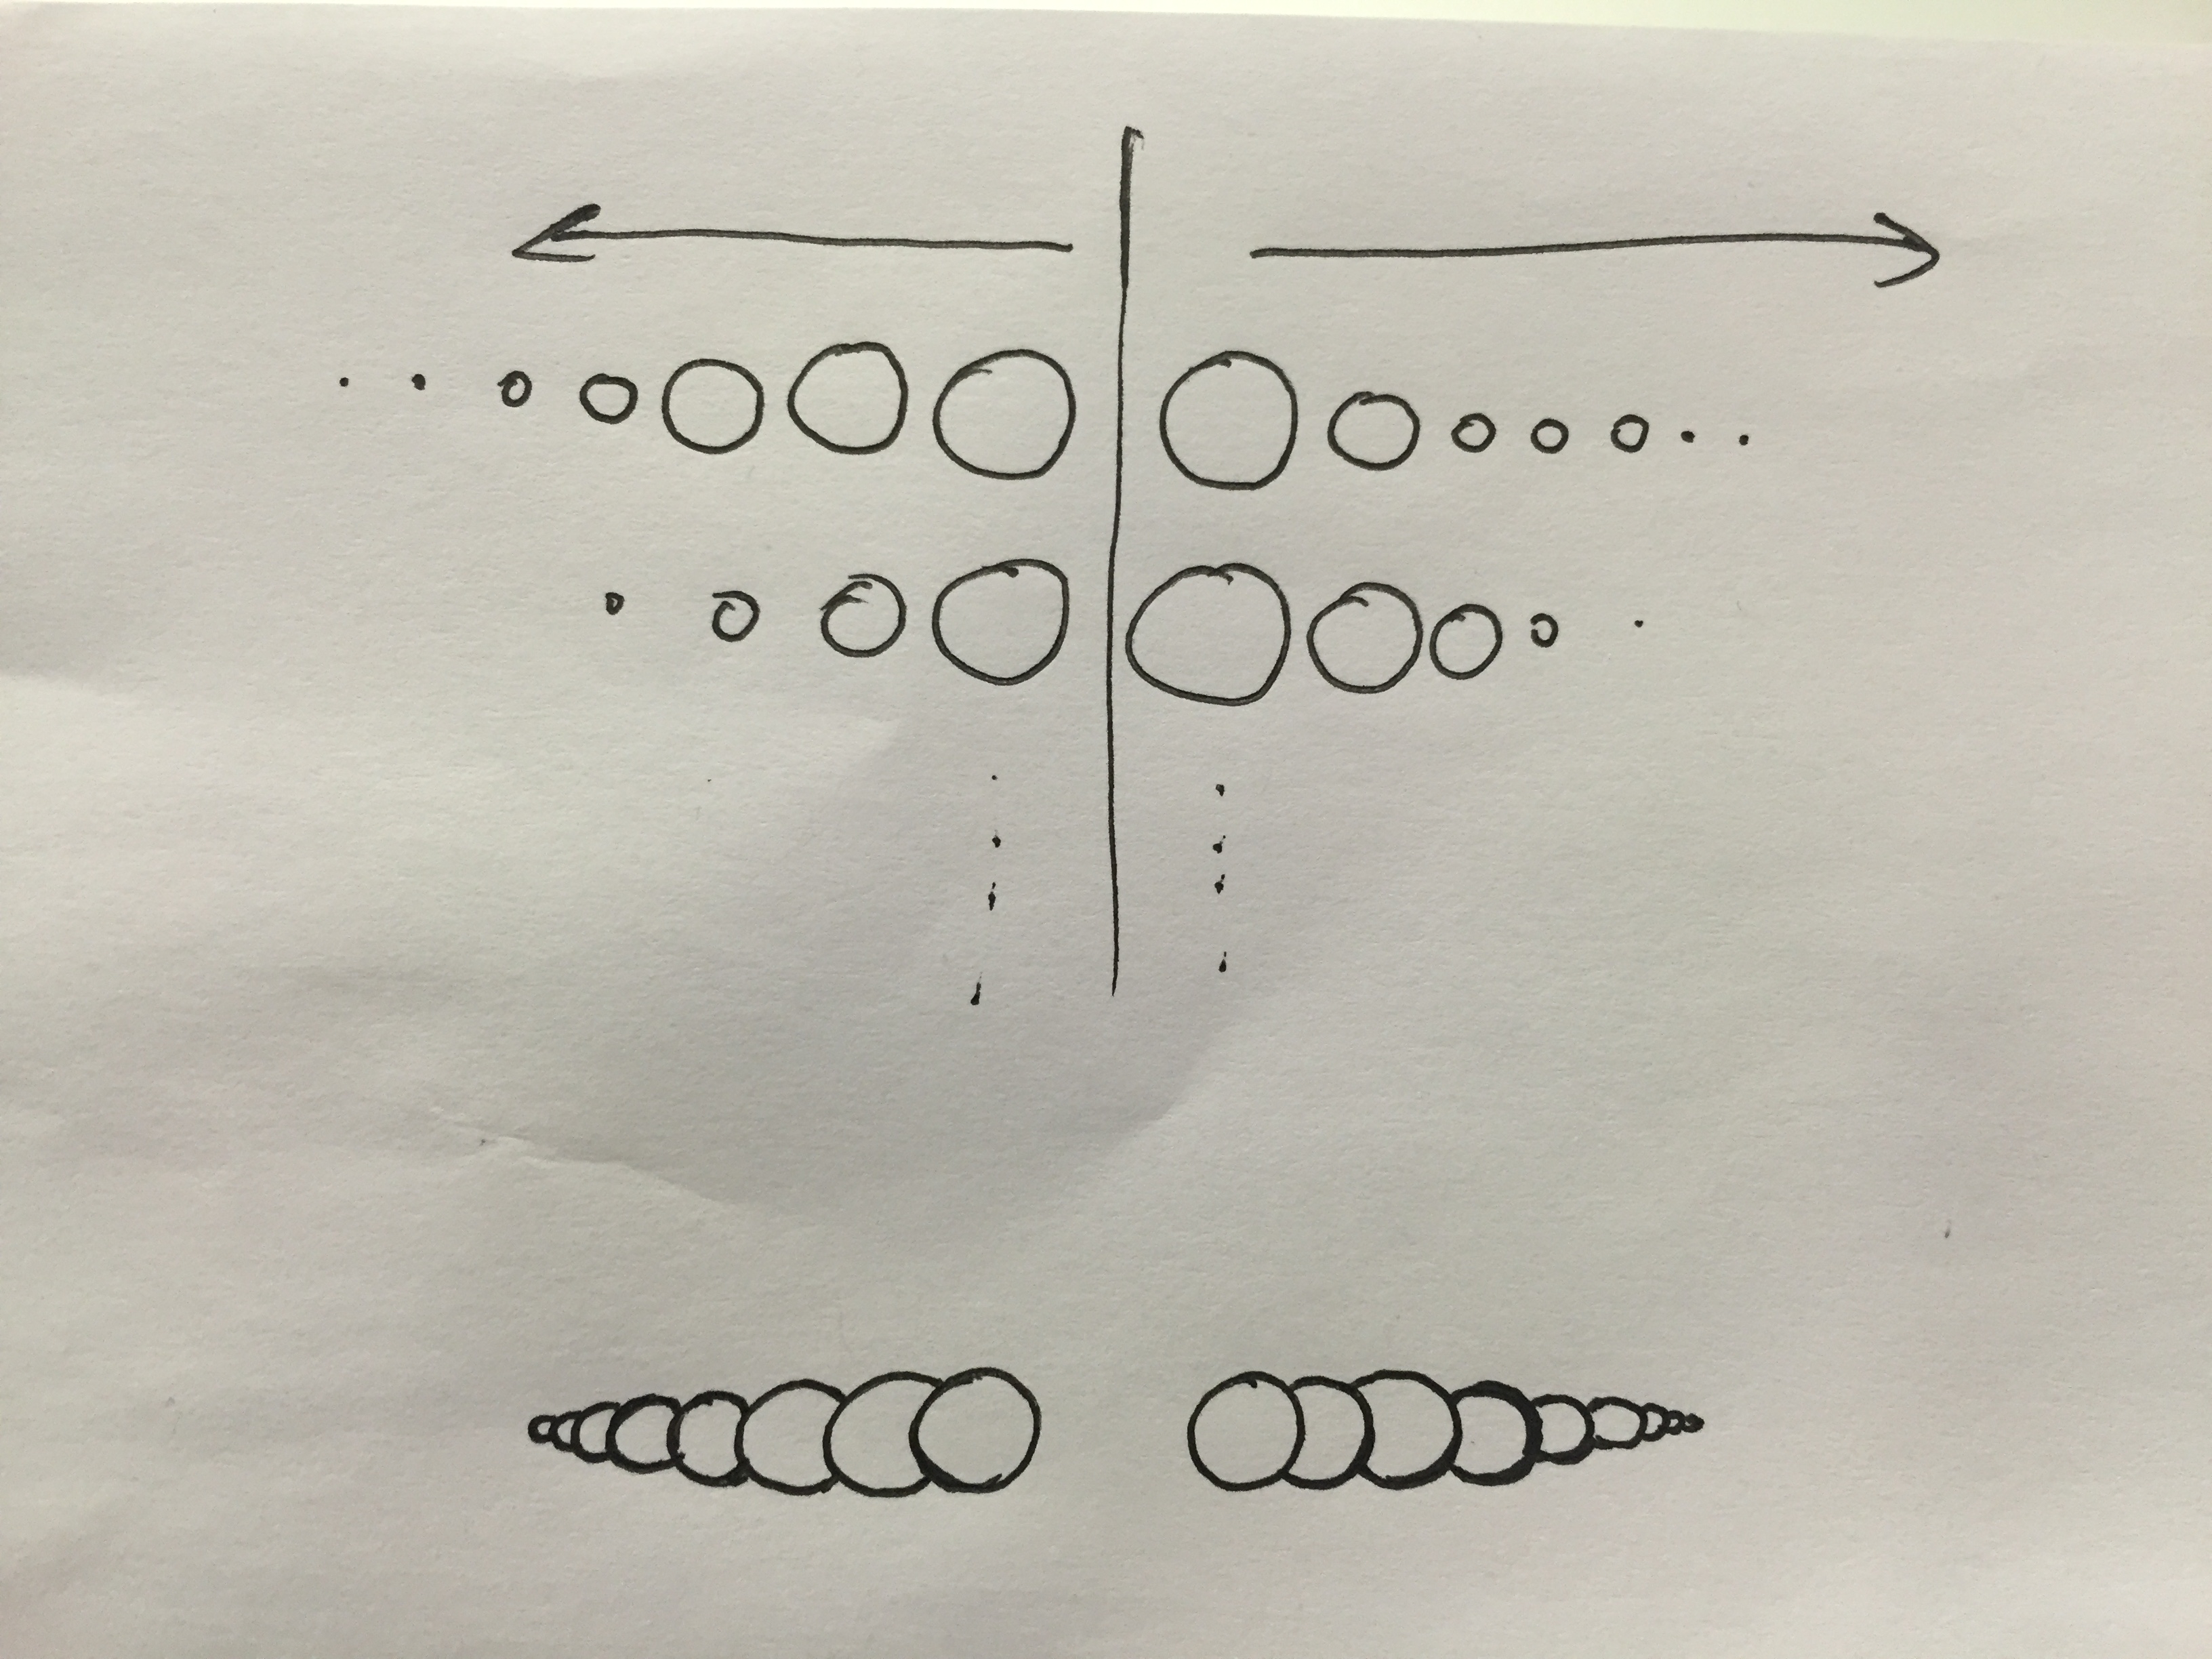
Preliminary sketches
I came up with these two similar designs. Previously I chose the lower one to implement. However, the outcome was not as expected. So I switched to the upper design.
Process
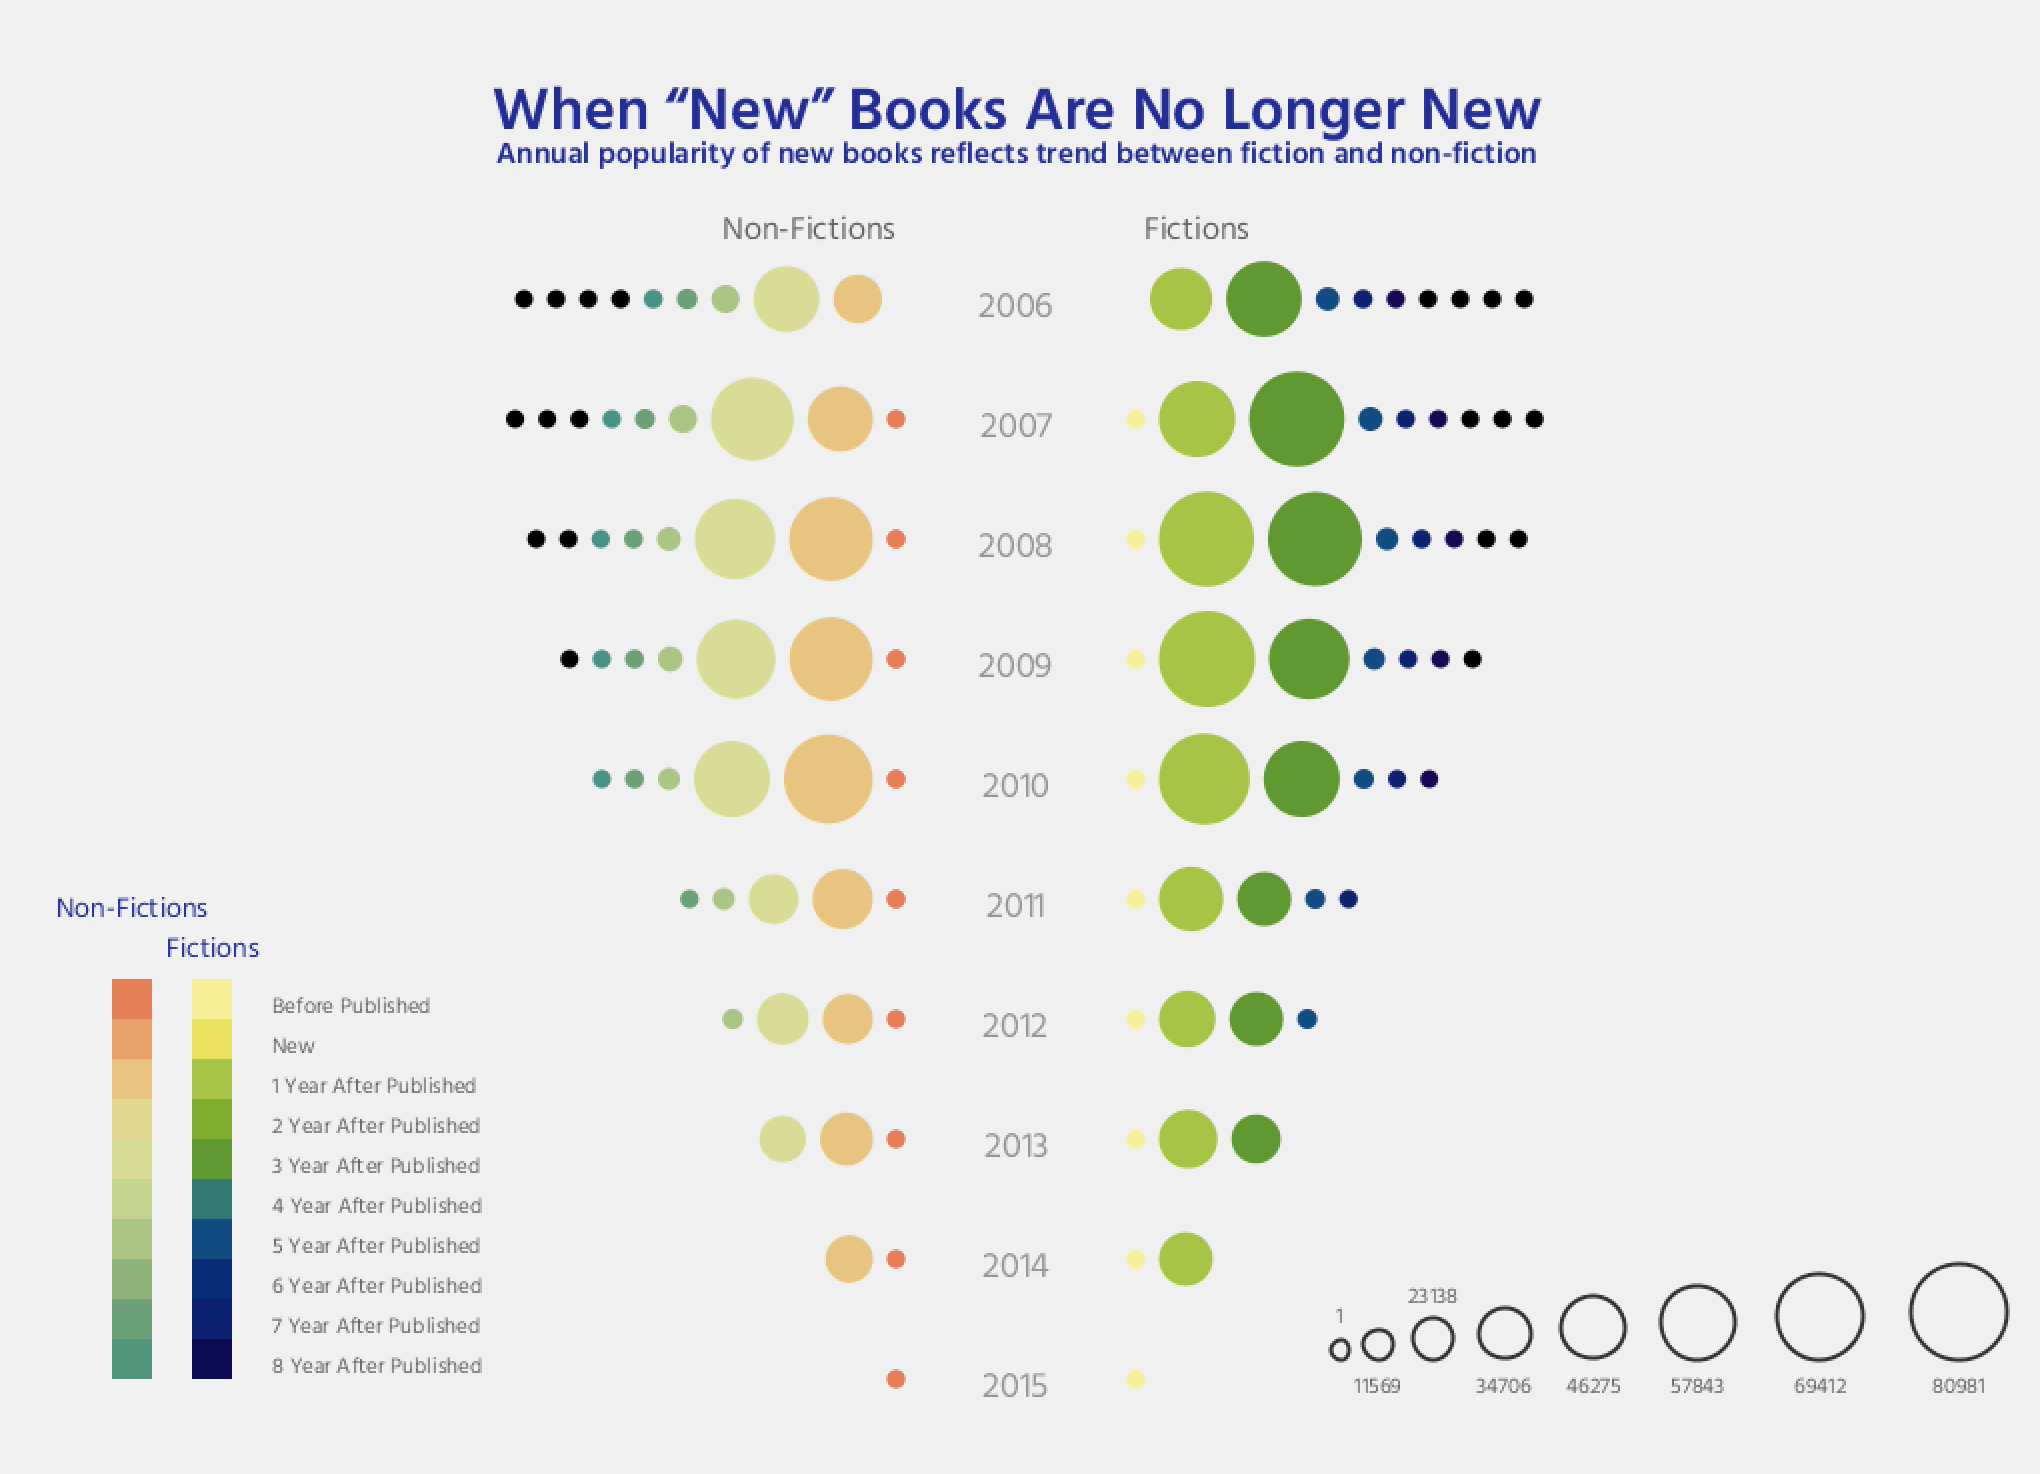
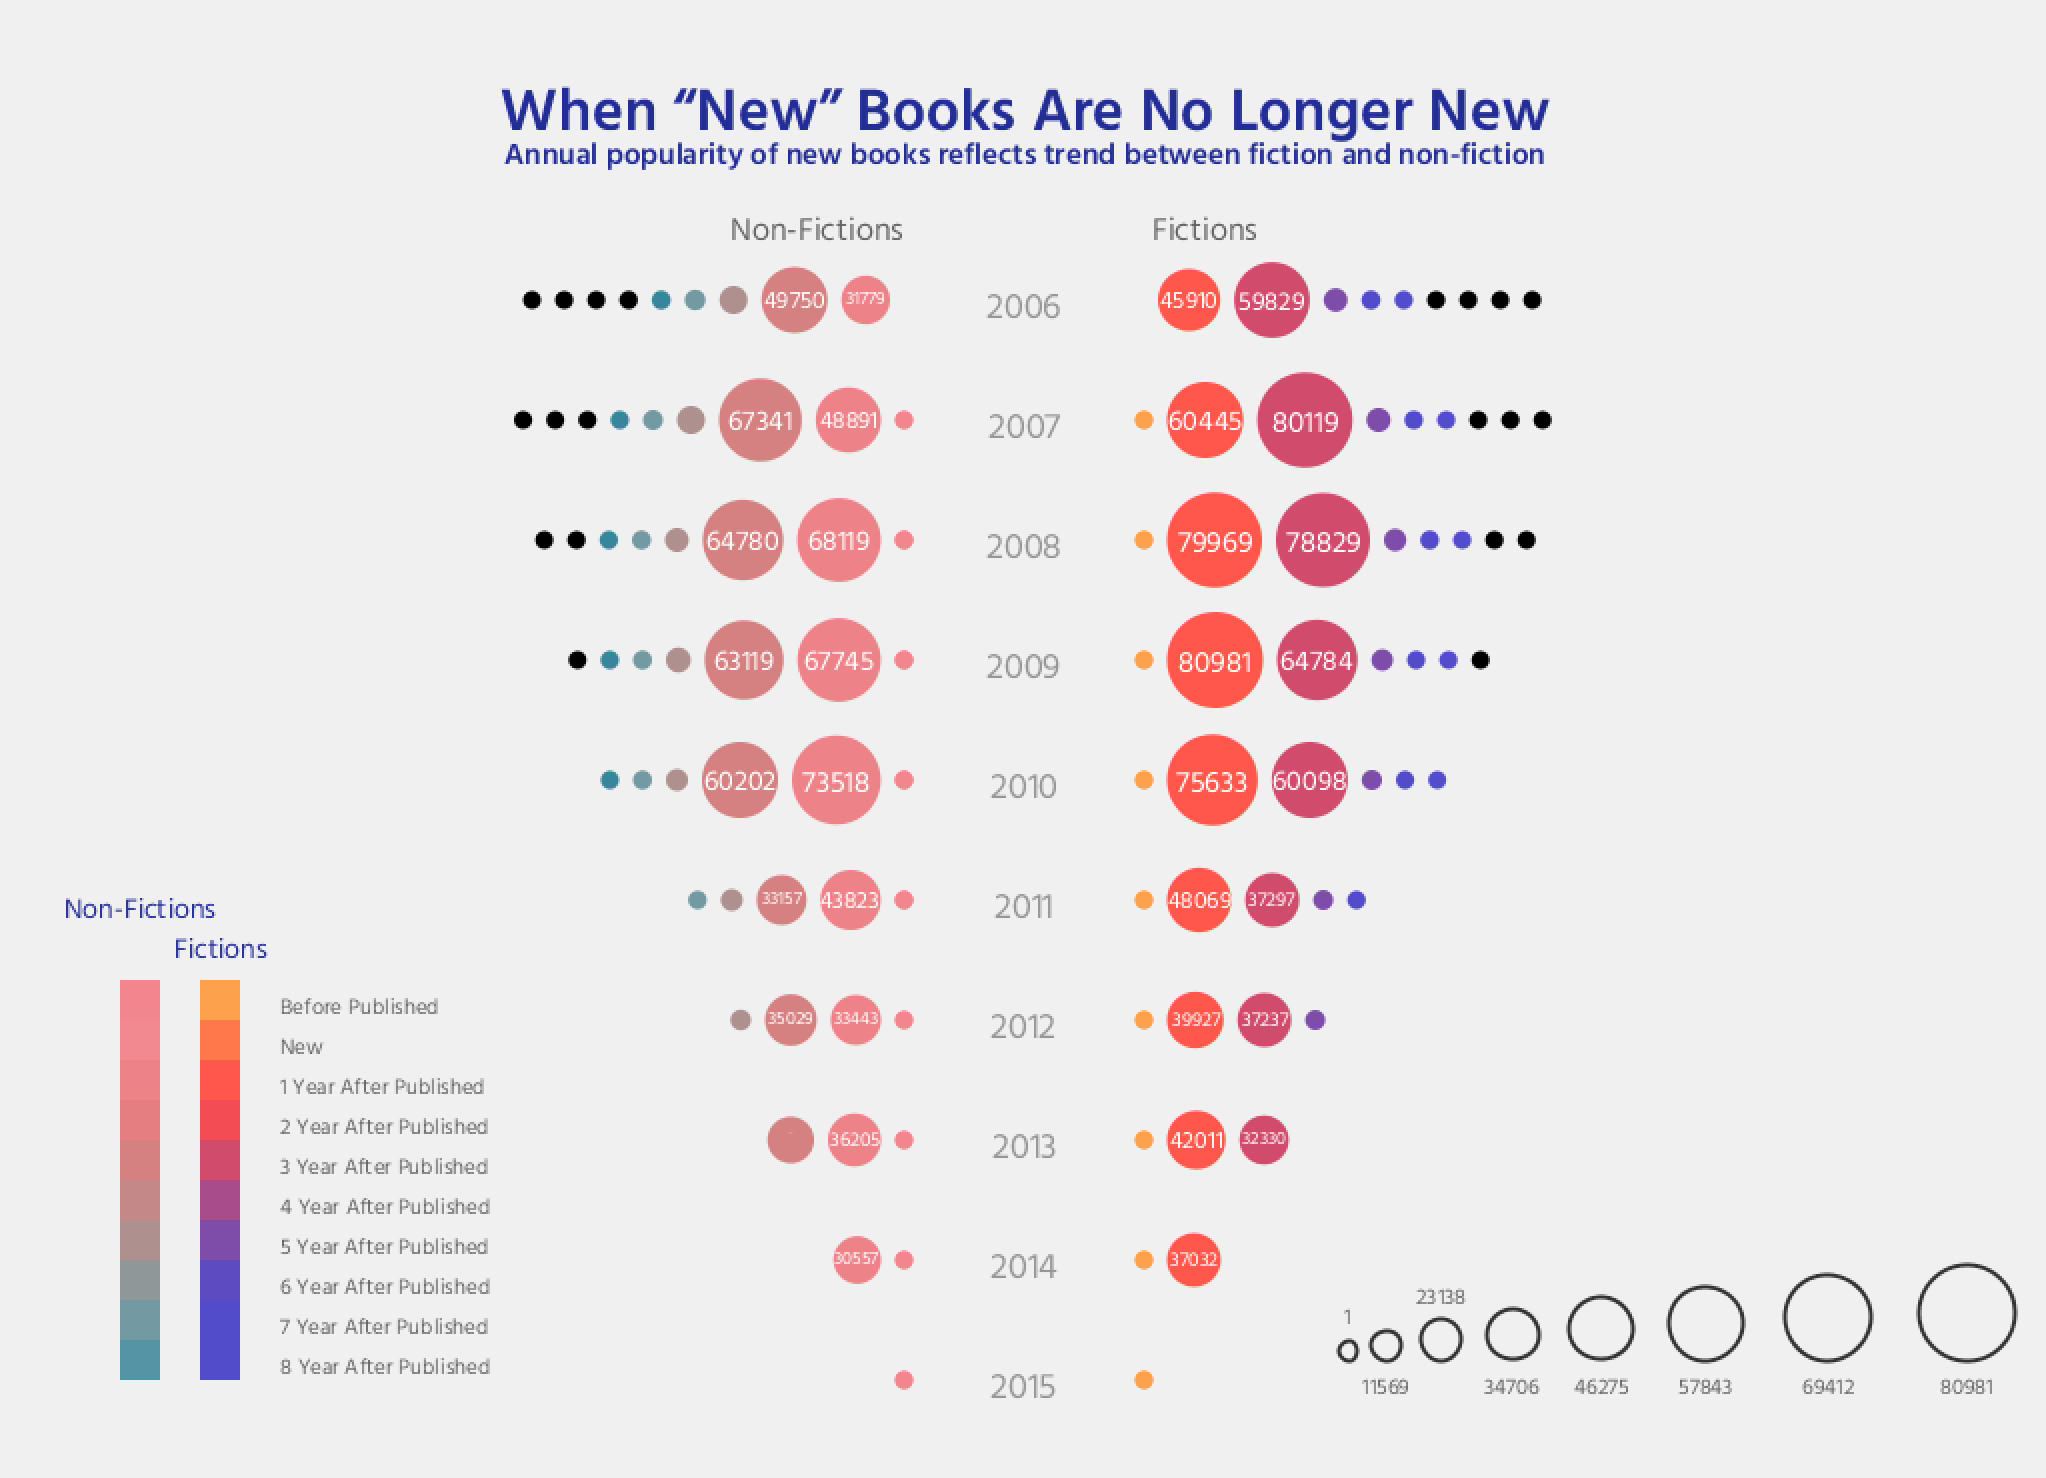
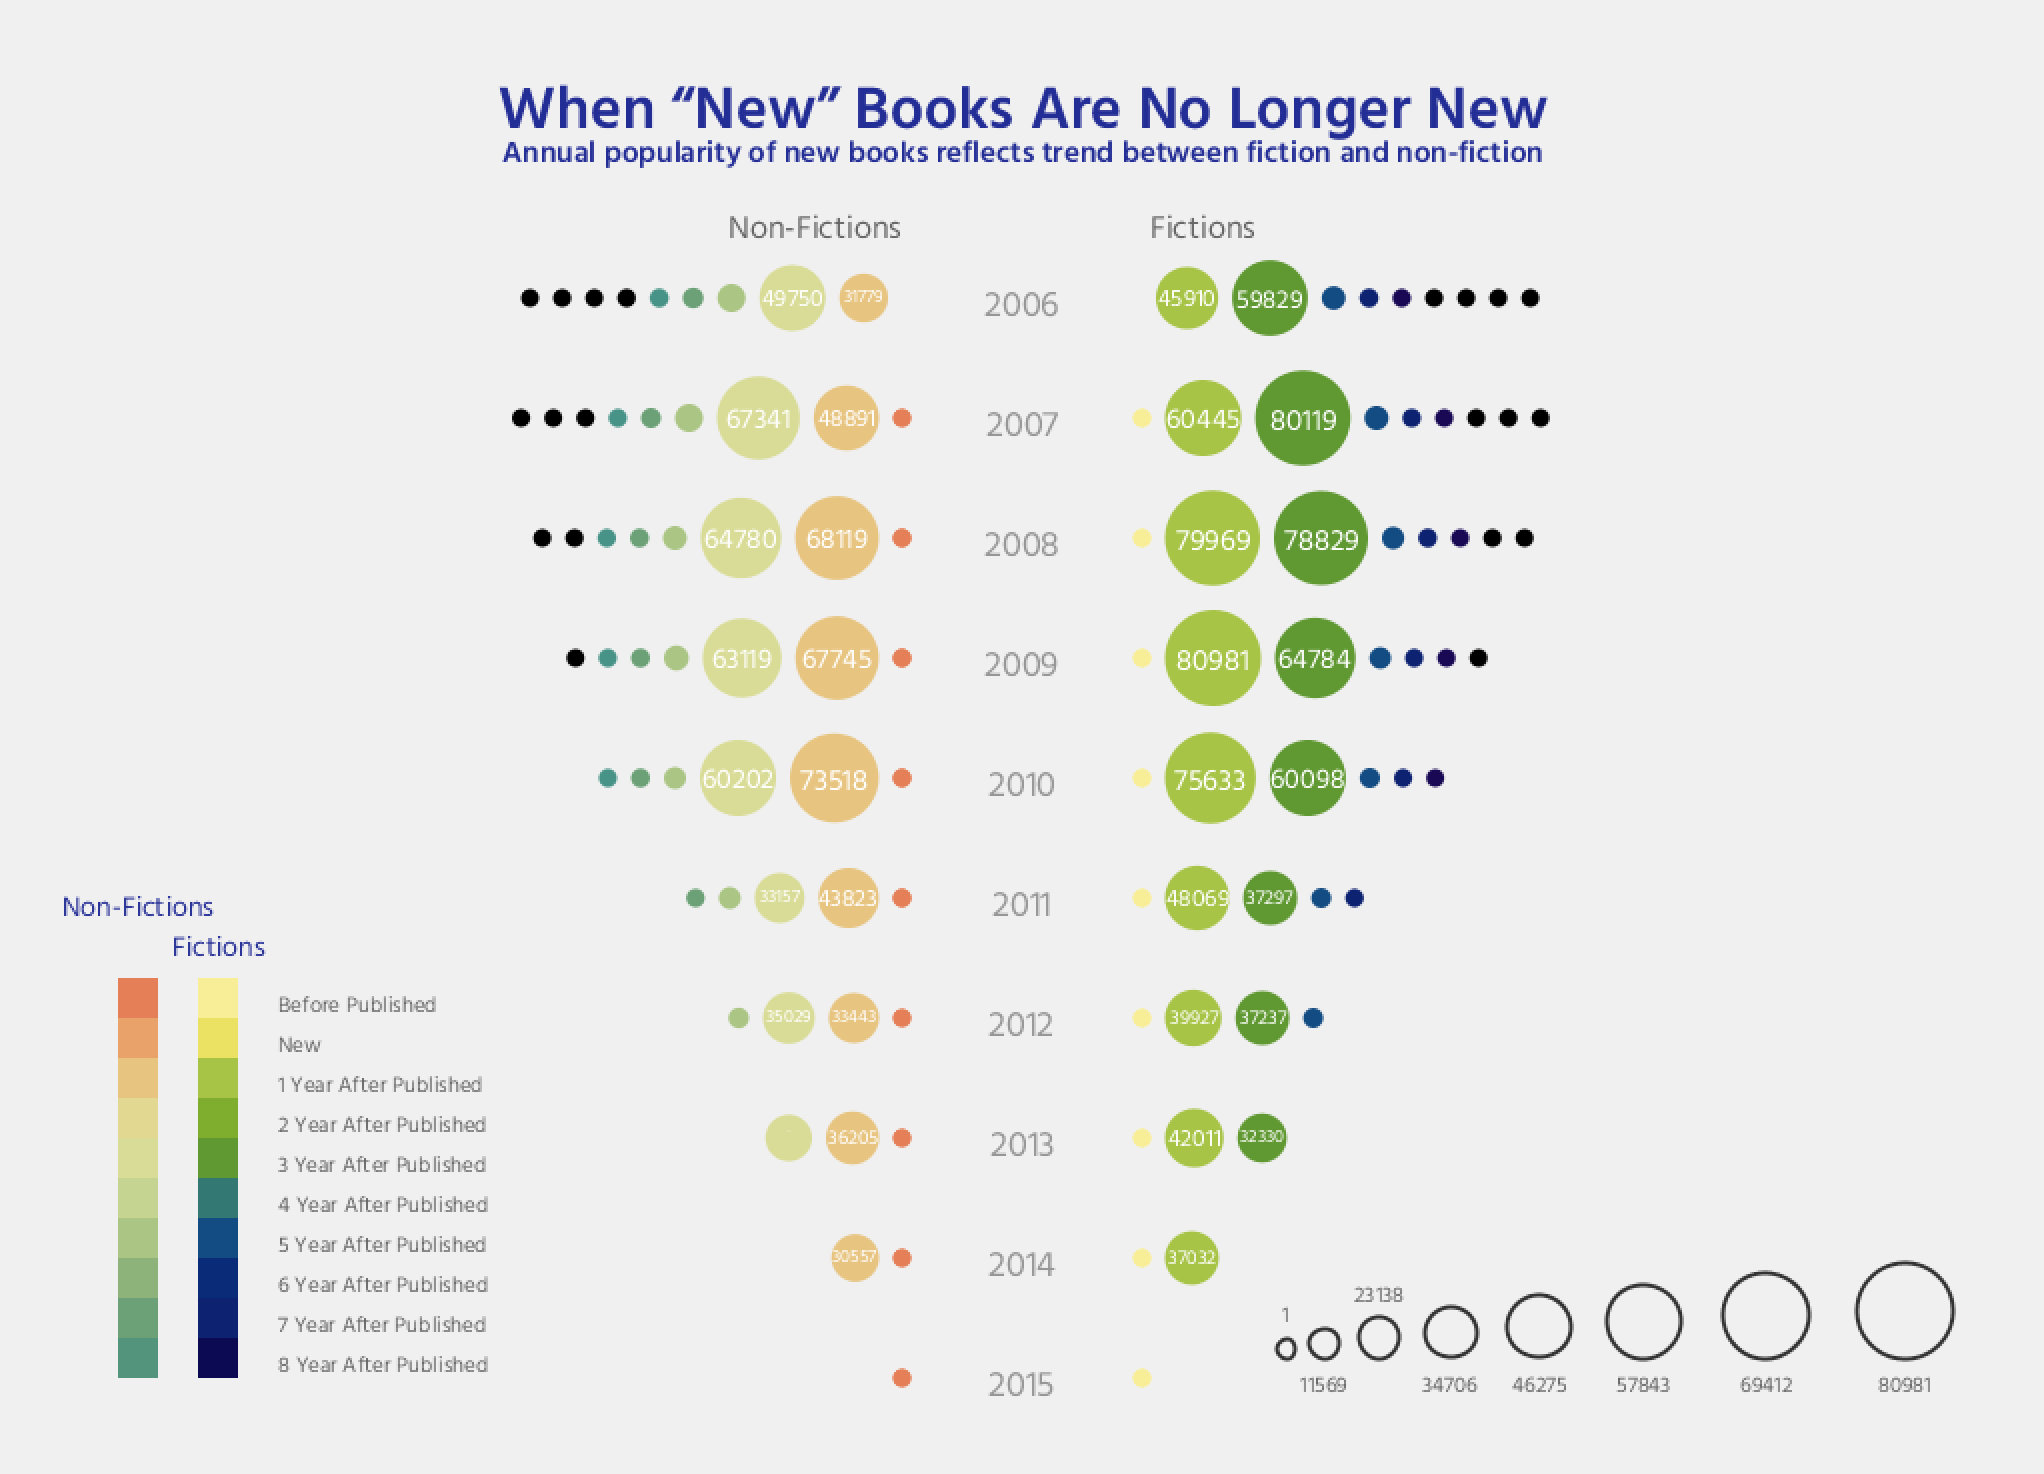
My objectives of visualizing these data are frankly straight forward and concise. I want to compare the non-fiction books with fictions, so I make the graph symmetric. The number of annual checkouts determine how big each circle is, which can reveal the trend in a more fairshaped way. Colors show how many years passed after these books were published. I also chose a font I think was appropriate with this theme instead using the default font in processing. Key 'N' is available to be pressed to interact with this visualization by showing exact numbers or hide them.
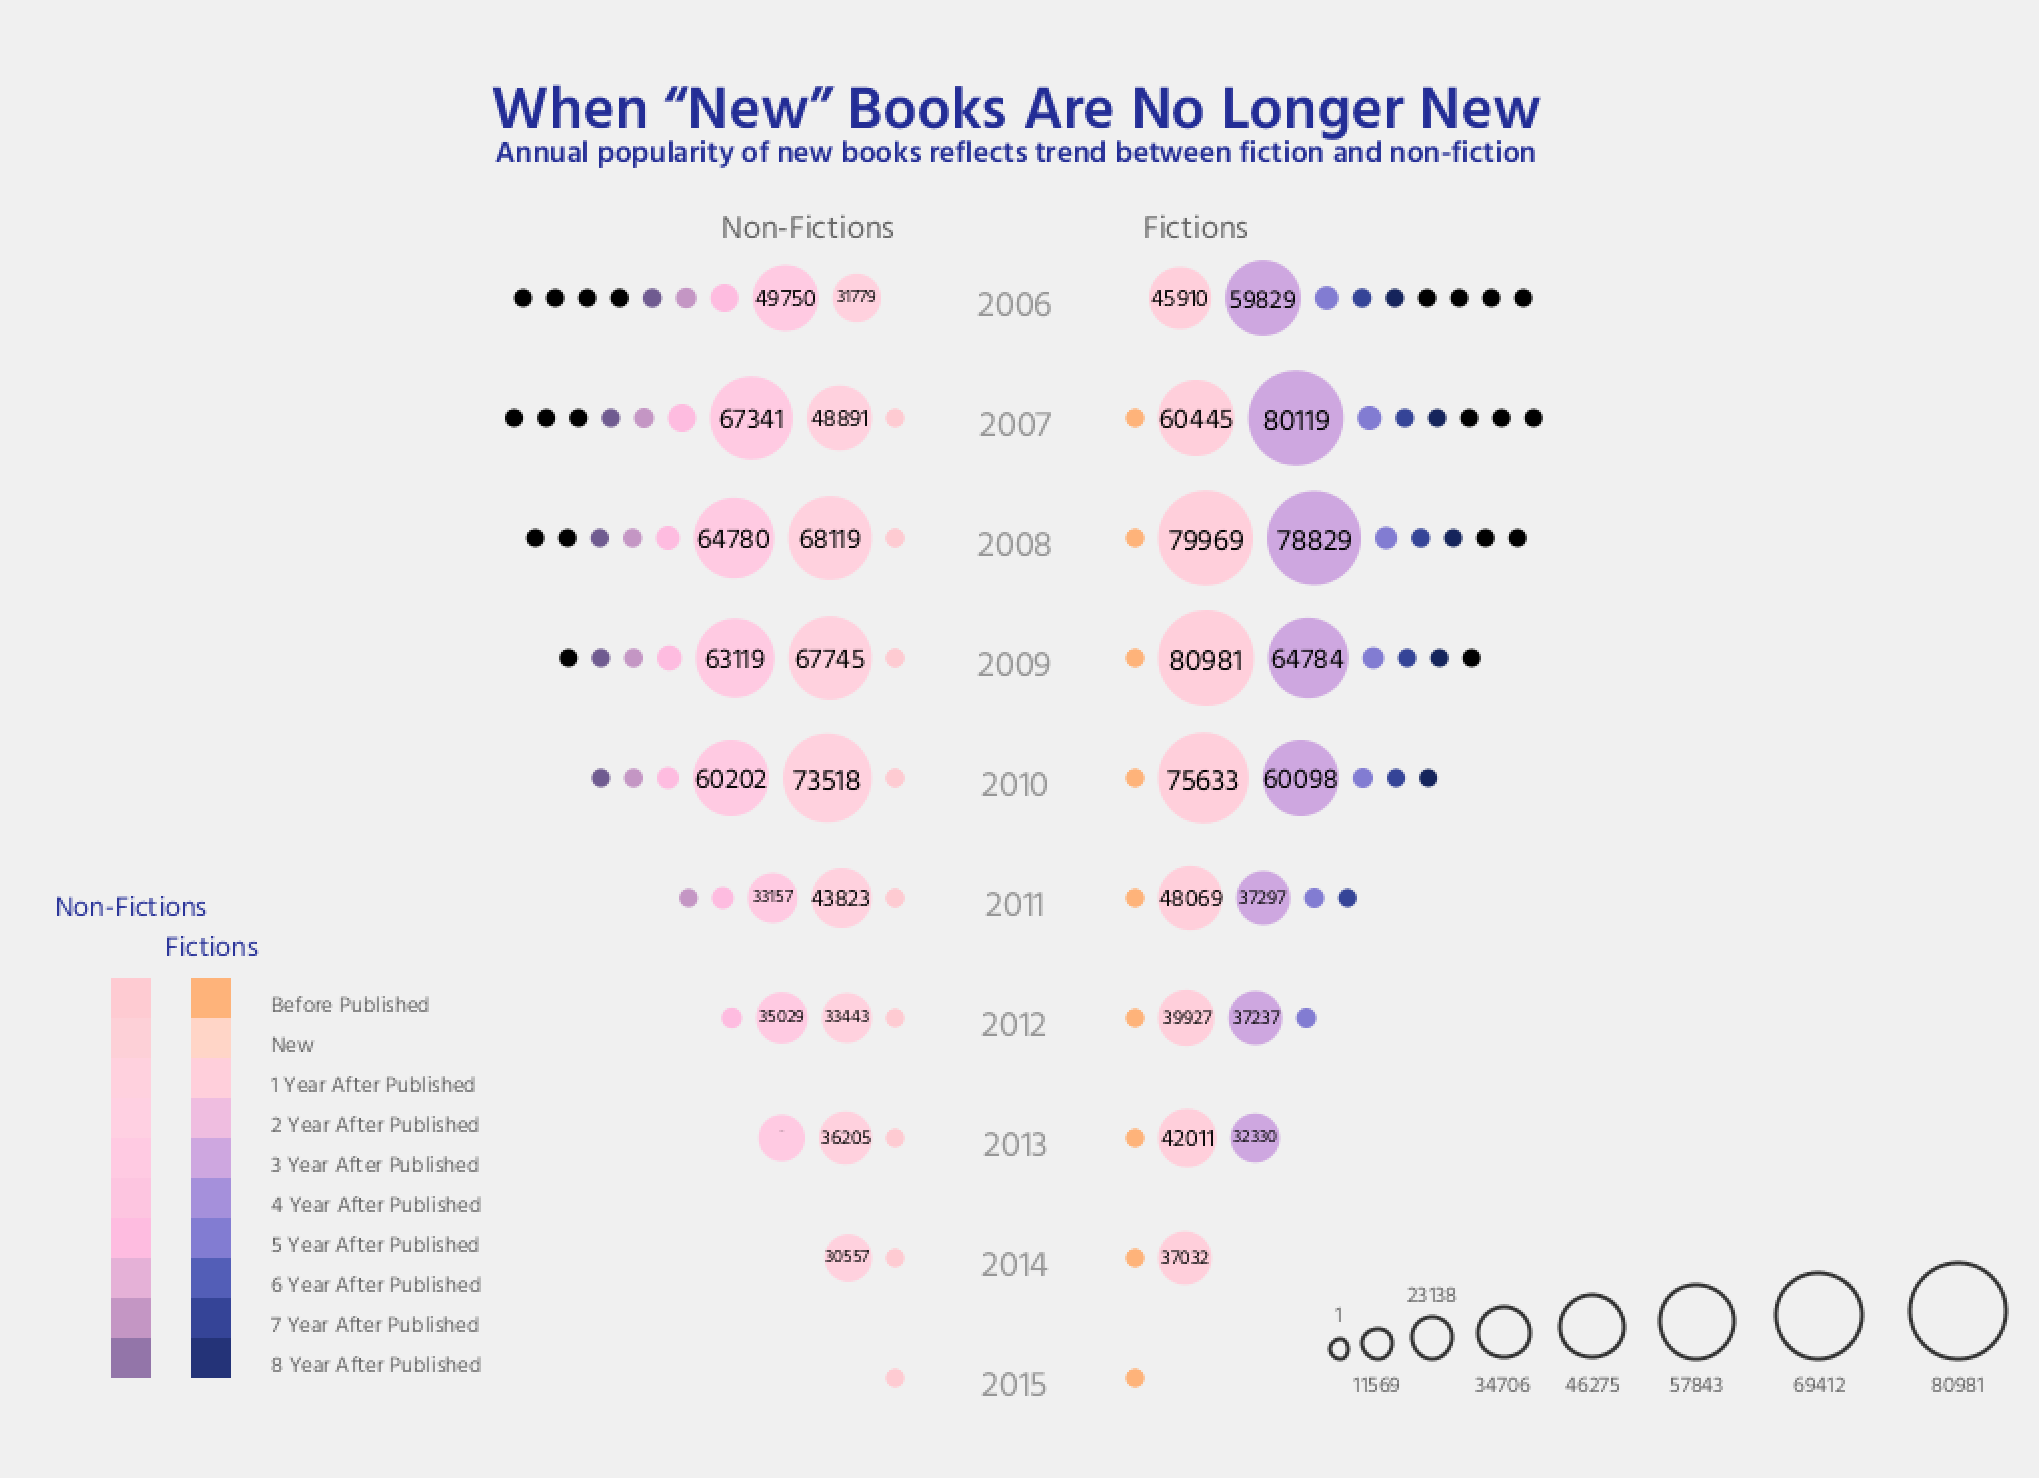
Additionally, I load several color maps, so user can interact with this visualization by pressing 1, 2 or 3. User can choose to watch theis data visualization from their prefered color. Three colorbars are listed below.
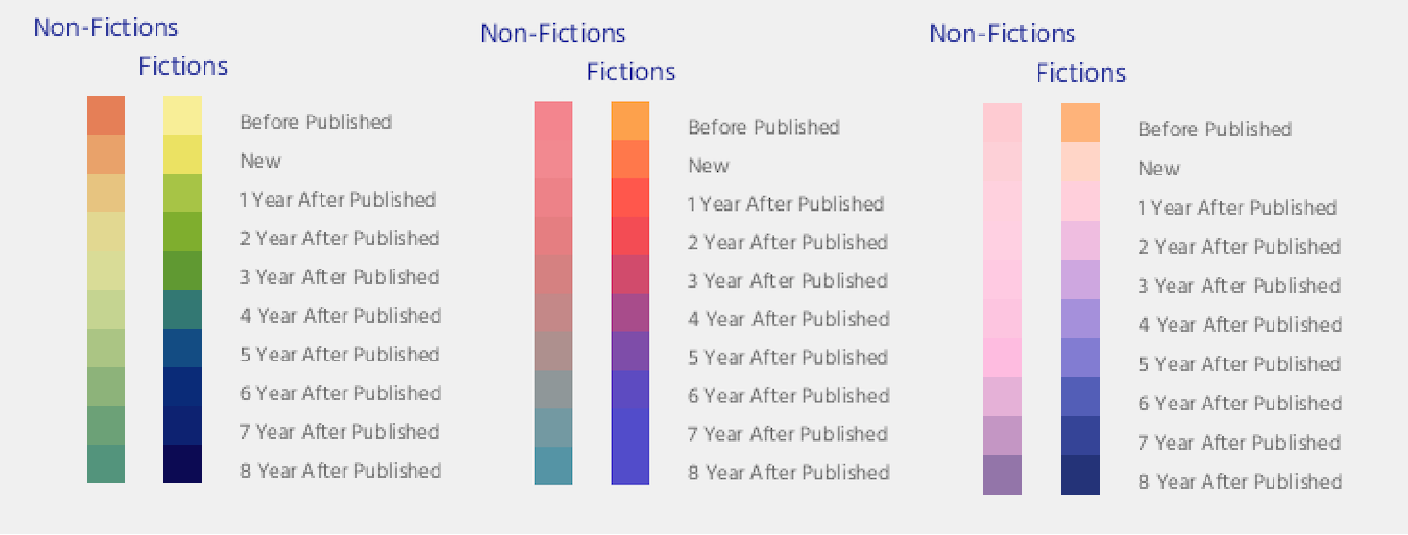
Additionally, I load several color maps, so user can interact with this visualization by pressing 1, 2 or 3. User can choose to watch theis data visualization from their prefered color. Three colorbars are listed below.
Final result
The visualization shown three interesting patterns:
1. The new books were much more popular in the first 2 years than the following years.
2. Comparing to non-fiction books, new fiction items were more popular among readers.
3. The dramatic drop of people's interest in fictions were more obvious and severe than non-fictions.
And we can also make three possible hypothesis by looking at my 2D visualtion project:
1. Library might have changed their promothion trategy or loan limitaton at the end of 2007 so that people have more interests to borrow new books within the first year when the books are published.
2. It looks like the library bought less new books every year after 2010 because the checkout numbers are obviously redused by a third.
3. Library might have special previleges so they could buy books even before they are published. Therefore the visualization shows small amount of checkouts before the book's publication year.
Code