Countries - 3D Interactive Visualization
MAT 259, 2015
Rodger (Jieliang) Luo
Concept
This data visualization examines the popularities and classifications of the books with the title including one the following countries: America, China, Germany, India, Korea, and Mexico. Another goal of the project is trying to push the boundary of 3D data visualization to make it not just visually interesting, but also can present more information than 2D data visualization.
Query
SELECT
keyword,
title,
itemCount AS Copies,
checkOutCount,
deweyClass
FROM
spl3.x_keyword,
spl3.title,
spl3.x_oneBibManyItem,
spl3.deweyClass,
spl3.x_checkOutCountBib
WHERE
(keyword = 'china' OR keyword = 'korea'
OR keyword = 'america'
OR keyword = 'mexico'
OR keyword = 'germany'
OR keyword = 'india')
AND x_keyword.bibNumber = title.bibNumber
AND x_keyword.bibNumber = x_oneBibManyItem.bibNumber
AND x_keyword.bibNumber = deweyClass.bibNumber
AND x_keyword.bibNumber = x_checkOutCountBib.bibNumber
AND deweyClass > 0
AND checkOutCount > 100
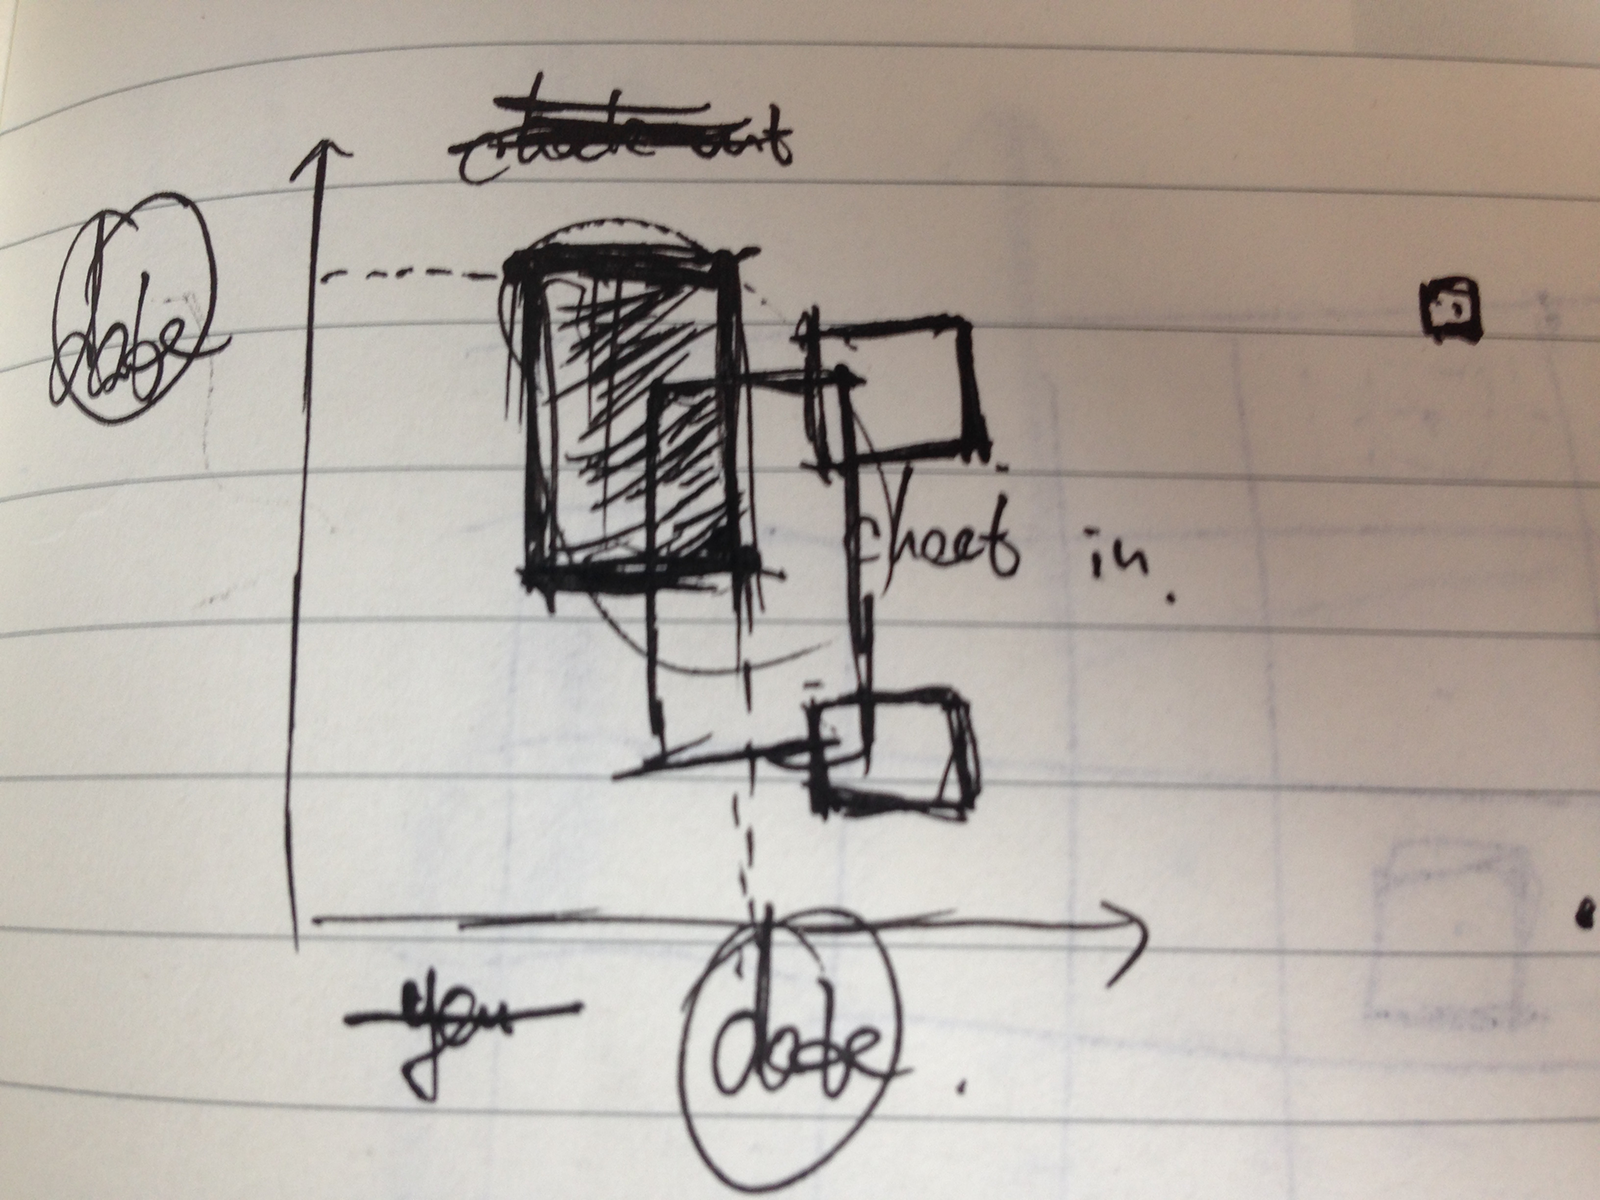
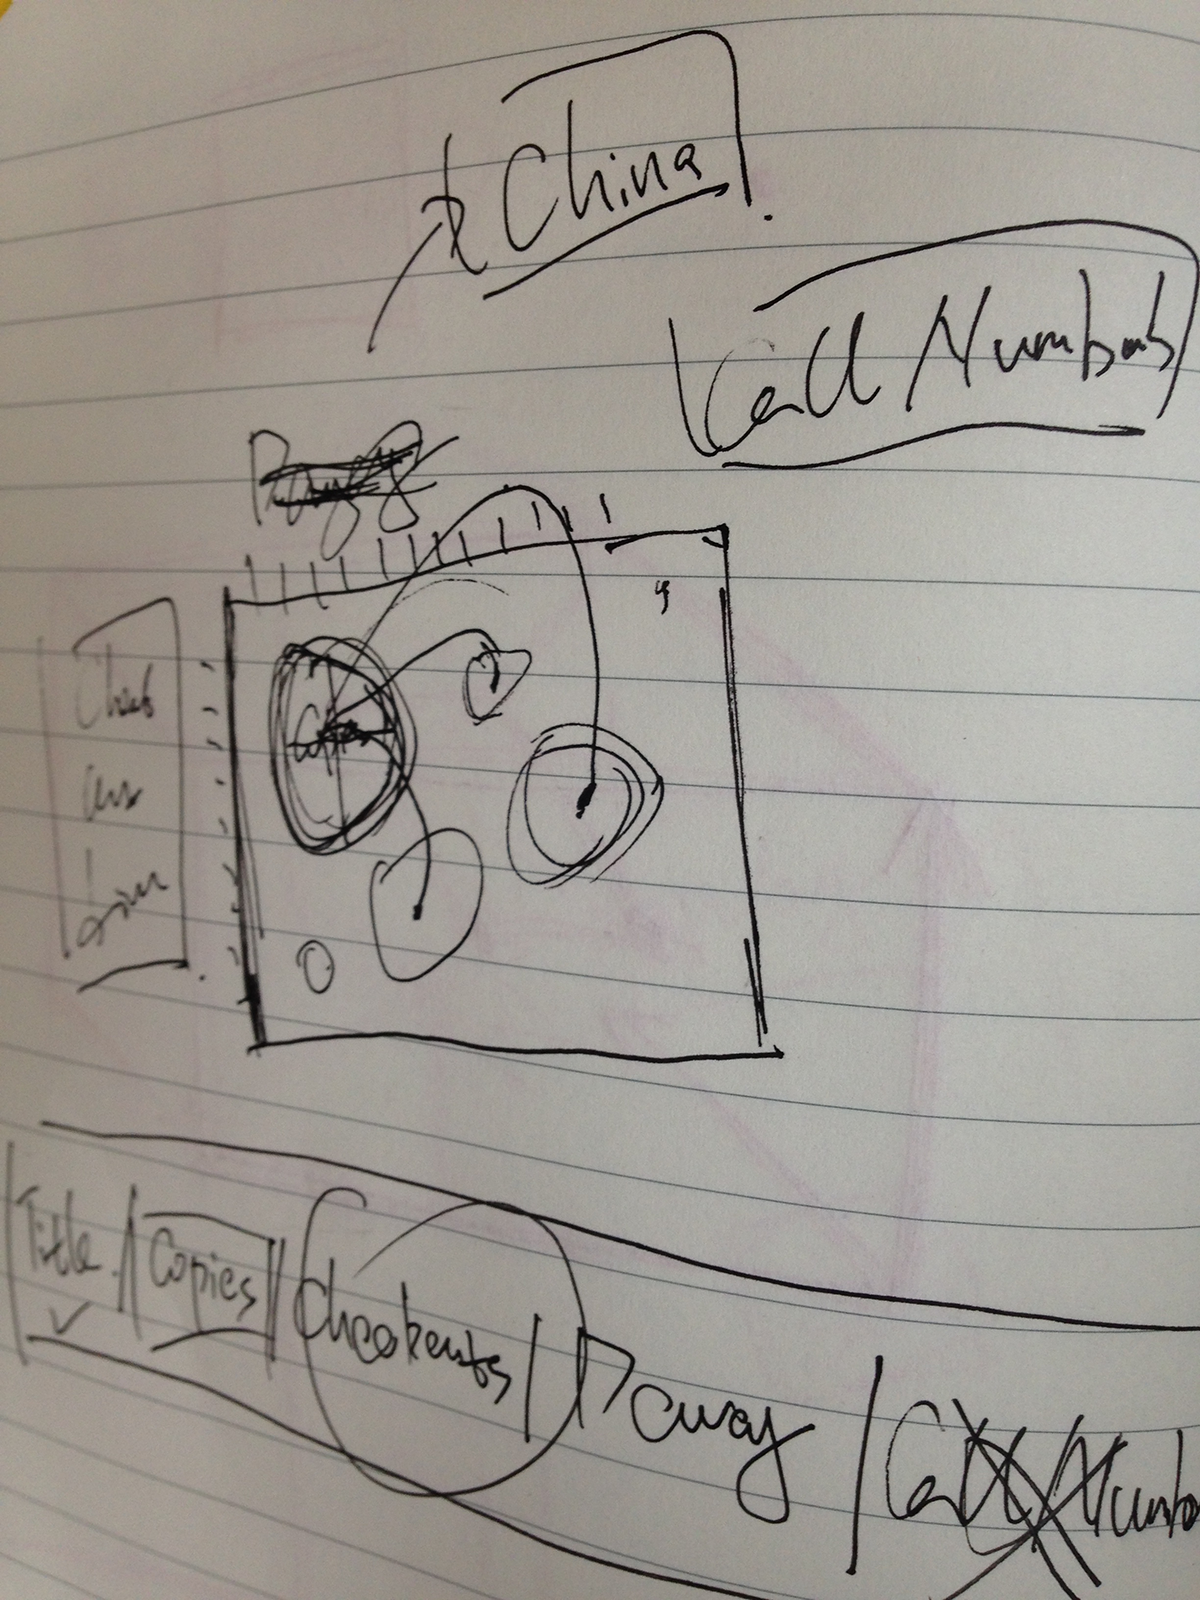
Preliminary sketches
With an interactive 3D data visualization, the challenge is how to use space and different dimensions to present different perspectives of the dataset. Hence, this project is more experimental than my previous projects, as I don’t really know what the final output will look like.
Process
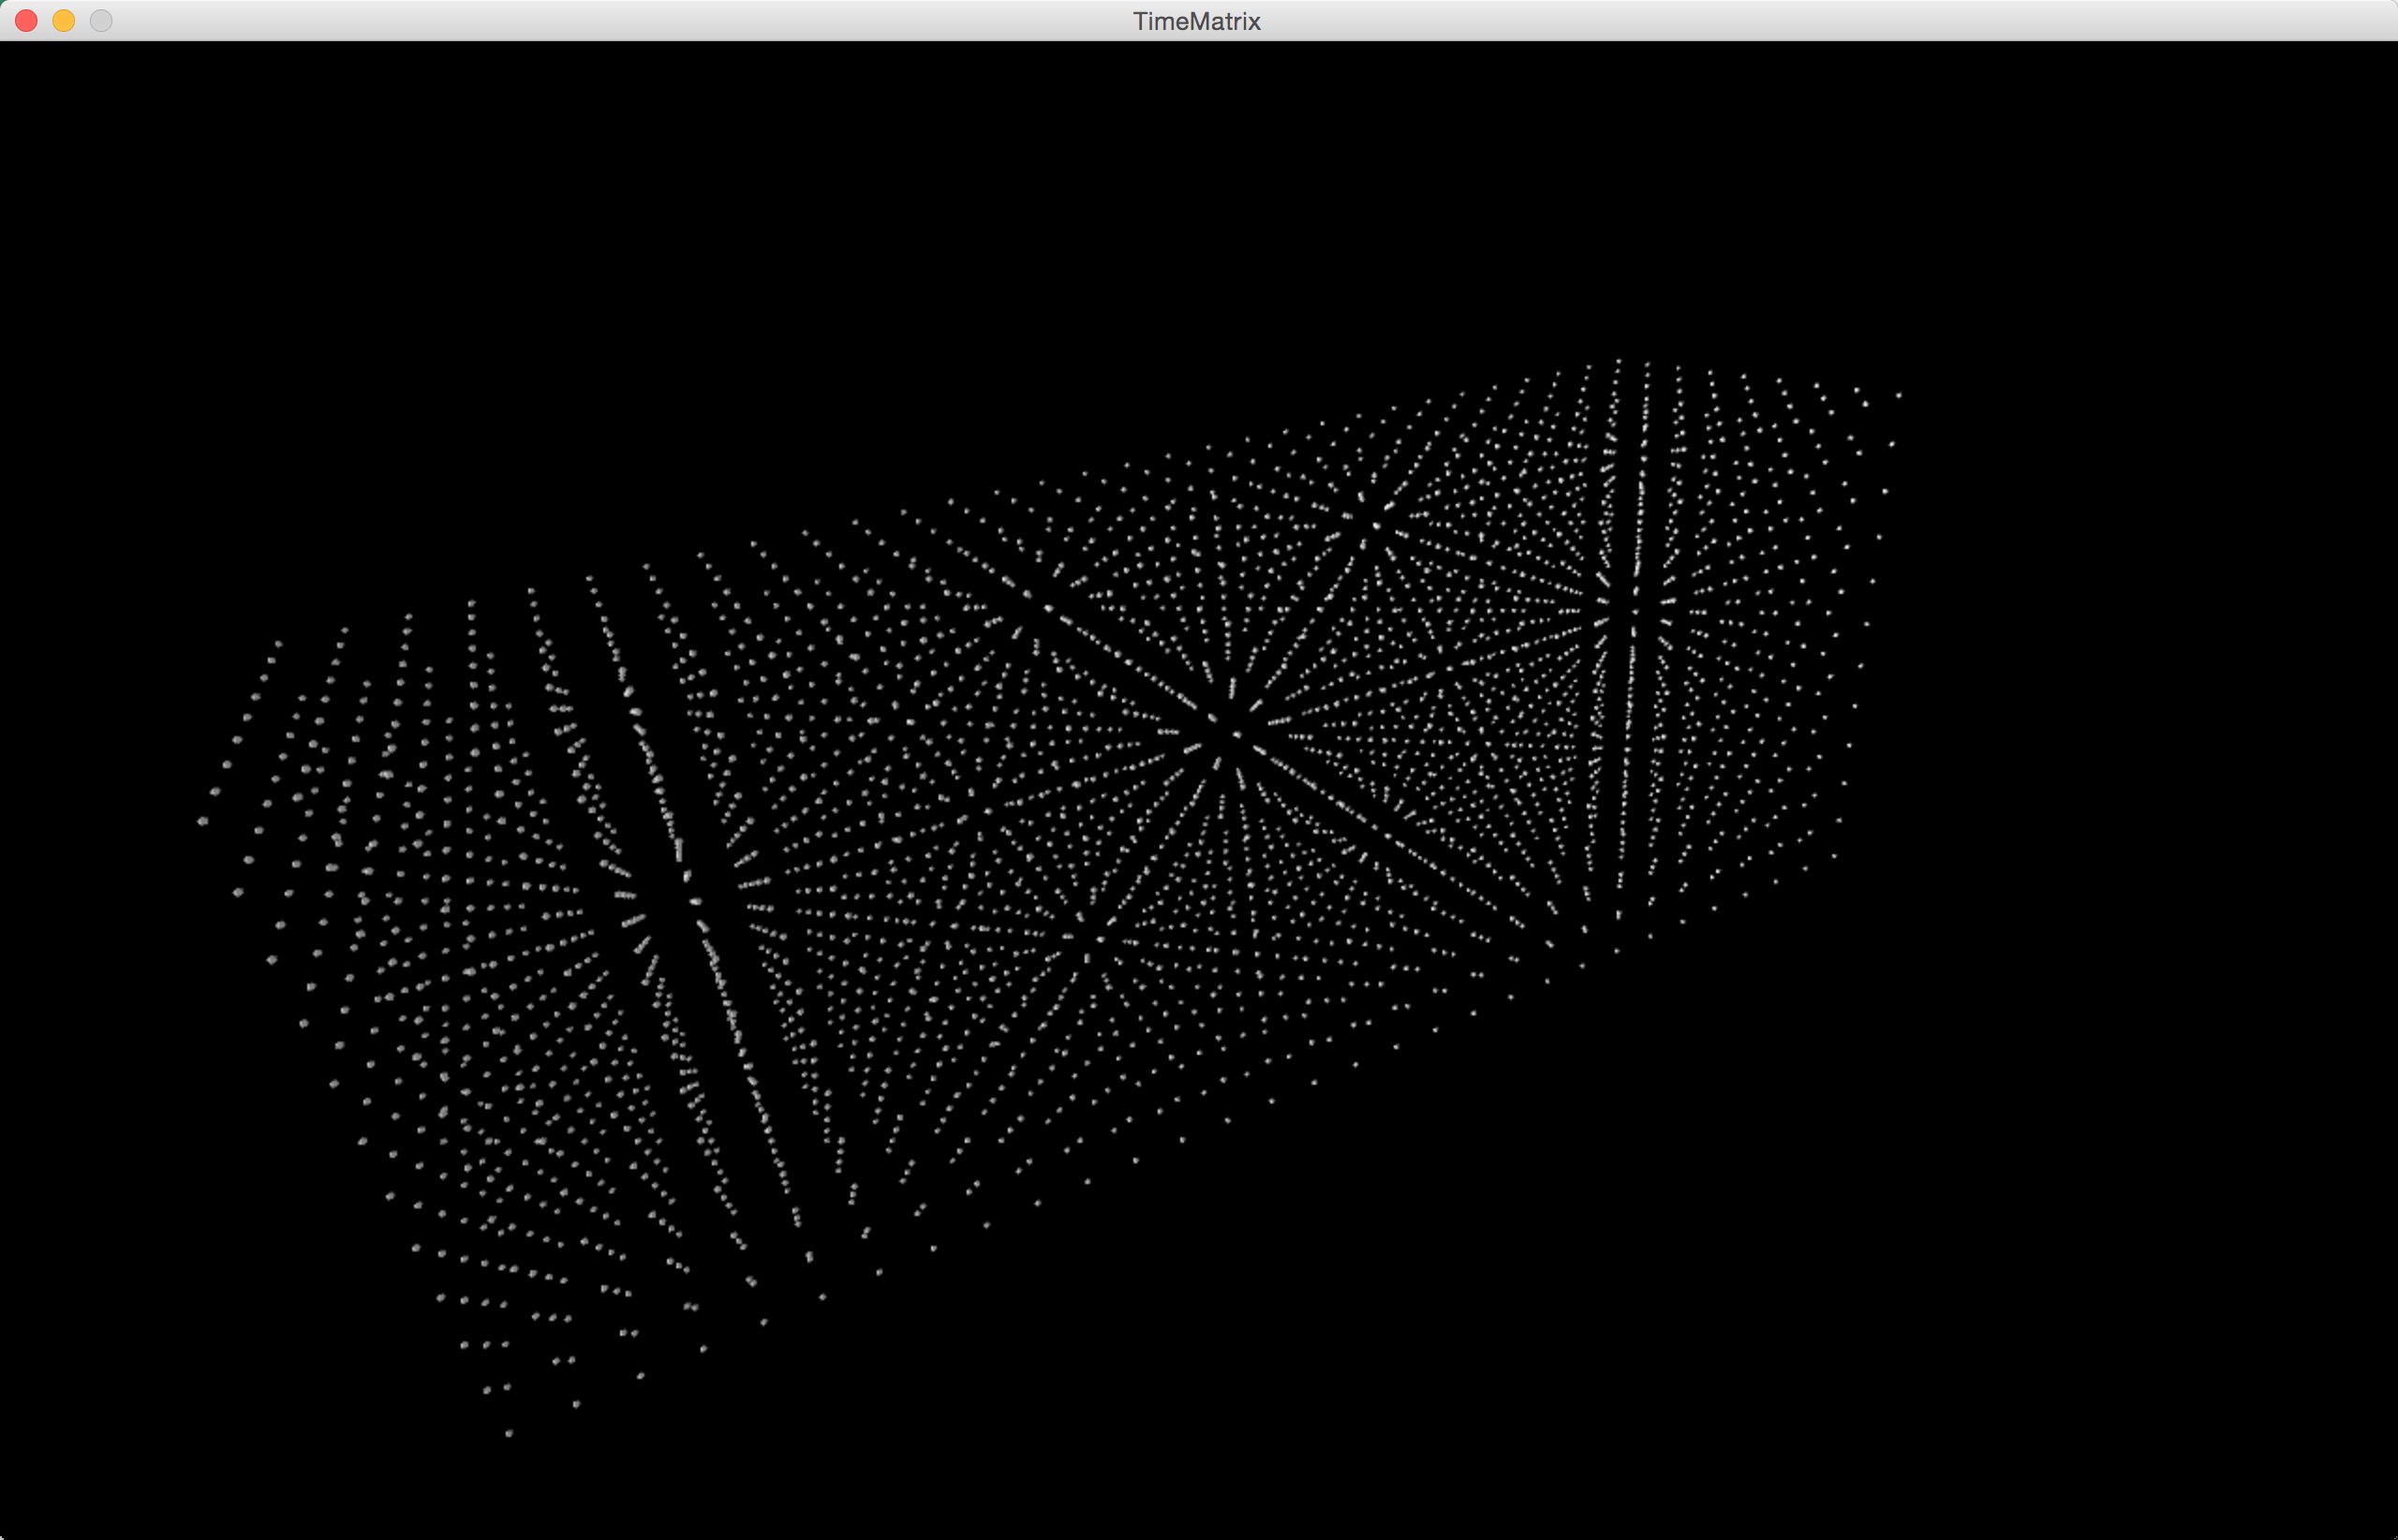
The initial idea was to create a time matrix that each dot is a specific date. Like the image below, it efficient shows every single date in the past six years. With the help of shade, it runs very smoothly.
By adding colors and changing the shape to cube, it got somewhere but not further enough for my goal. So I changed this time matrix completed to something else.
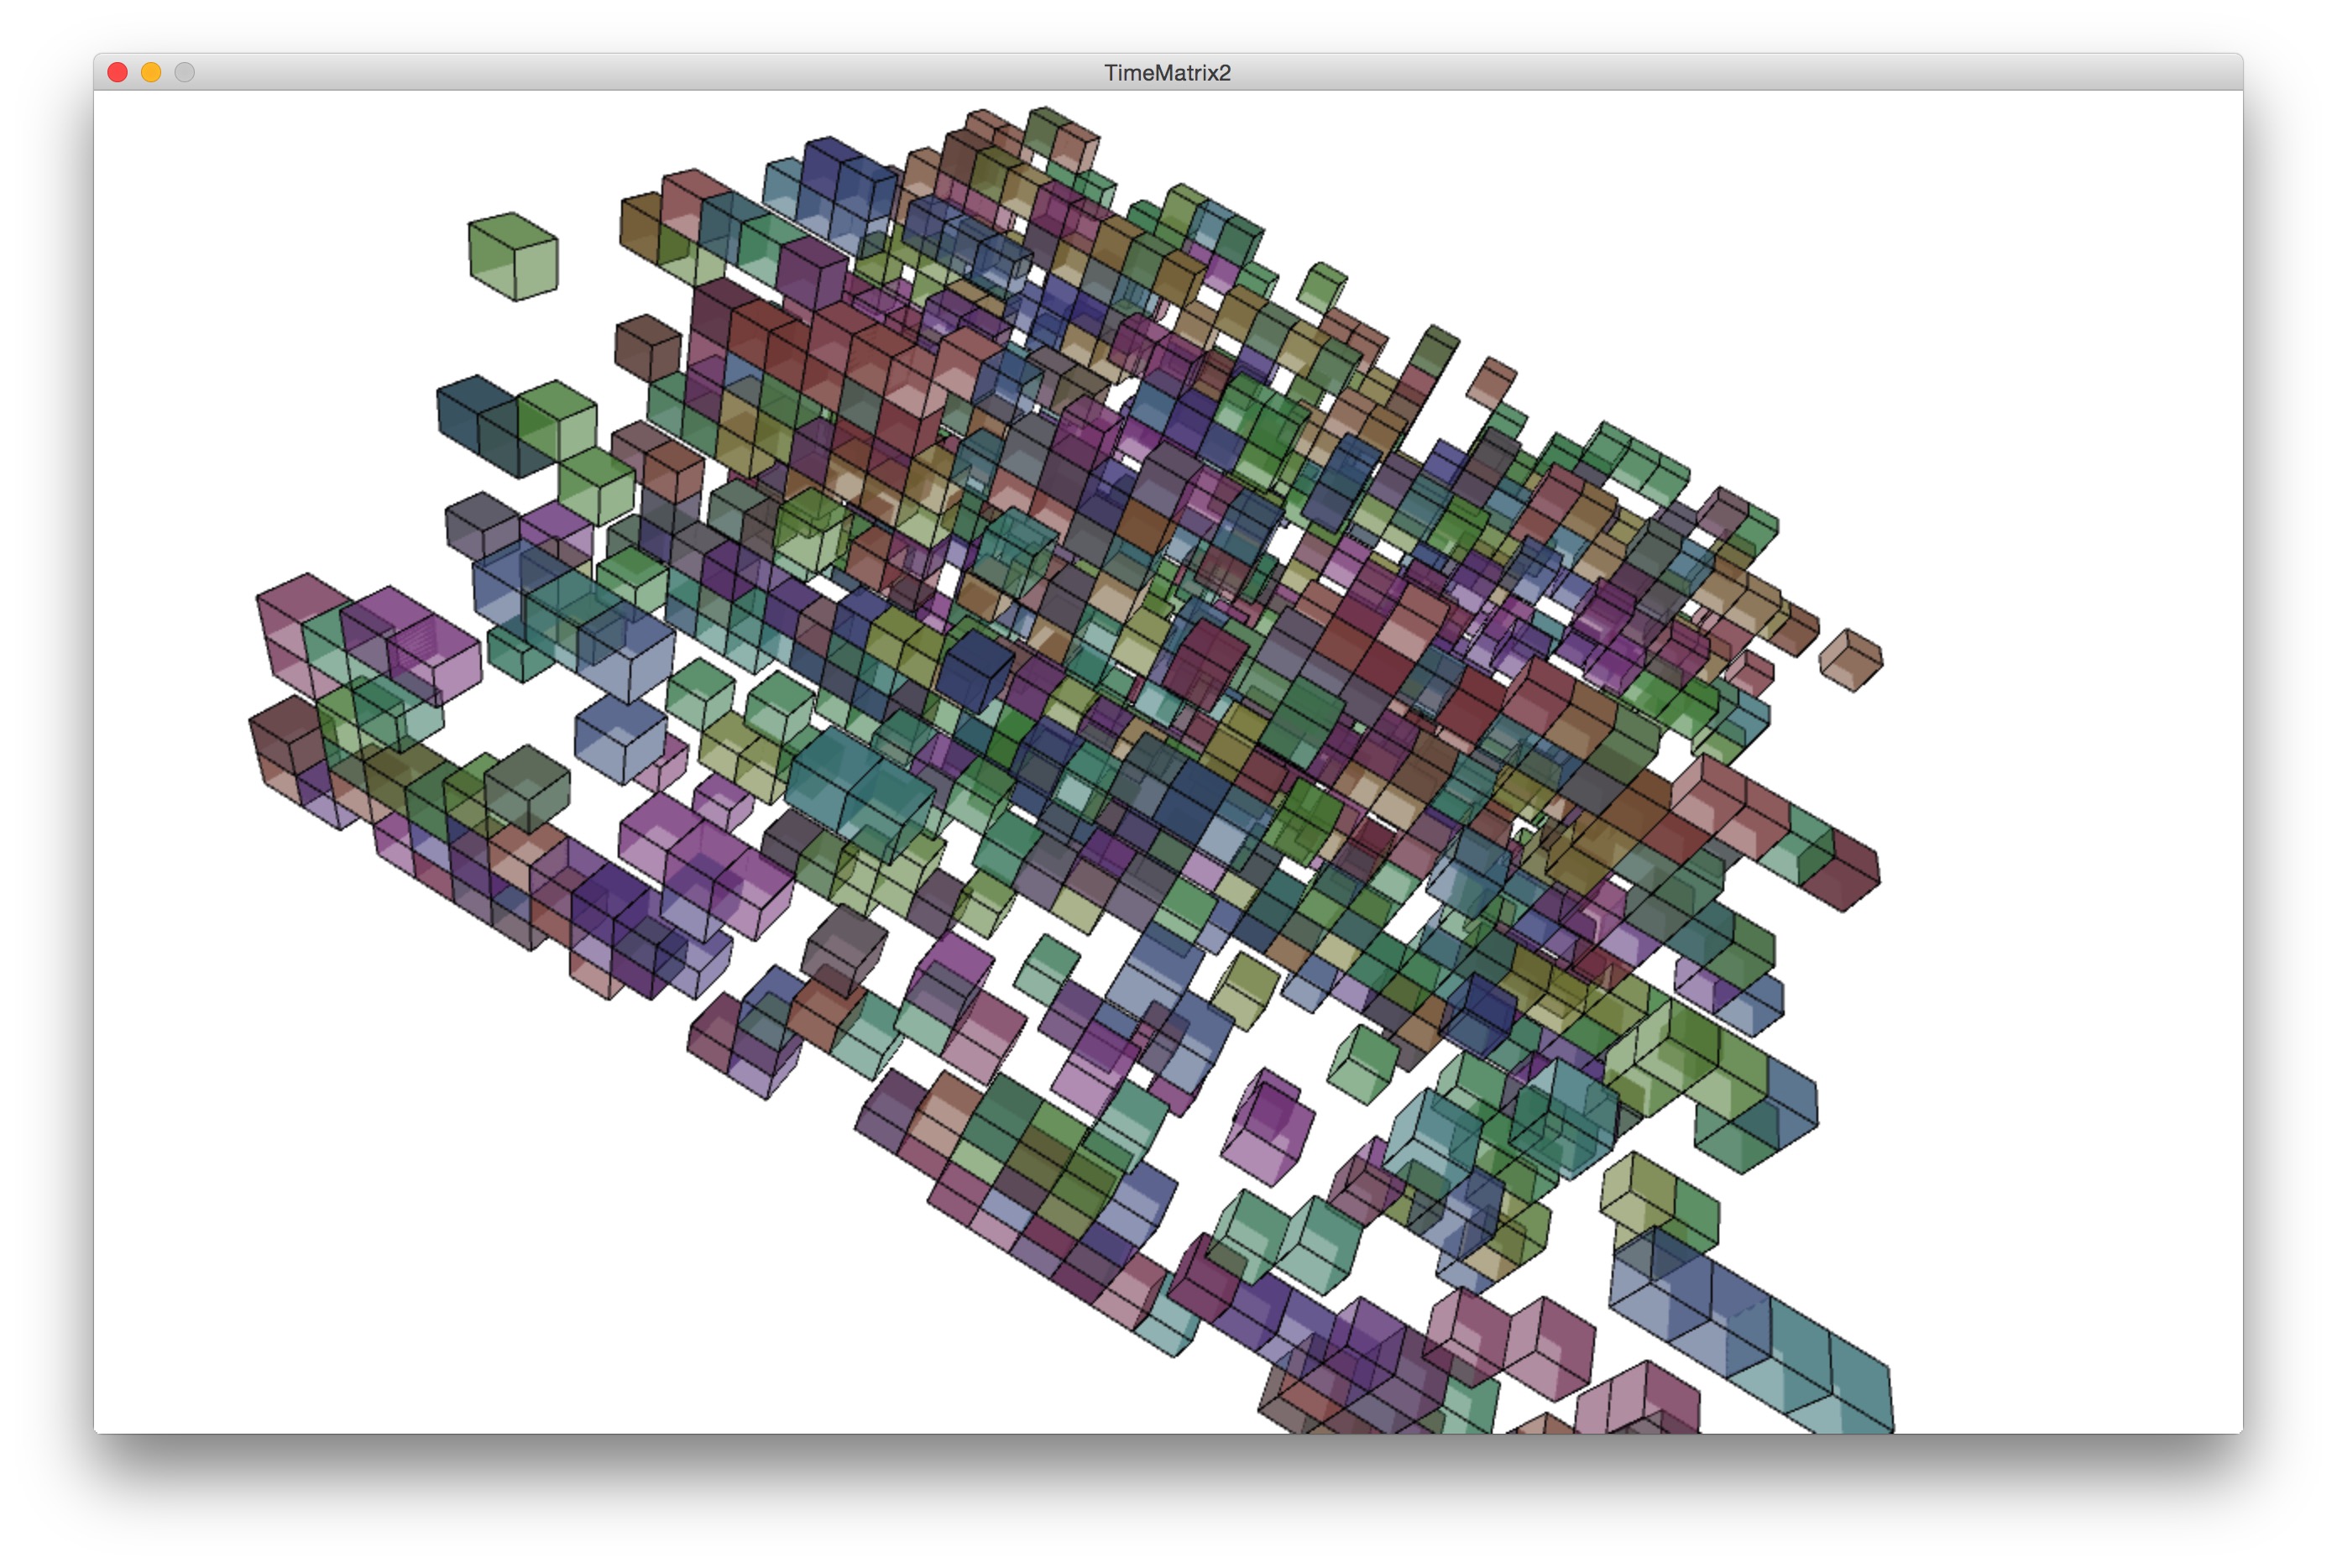
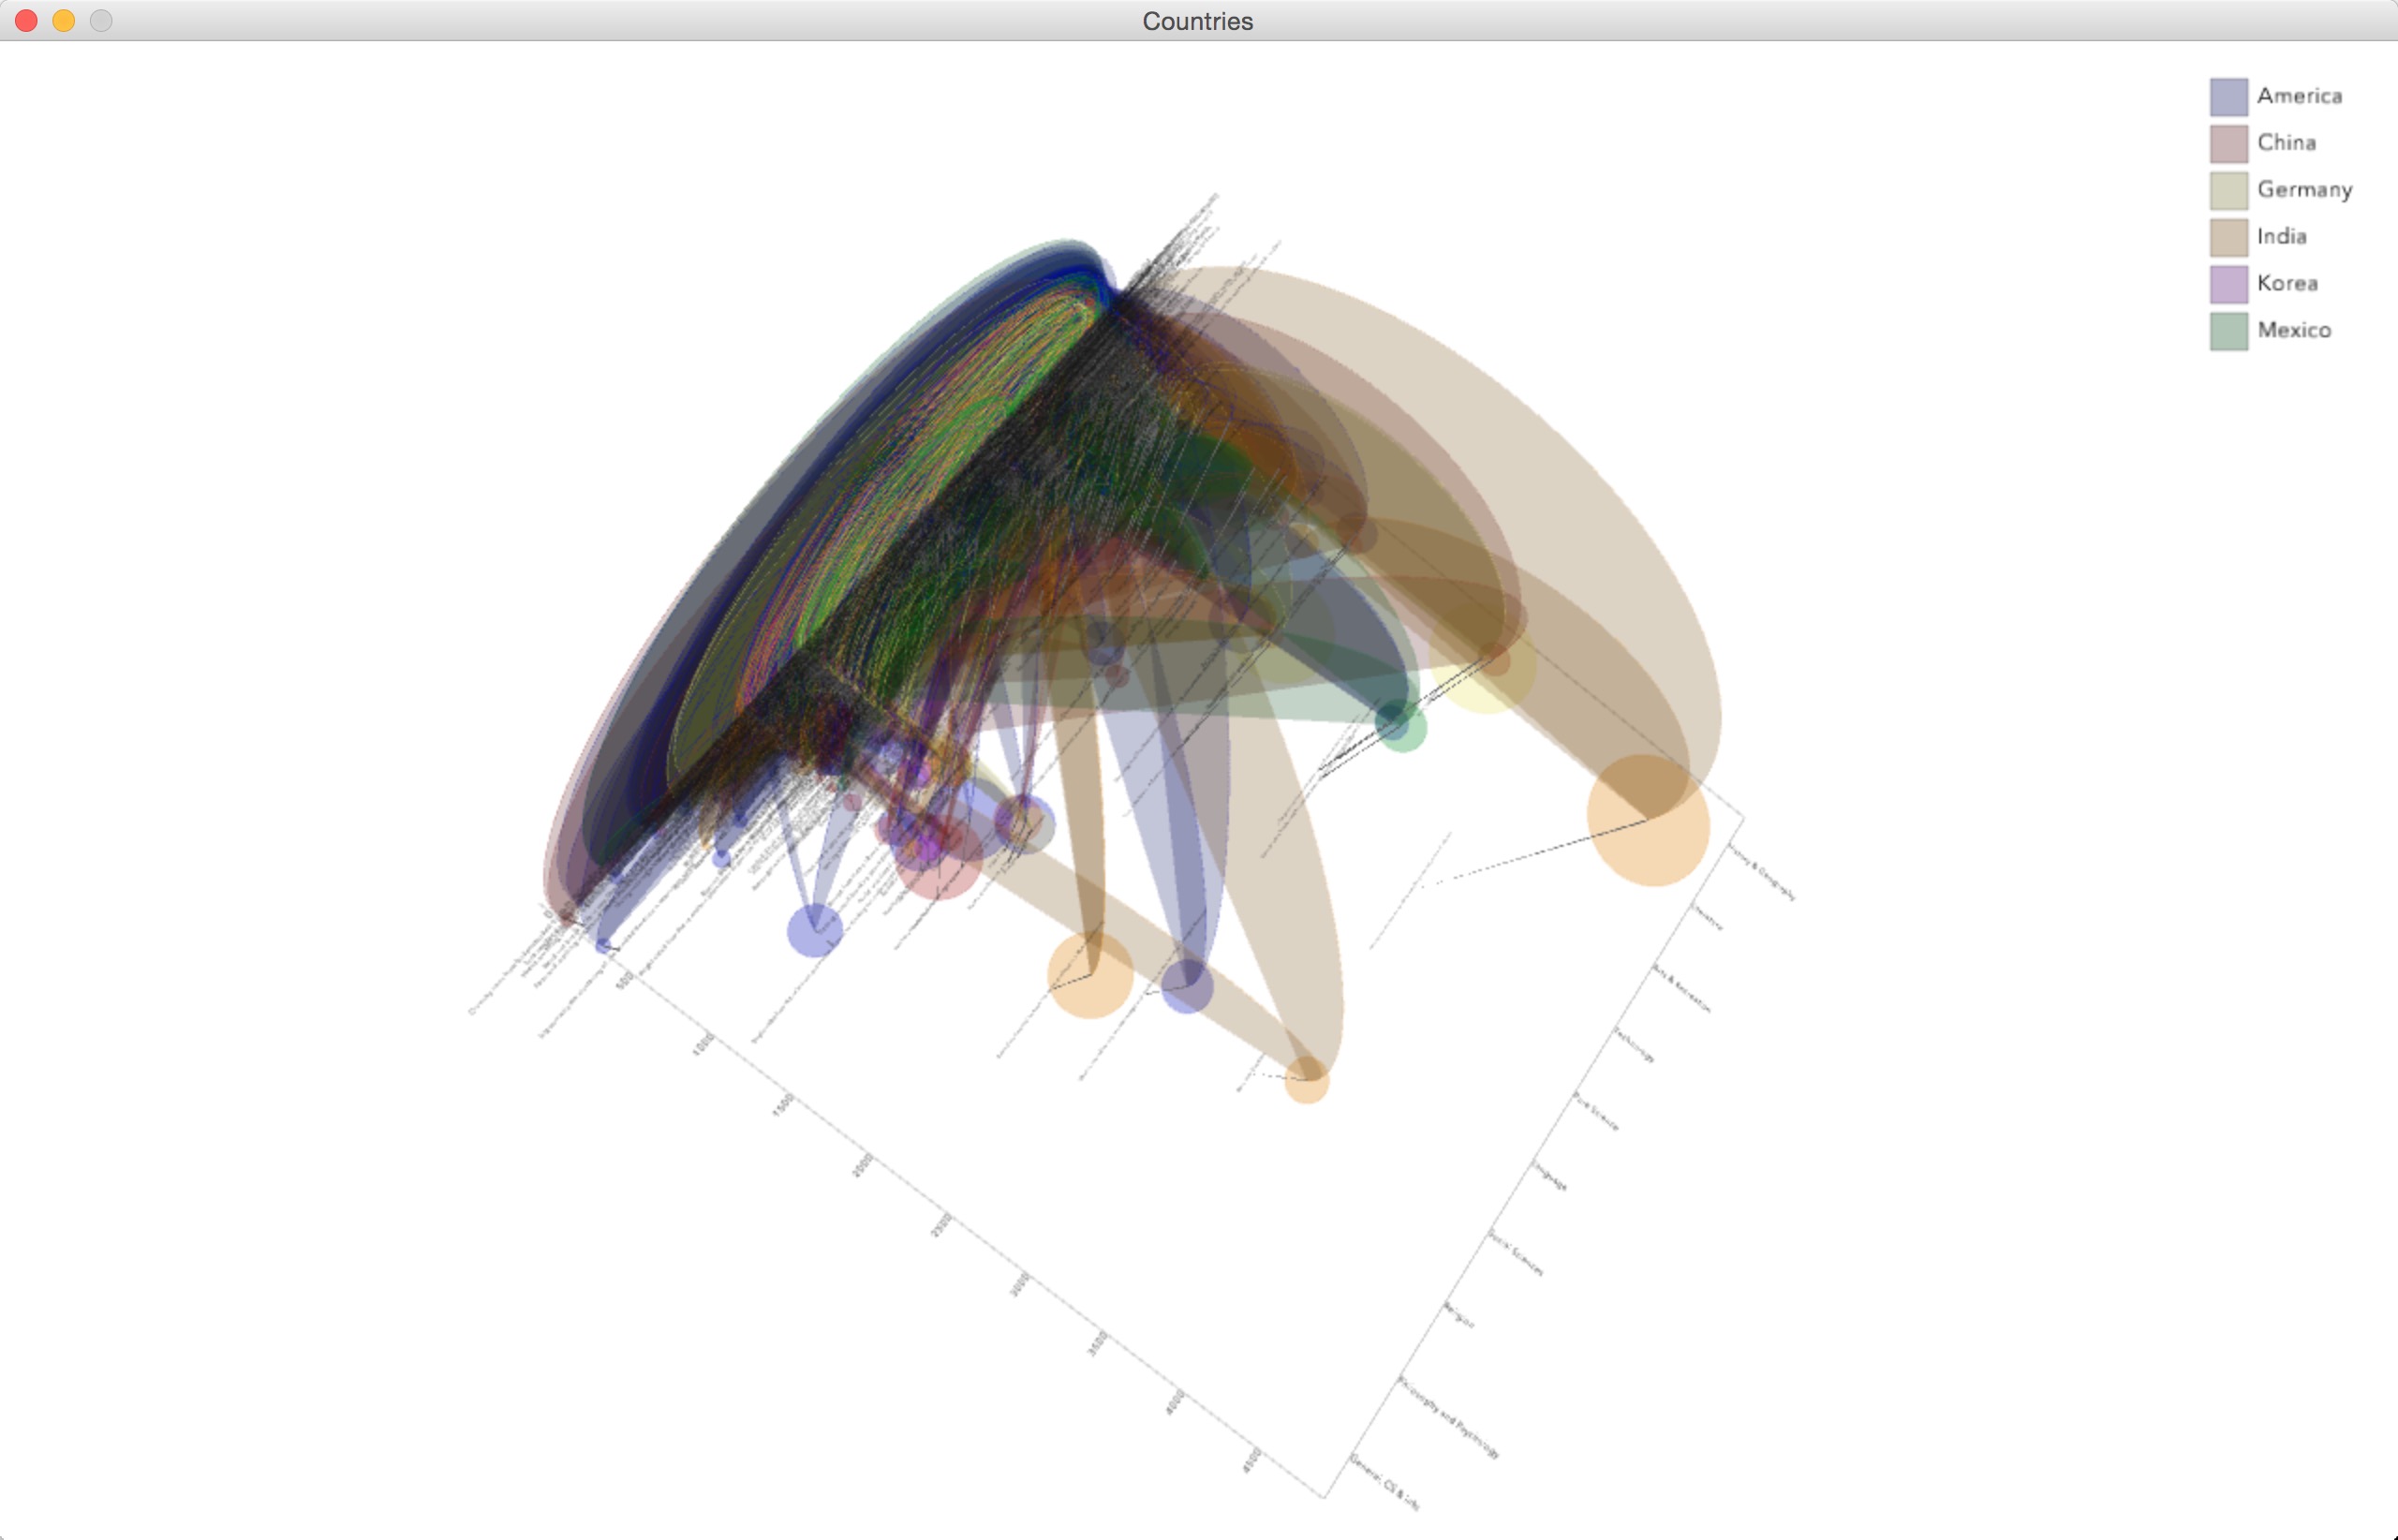
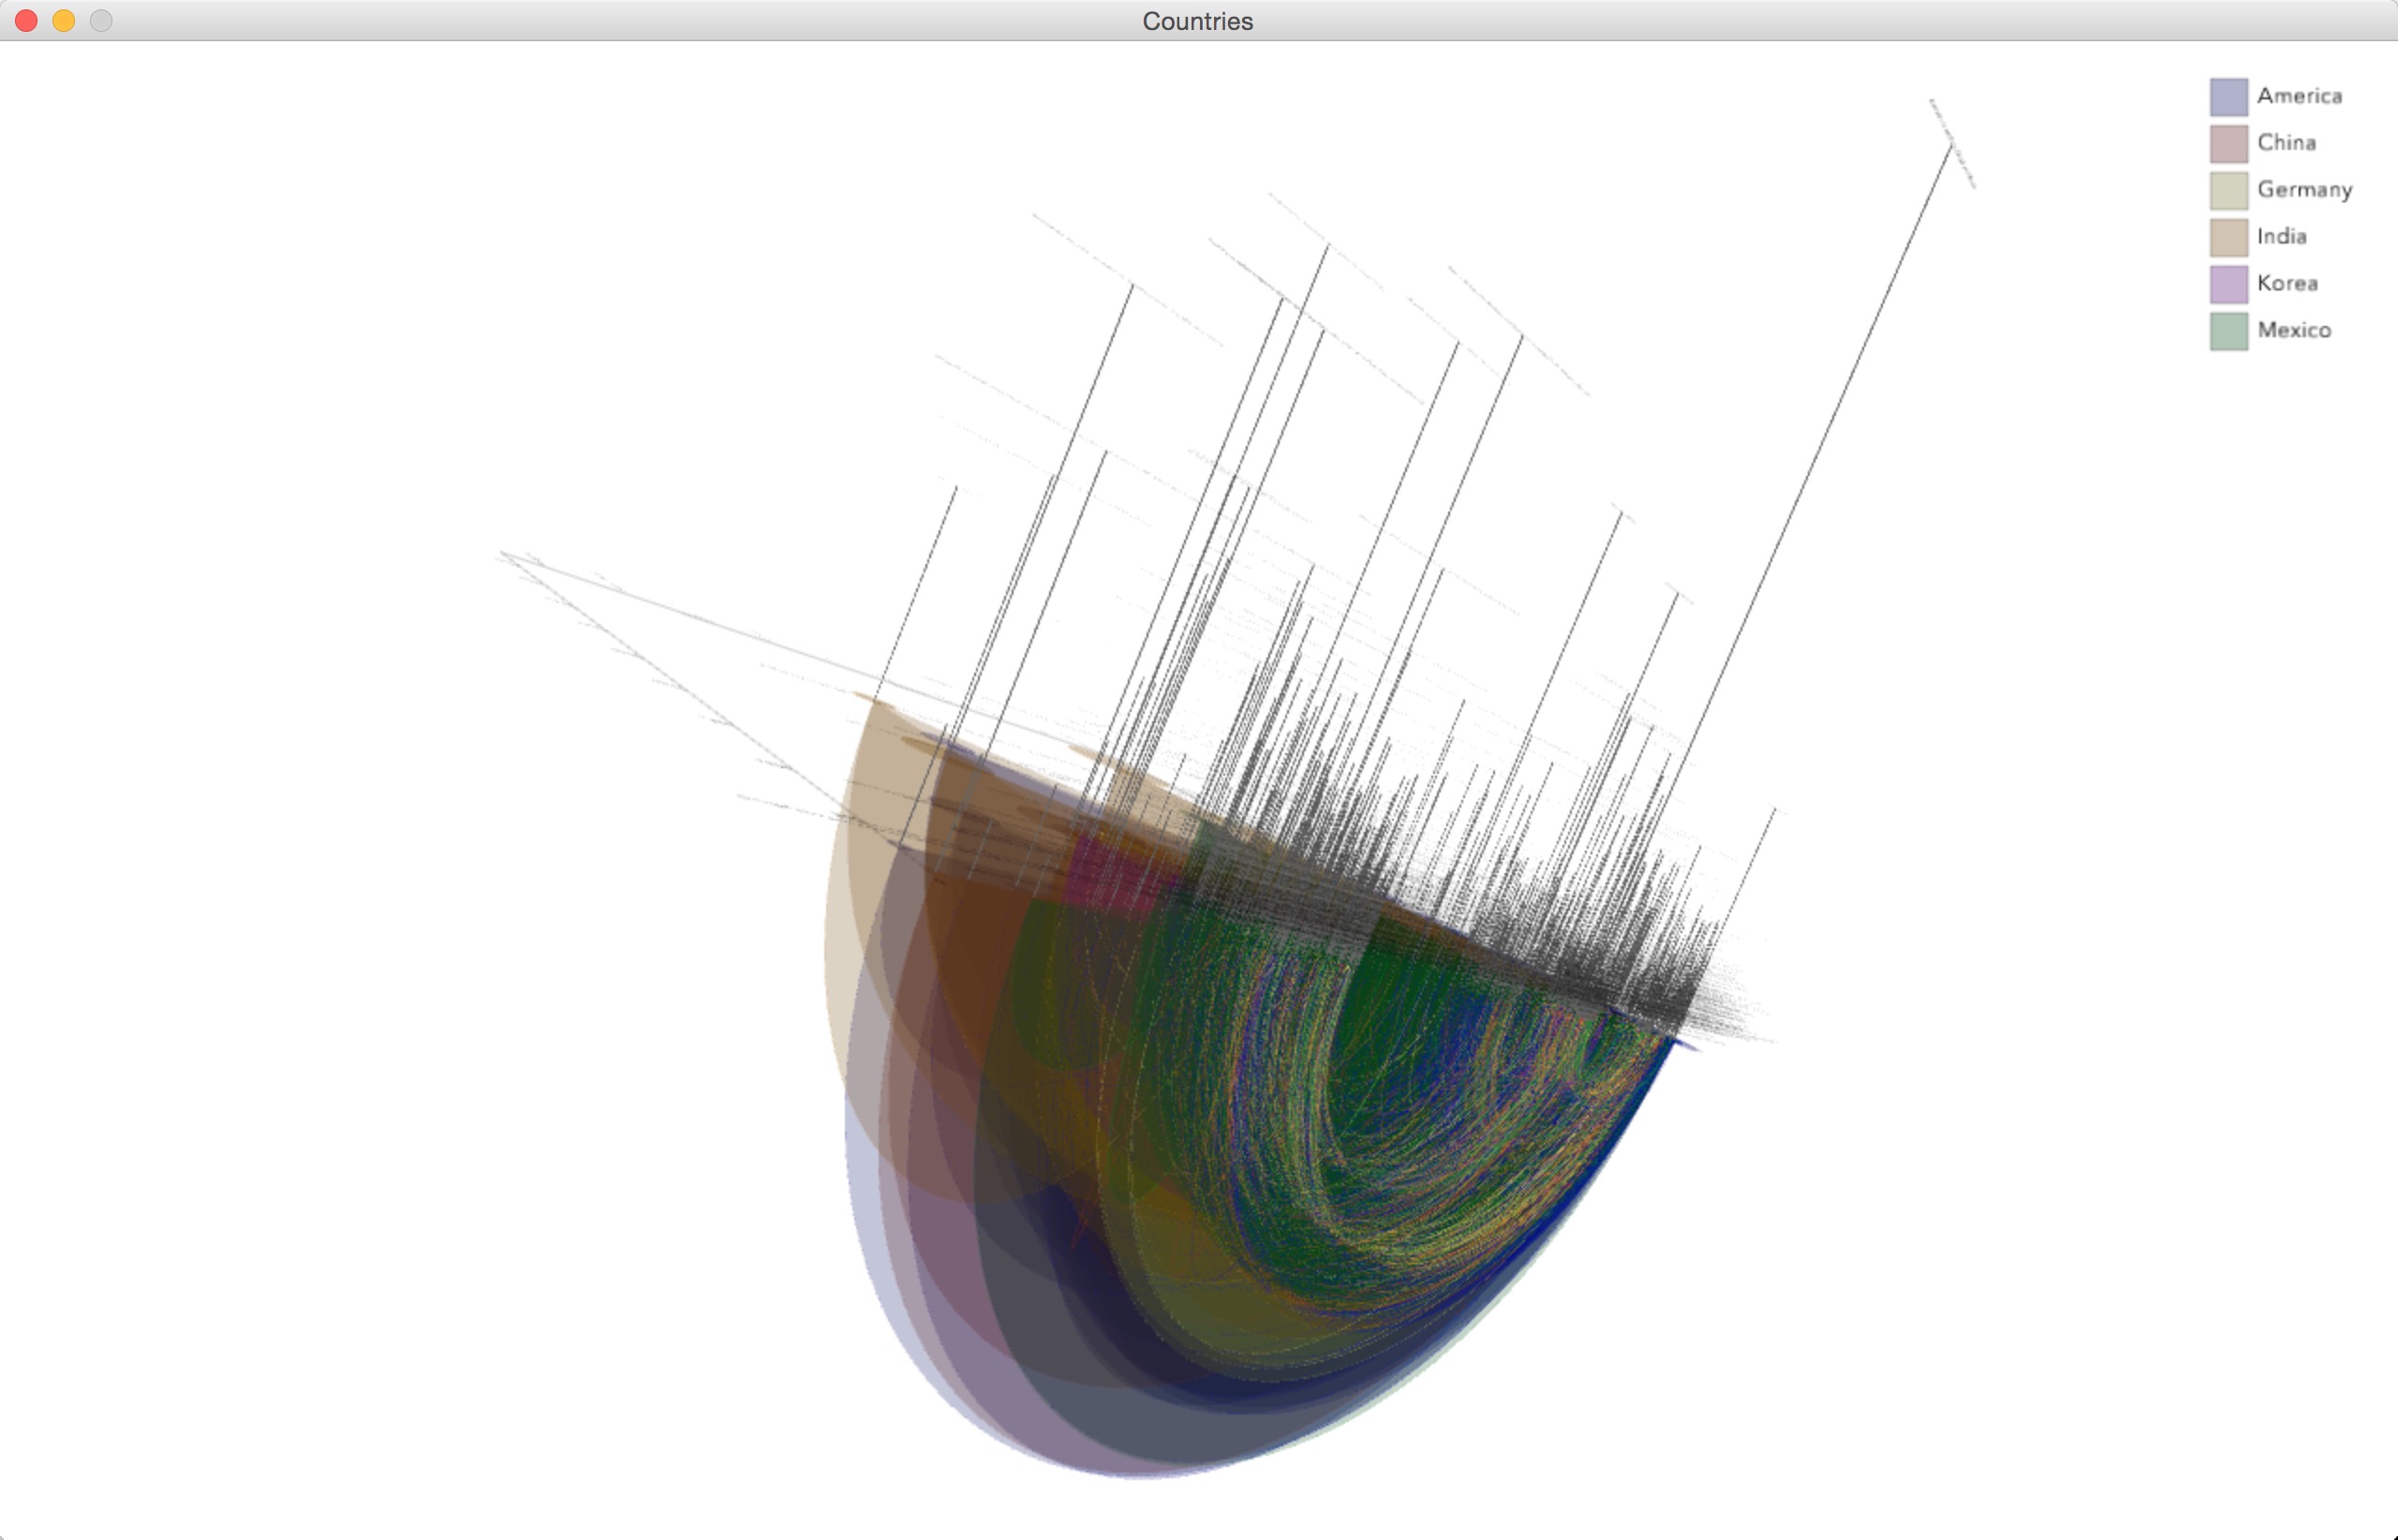
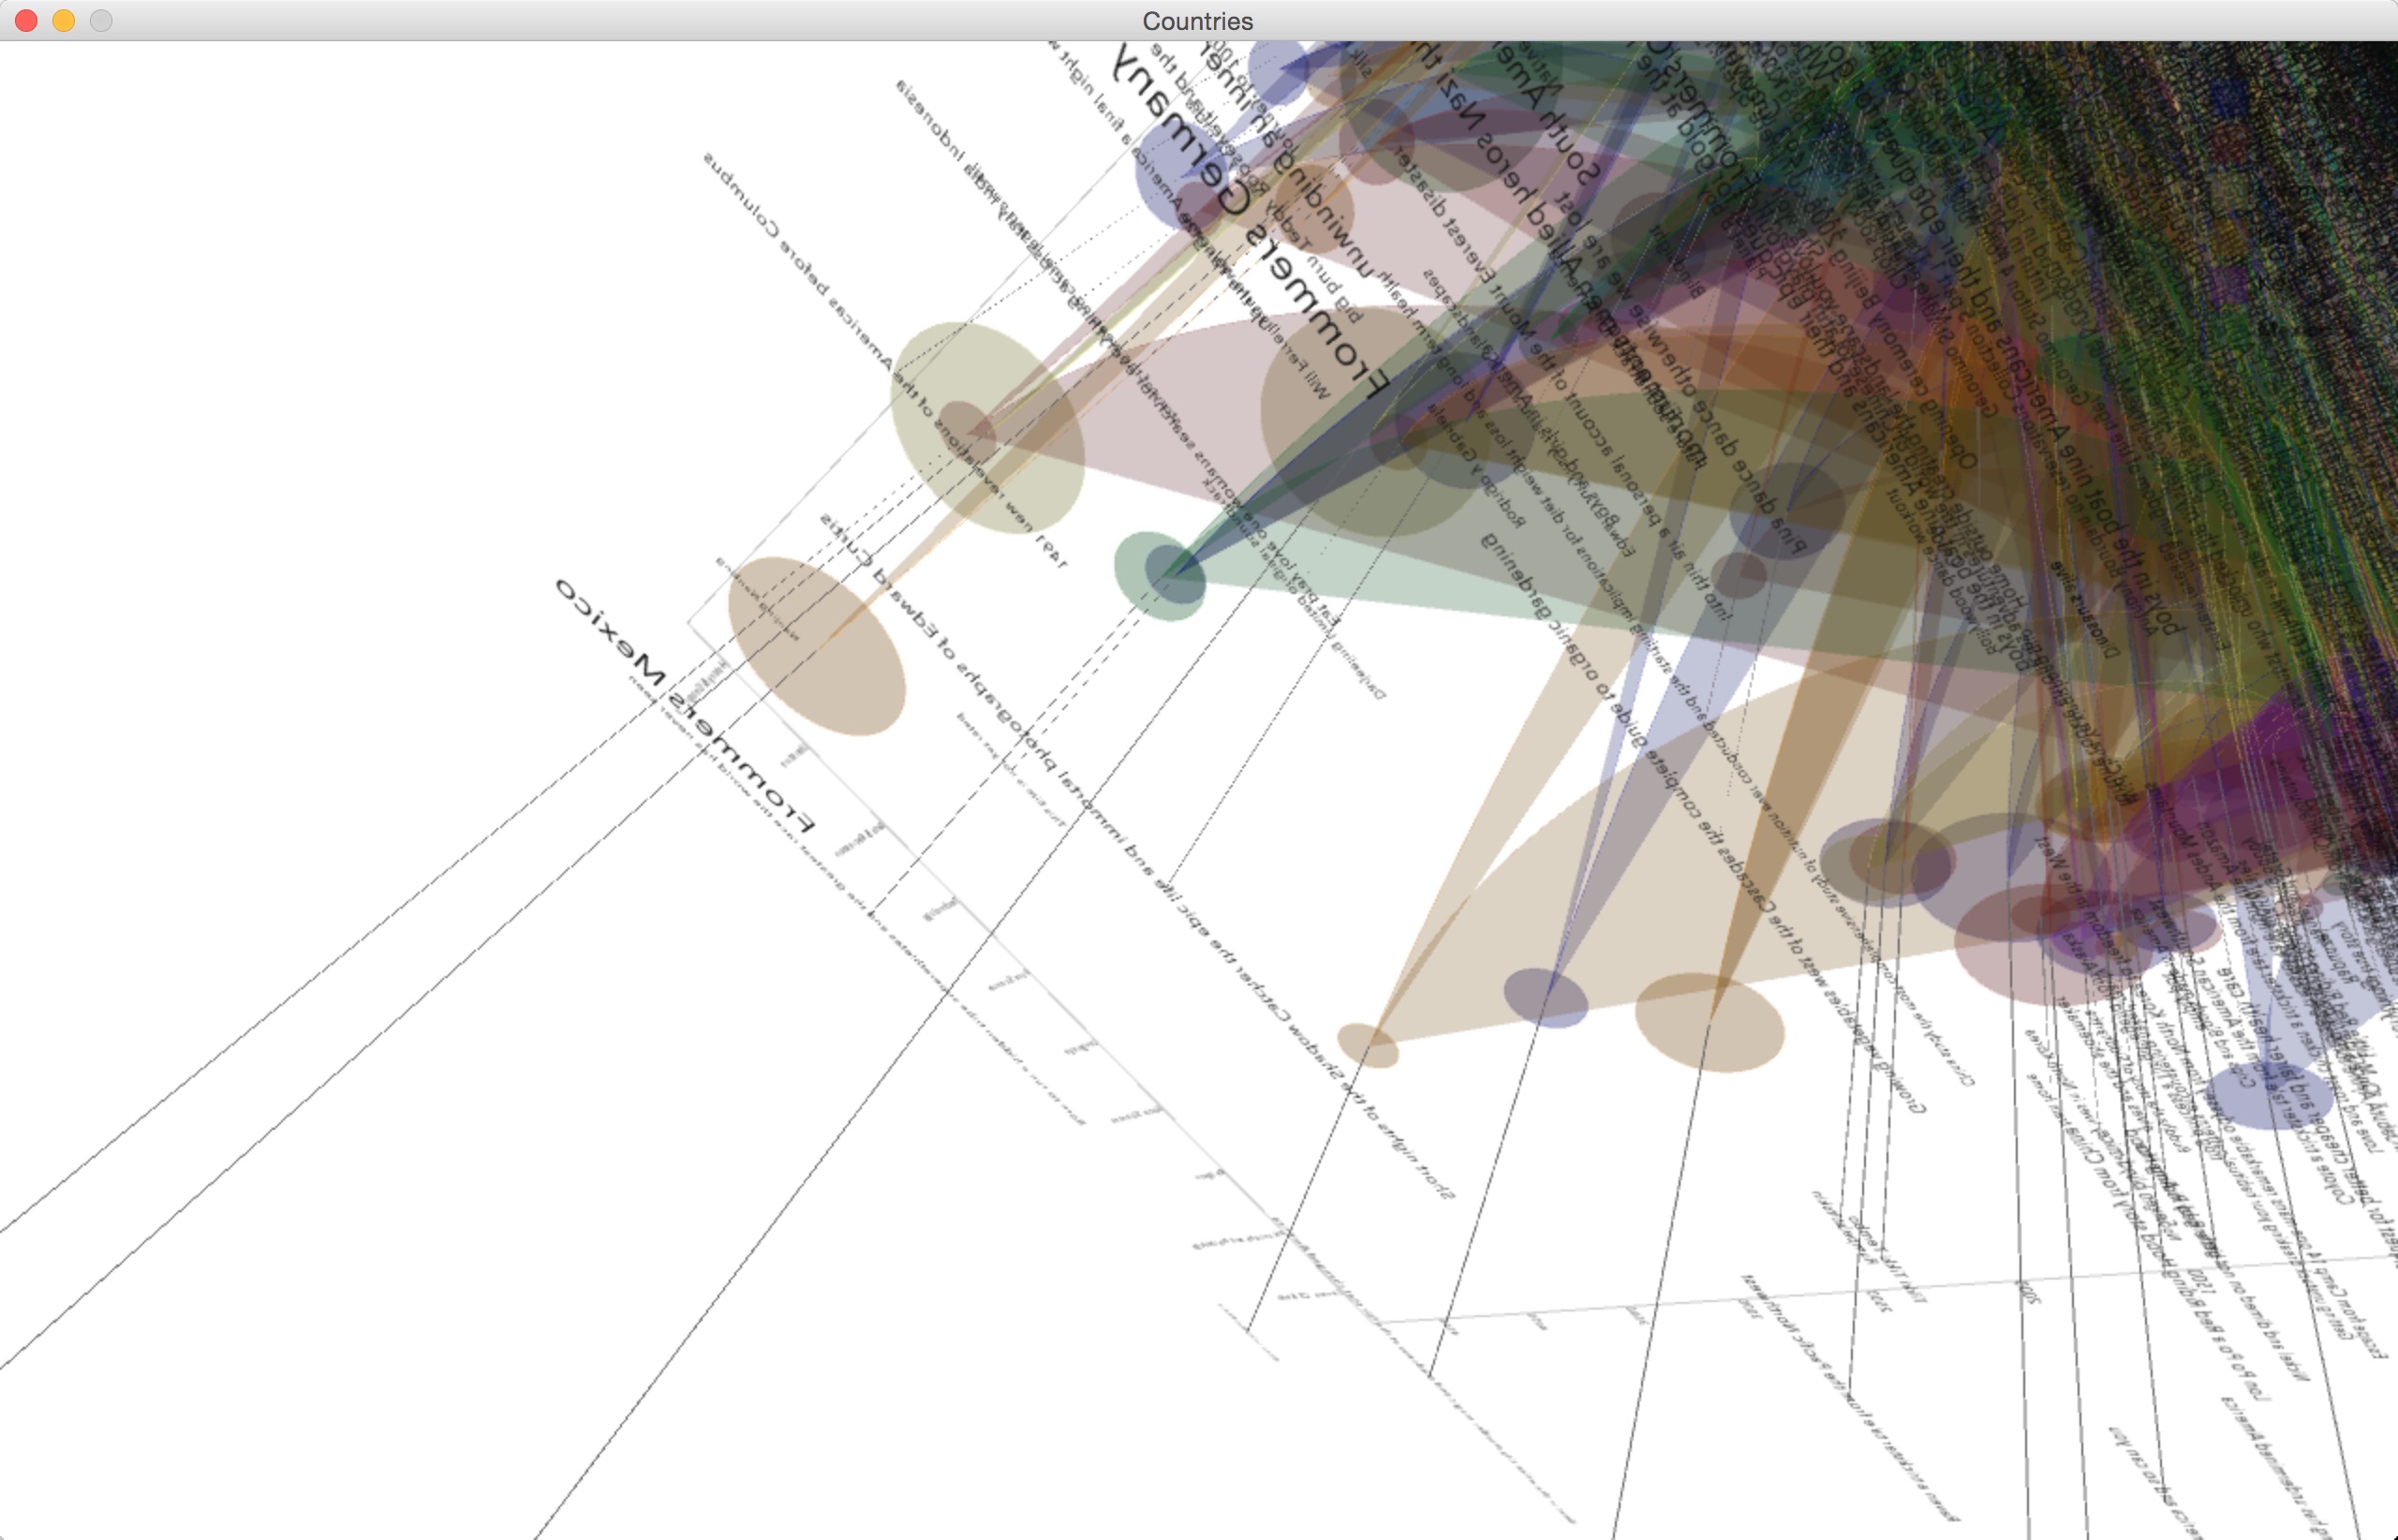
And the four images below show the process of the new idea gradually.The interesting part of this 3D form is that it contains tons of information (more than 5000 books), and audience can choose to explore part of the details they are interested by viewing the 3D shape with different angles and perspectives.
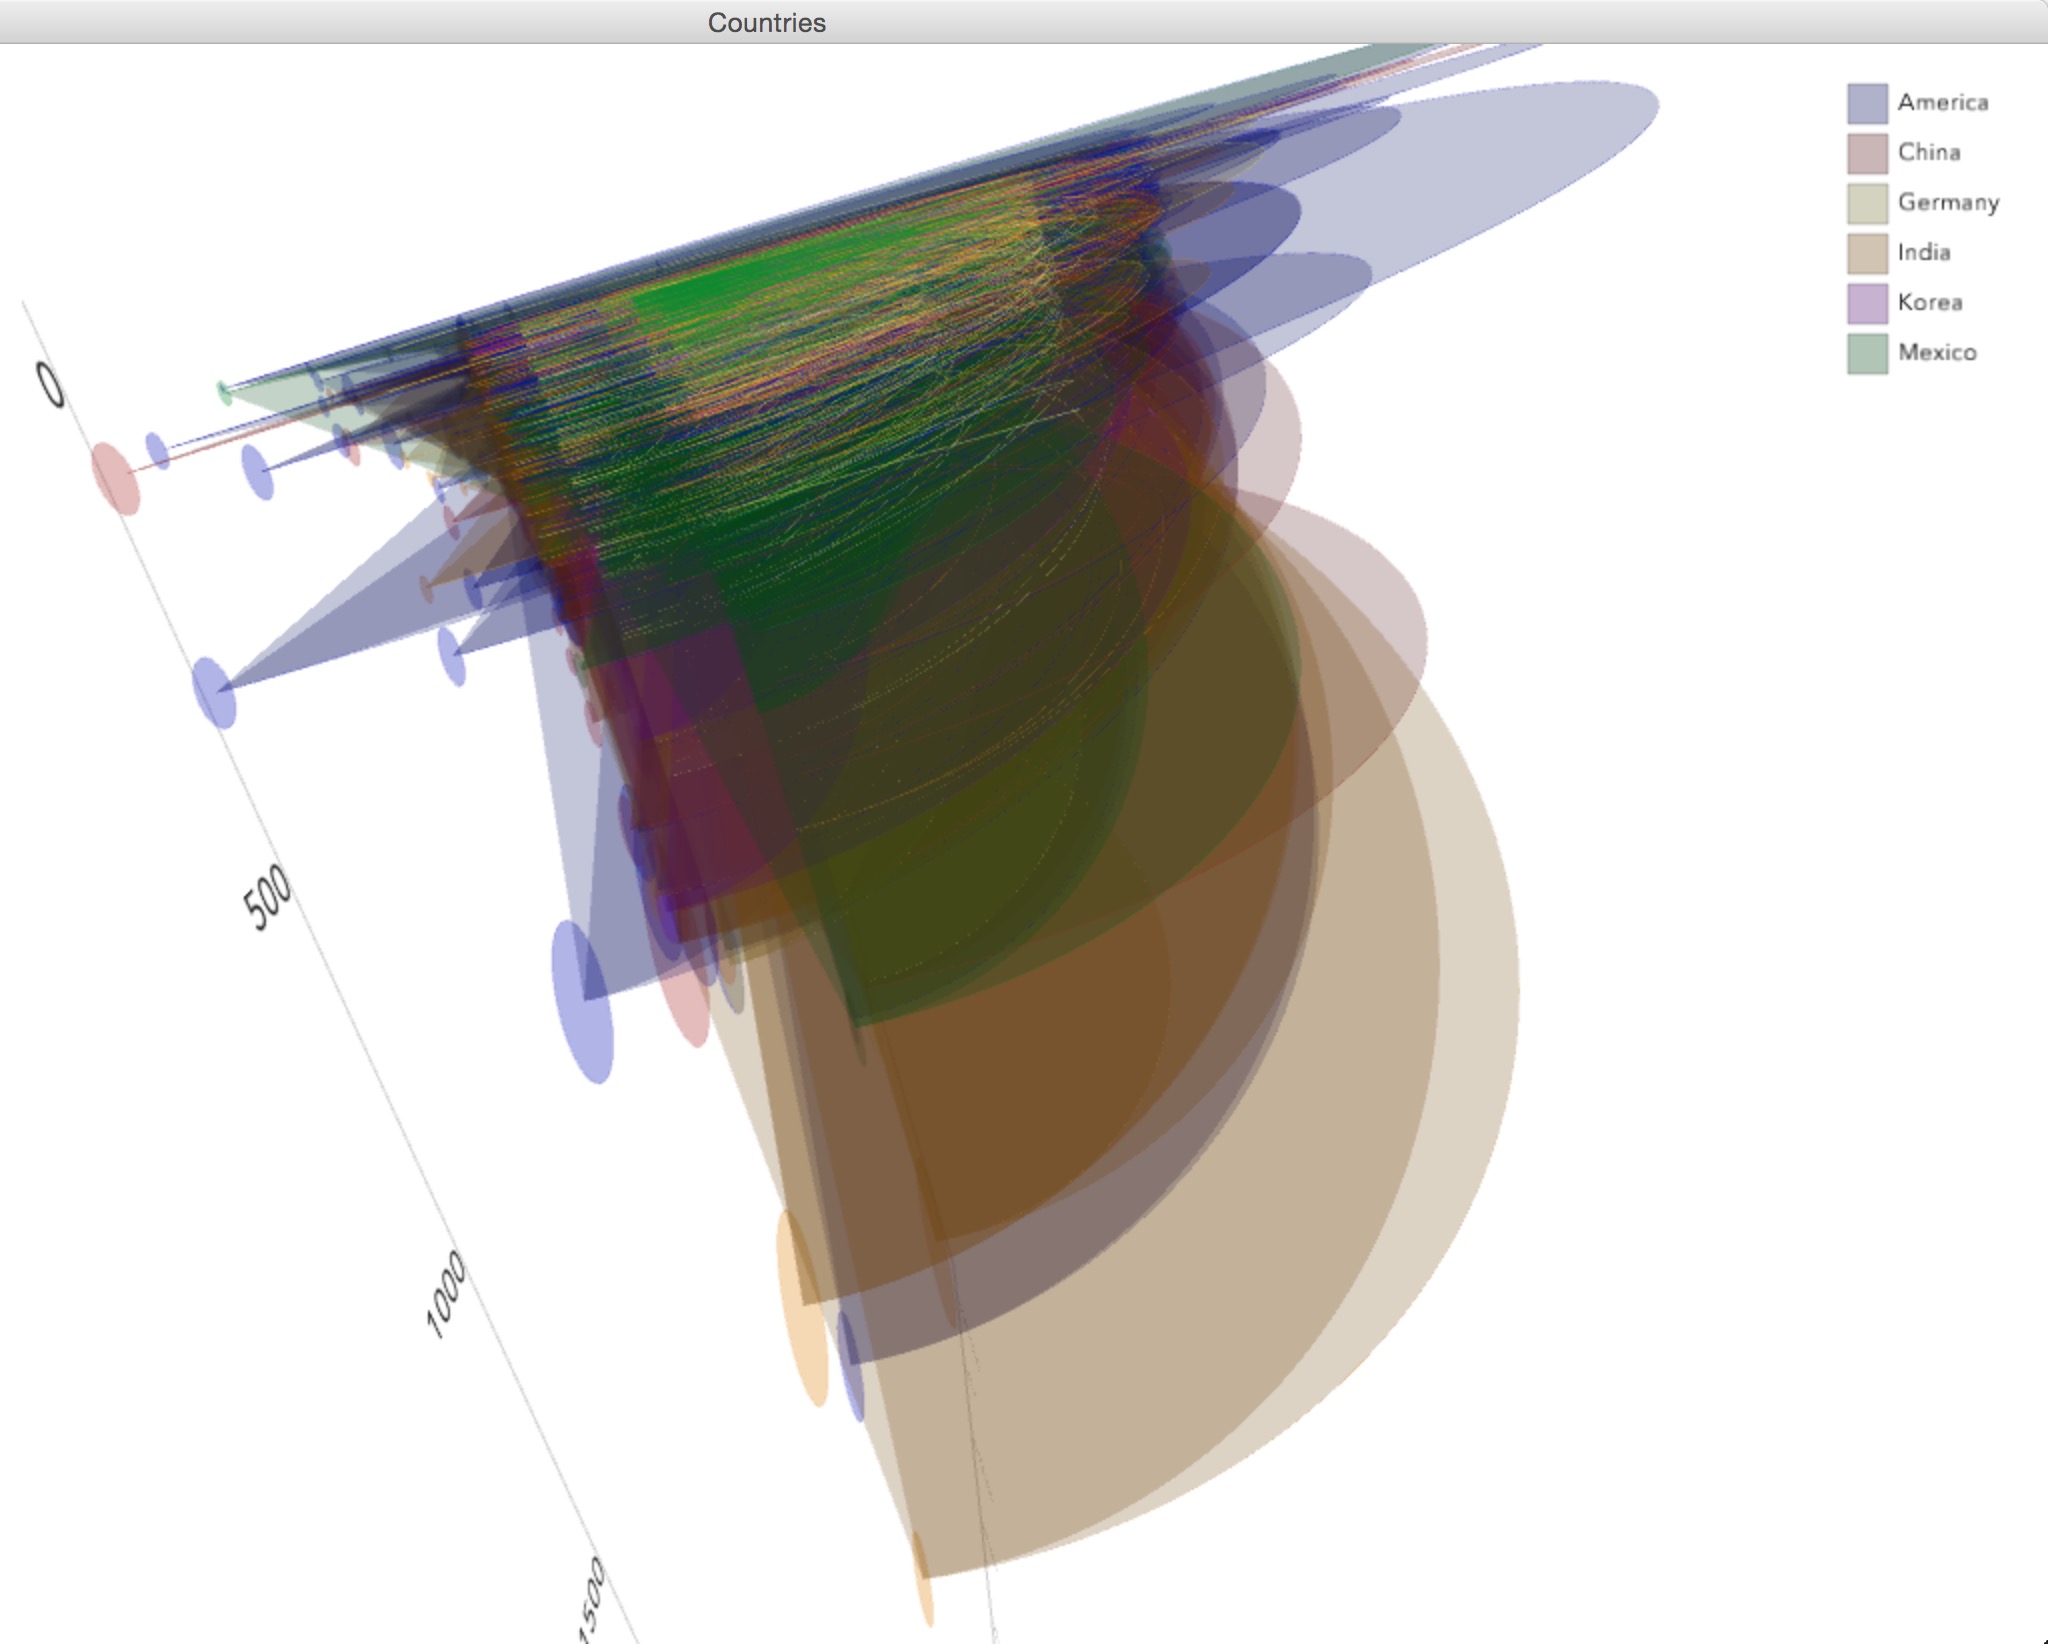
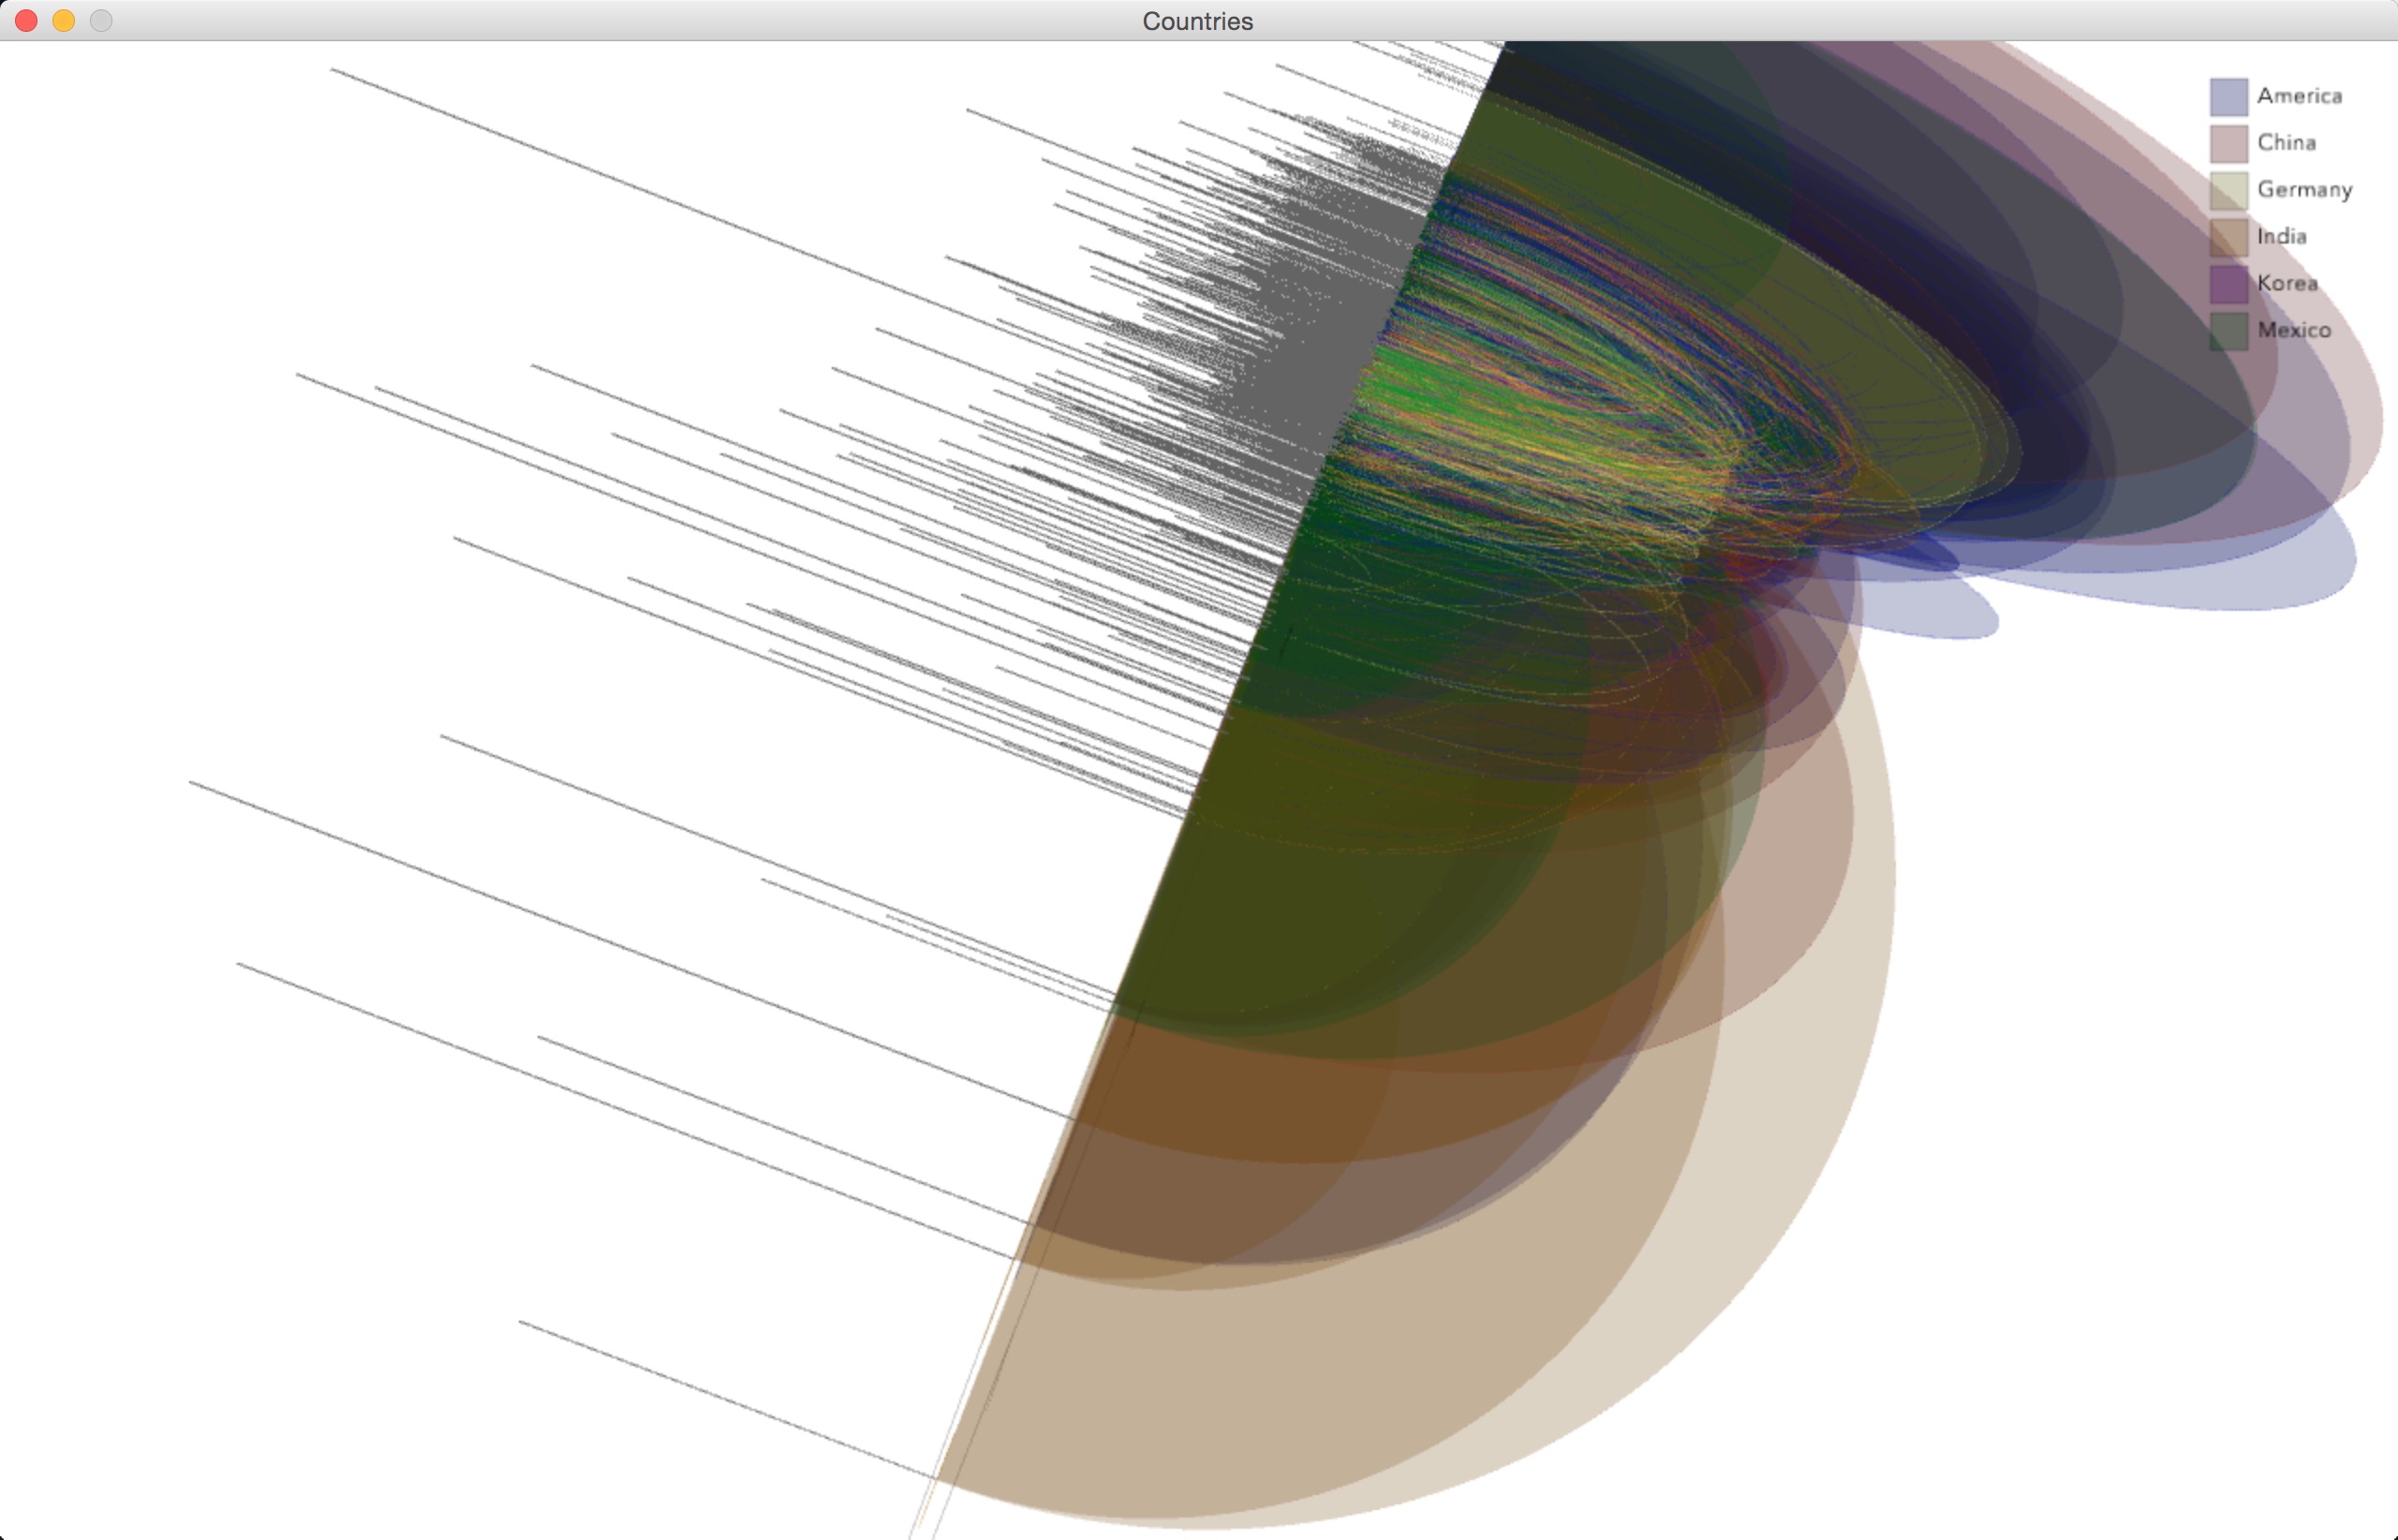
By adding colors and changing the shape to cube, it got somewhere but not further enough for my goal. So I changed this time matrix completed to something else.
And the four images below show the process of the new idea gradually.The interesting part of this 3D form is that it contains tons of information (more than 5000 books), and audience can choose to explore part of the details they are interested by viewing the 3D shape with different angles and perspectives.
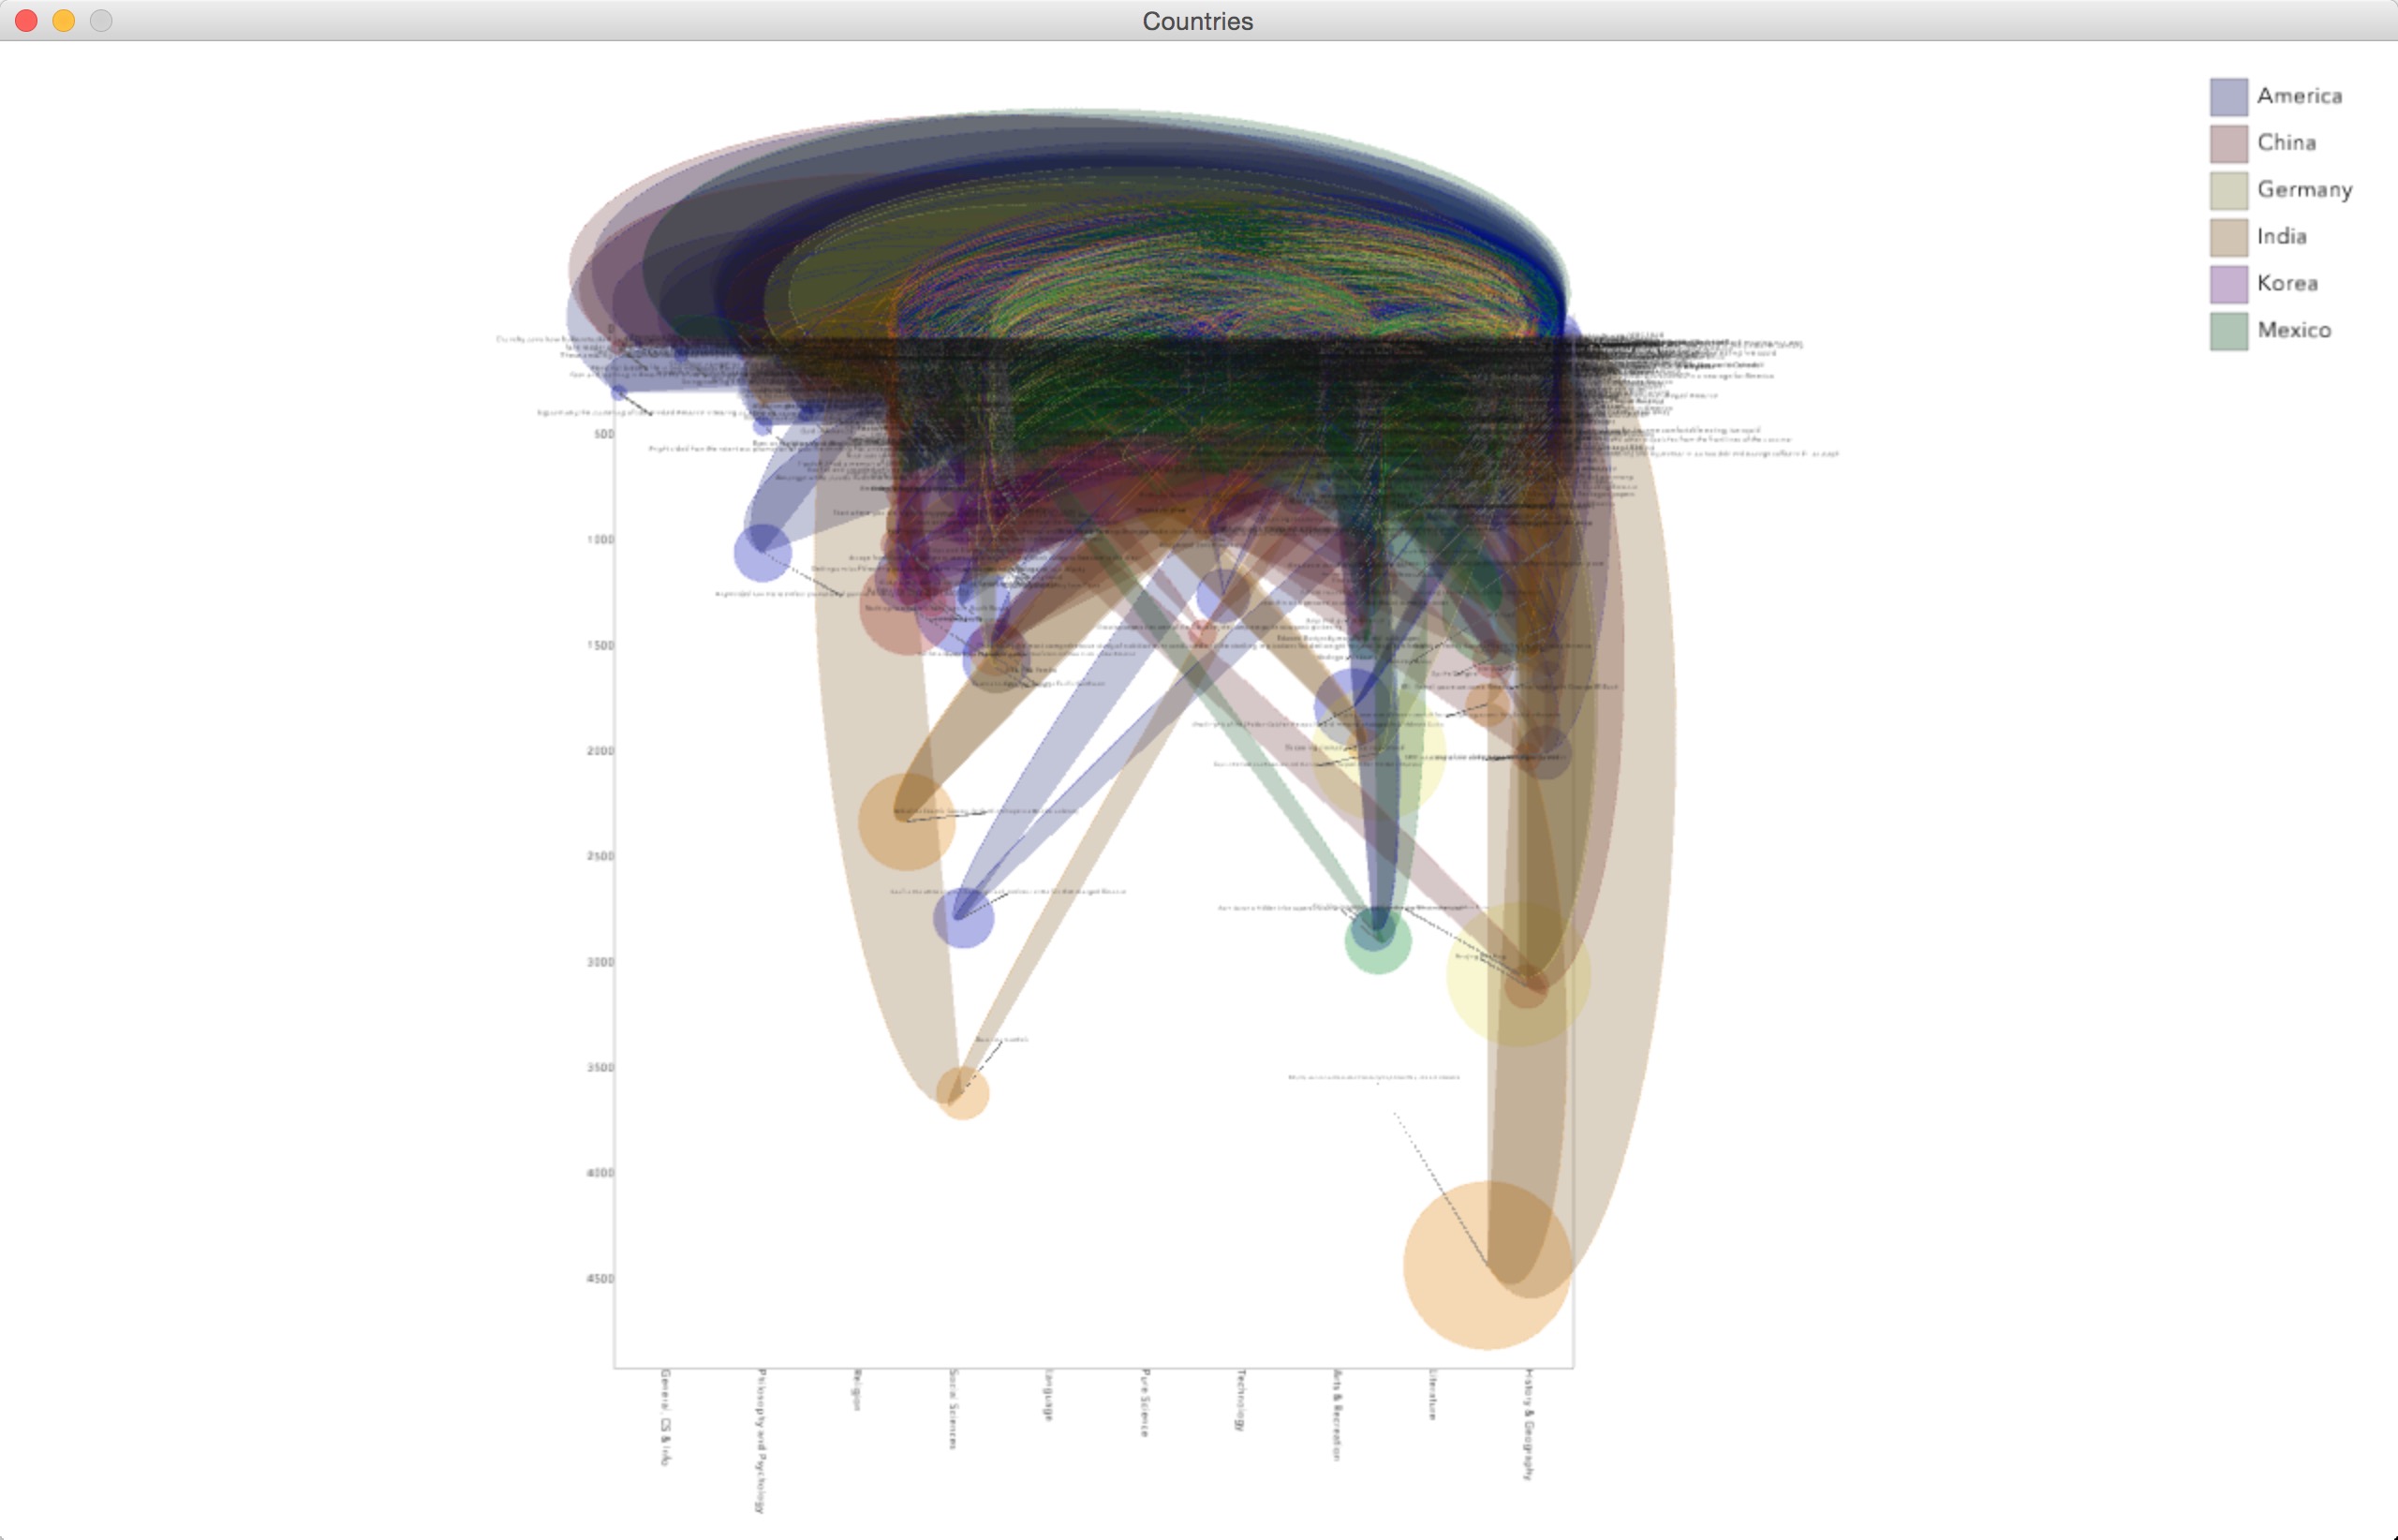
Final result
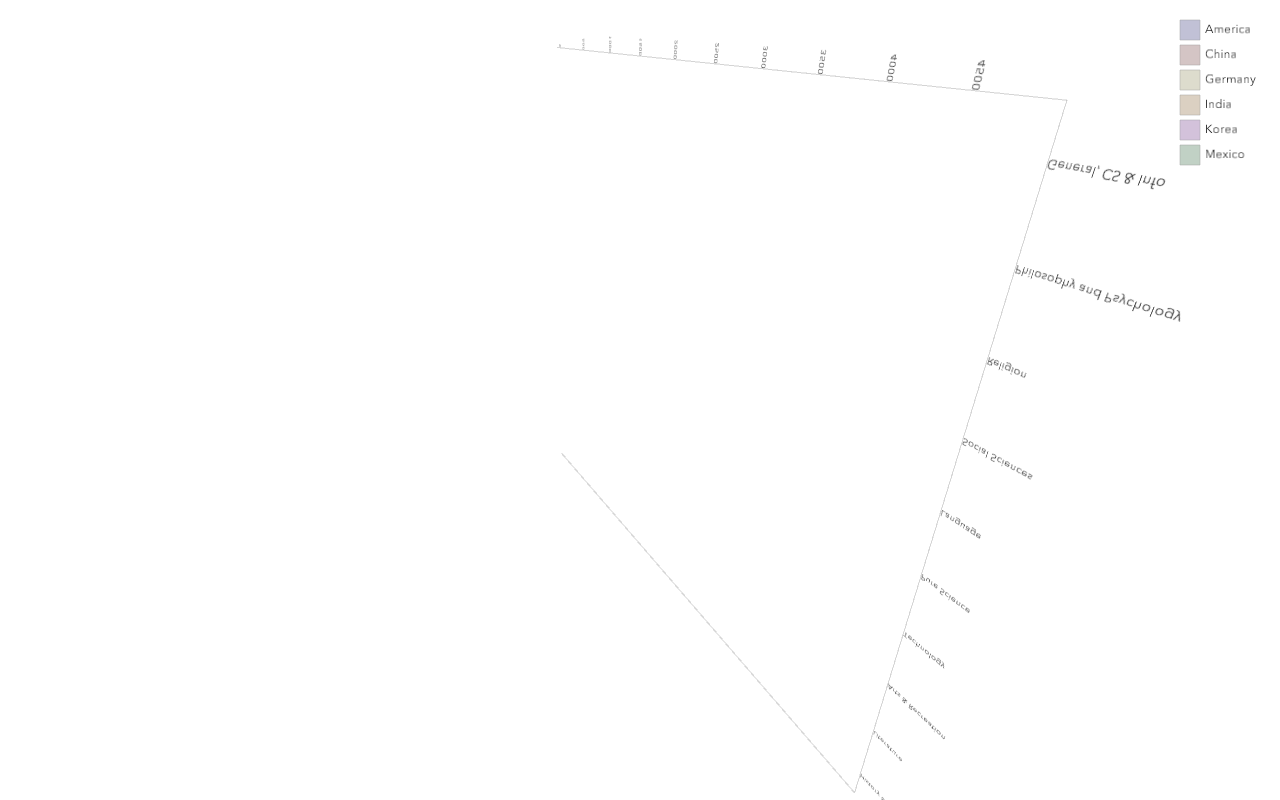
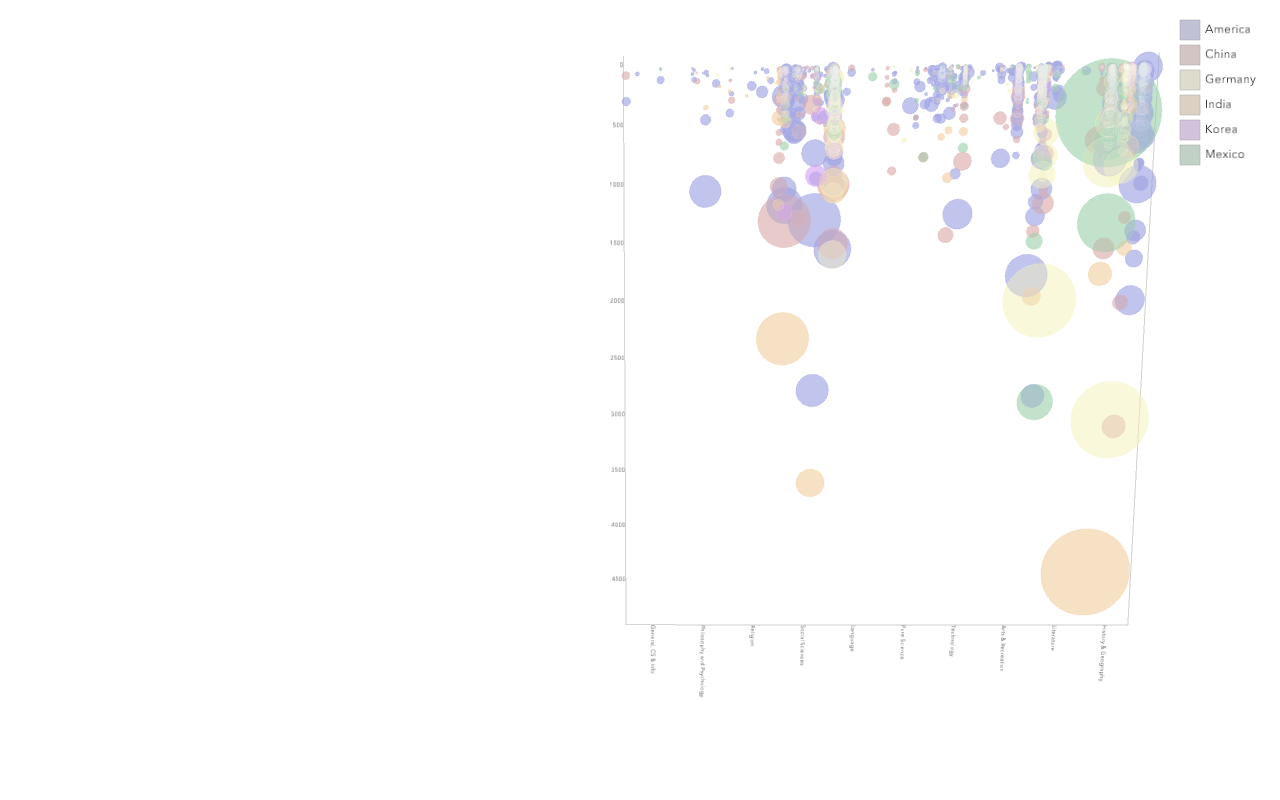
Each book is projected on a virtual plane in circular shape, where the radius indicates the copies of the book. The two axises of the virtual plane represents dewey category and checkout counts of the books. All the books are applied with six different colors for six different countries. And the books from the same countries are connected by the same color of arcs in the z axis. On the other direction of z axis, each book connects with its title and the length of the line represents the copies of the book as well.
Code
All work is developed within Processing
Hold the mouse to move around the whole 3D shape.
Source Code + Data
Hold the mouse to move around the whole 3D shape.
Source Code + Data