Book 1970 - Reorder Matrix
MAT 259, 2015
Rodger (Jieliang) Luo
Concept
I'm still very interested of the books being "checked out" at 1970-01-01. Since it was a kind of system error, then I'm curious about the reasons of the error. After exploring the database, I found some books in the "1970" category had been checked out several times, which means the system error occurred to these books every time they were checked out, but didn't occur to the book being checked out before or after. Apparently, it doesn't look like coincidence. Therefore, this data visualization is trying to dig out more information of those books.
Query
SELECT
COUNT(inraw.itemNumber) AS NumberOfTimes,
FLOOR(inraw.deweyClass / 100) * 100 AS Dewey,
title
FROM
spl2.inraw
WHERE
cout = '1970-01-01'
GROUP BY itemNumber
HAVING (COUNT(itemNumber) > 1)
ORDER BY NumberOfTimes DESC
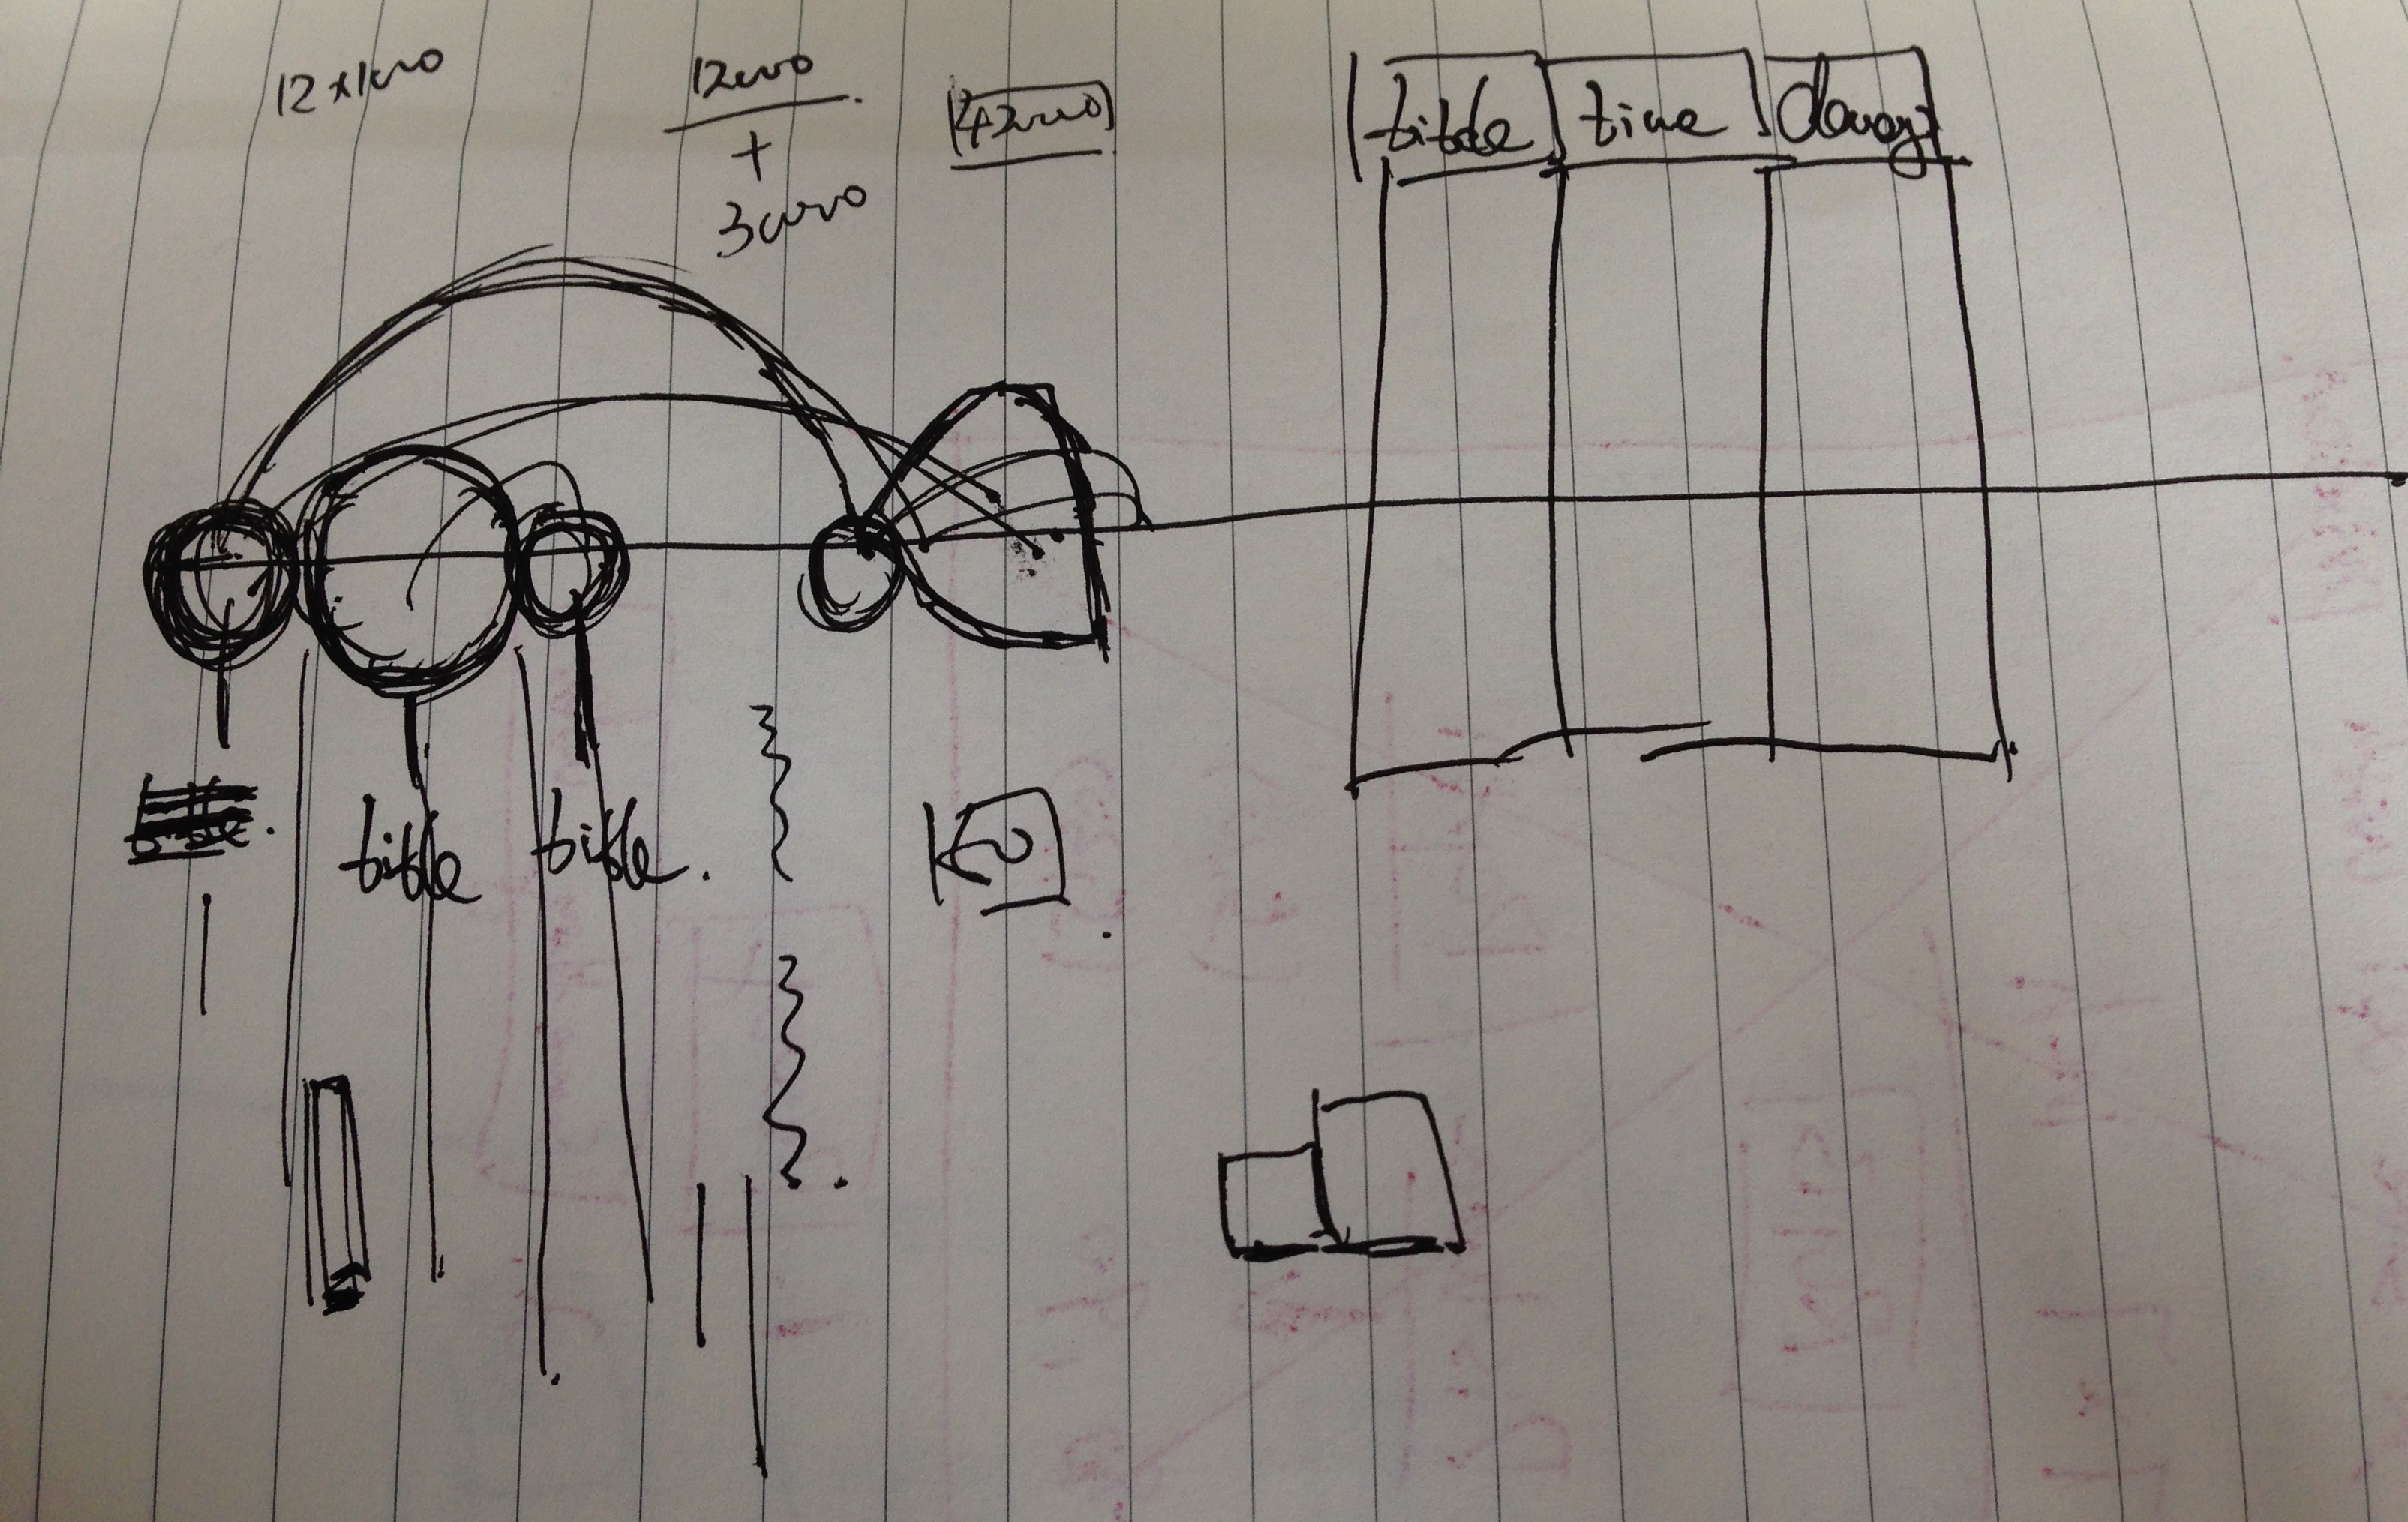
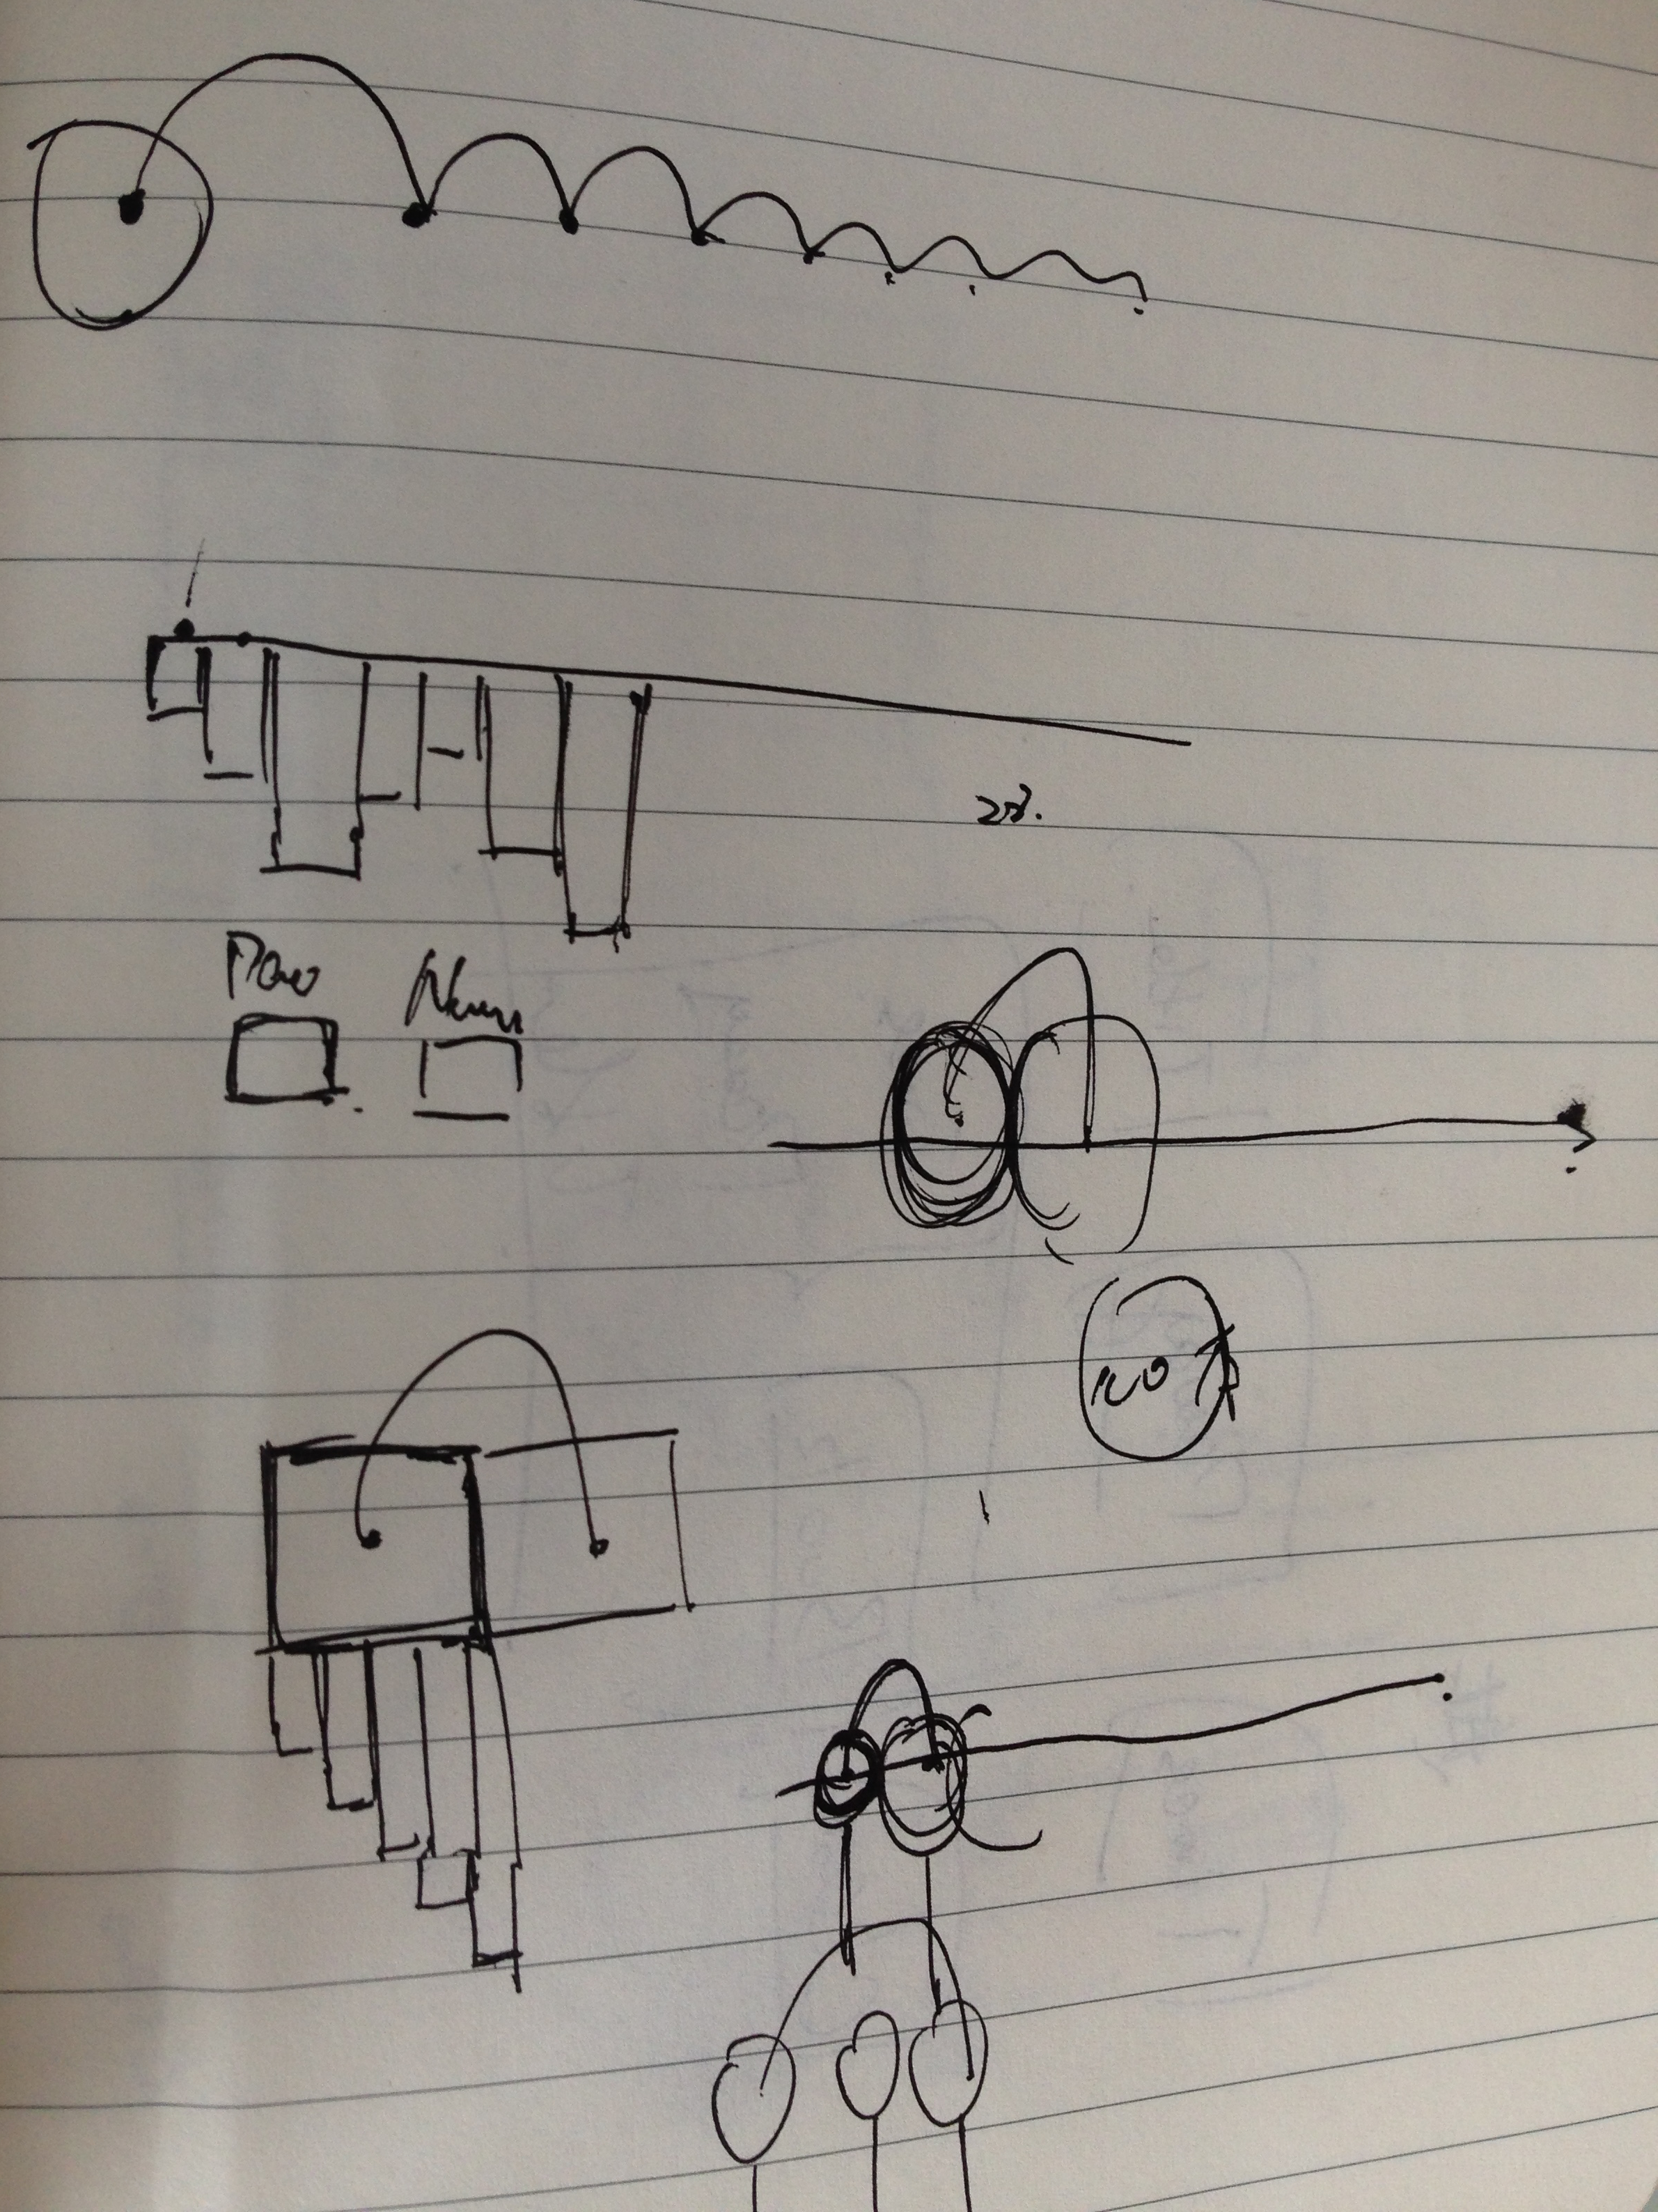
Preliminary sketches
Arc diagram is a very interesting data visualization form to present inner connections among data. If each book is drawn as a circle, then the color and radius of the circle can represent two attributes of the data, which functions like x-y axises in the traditional 2d matrix.
Process
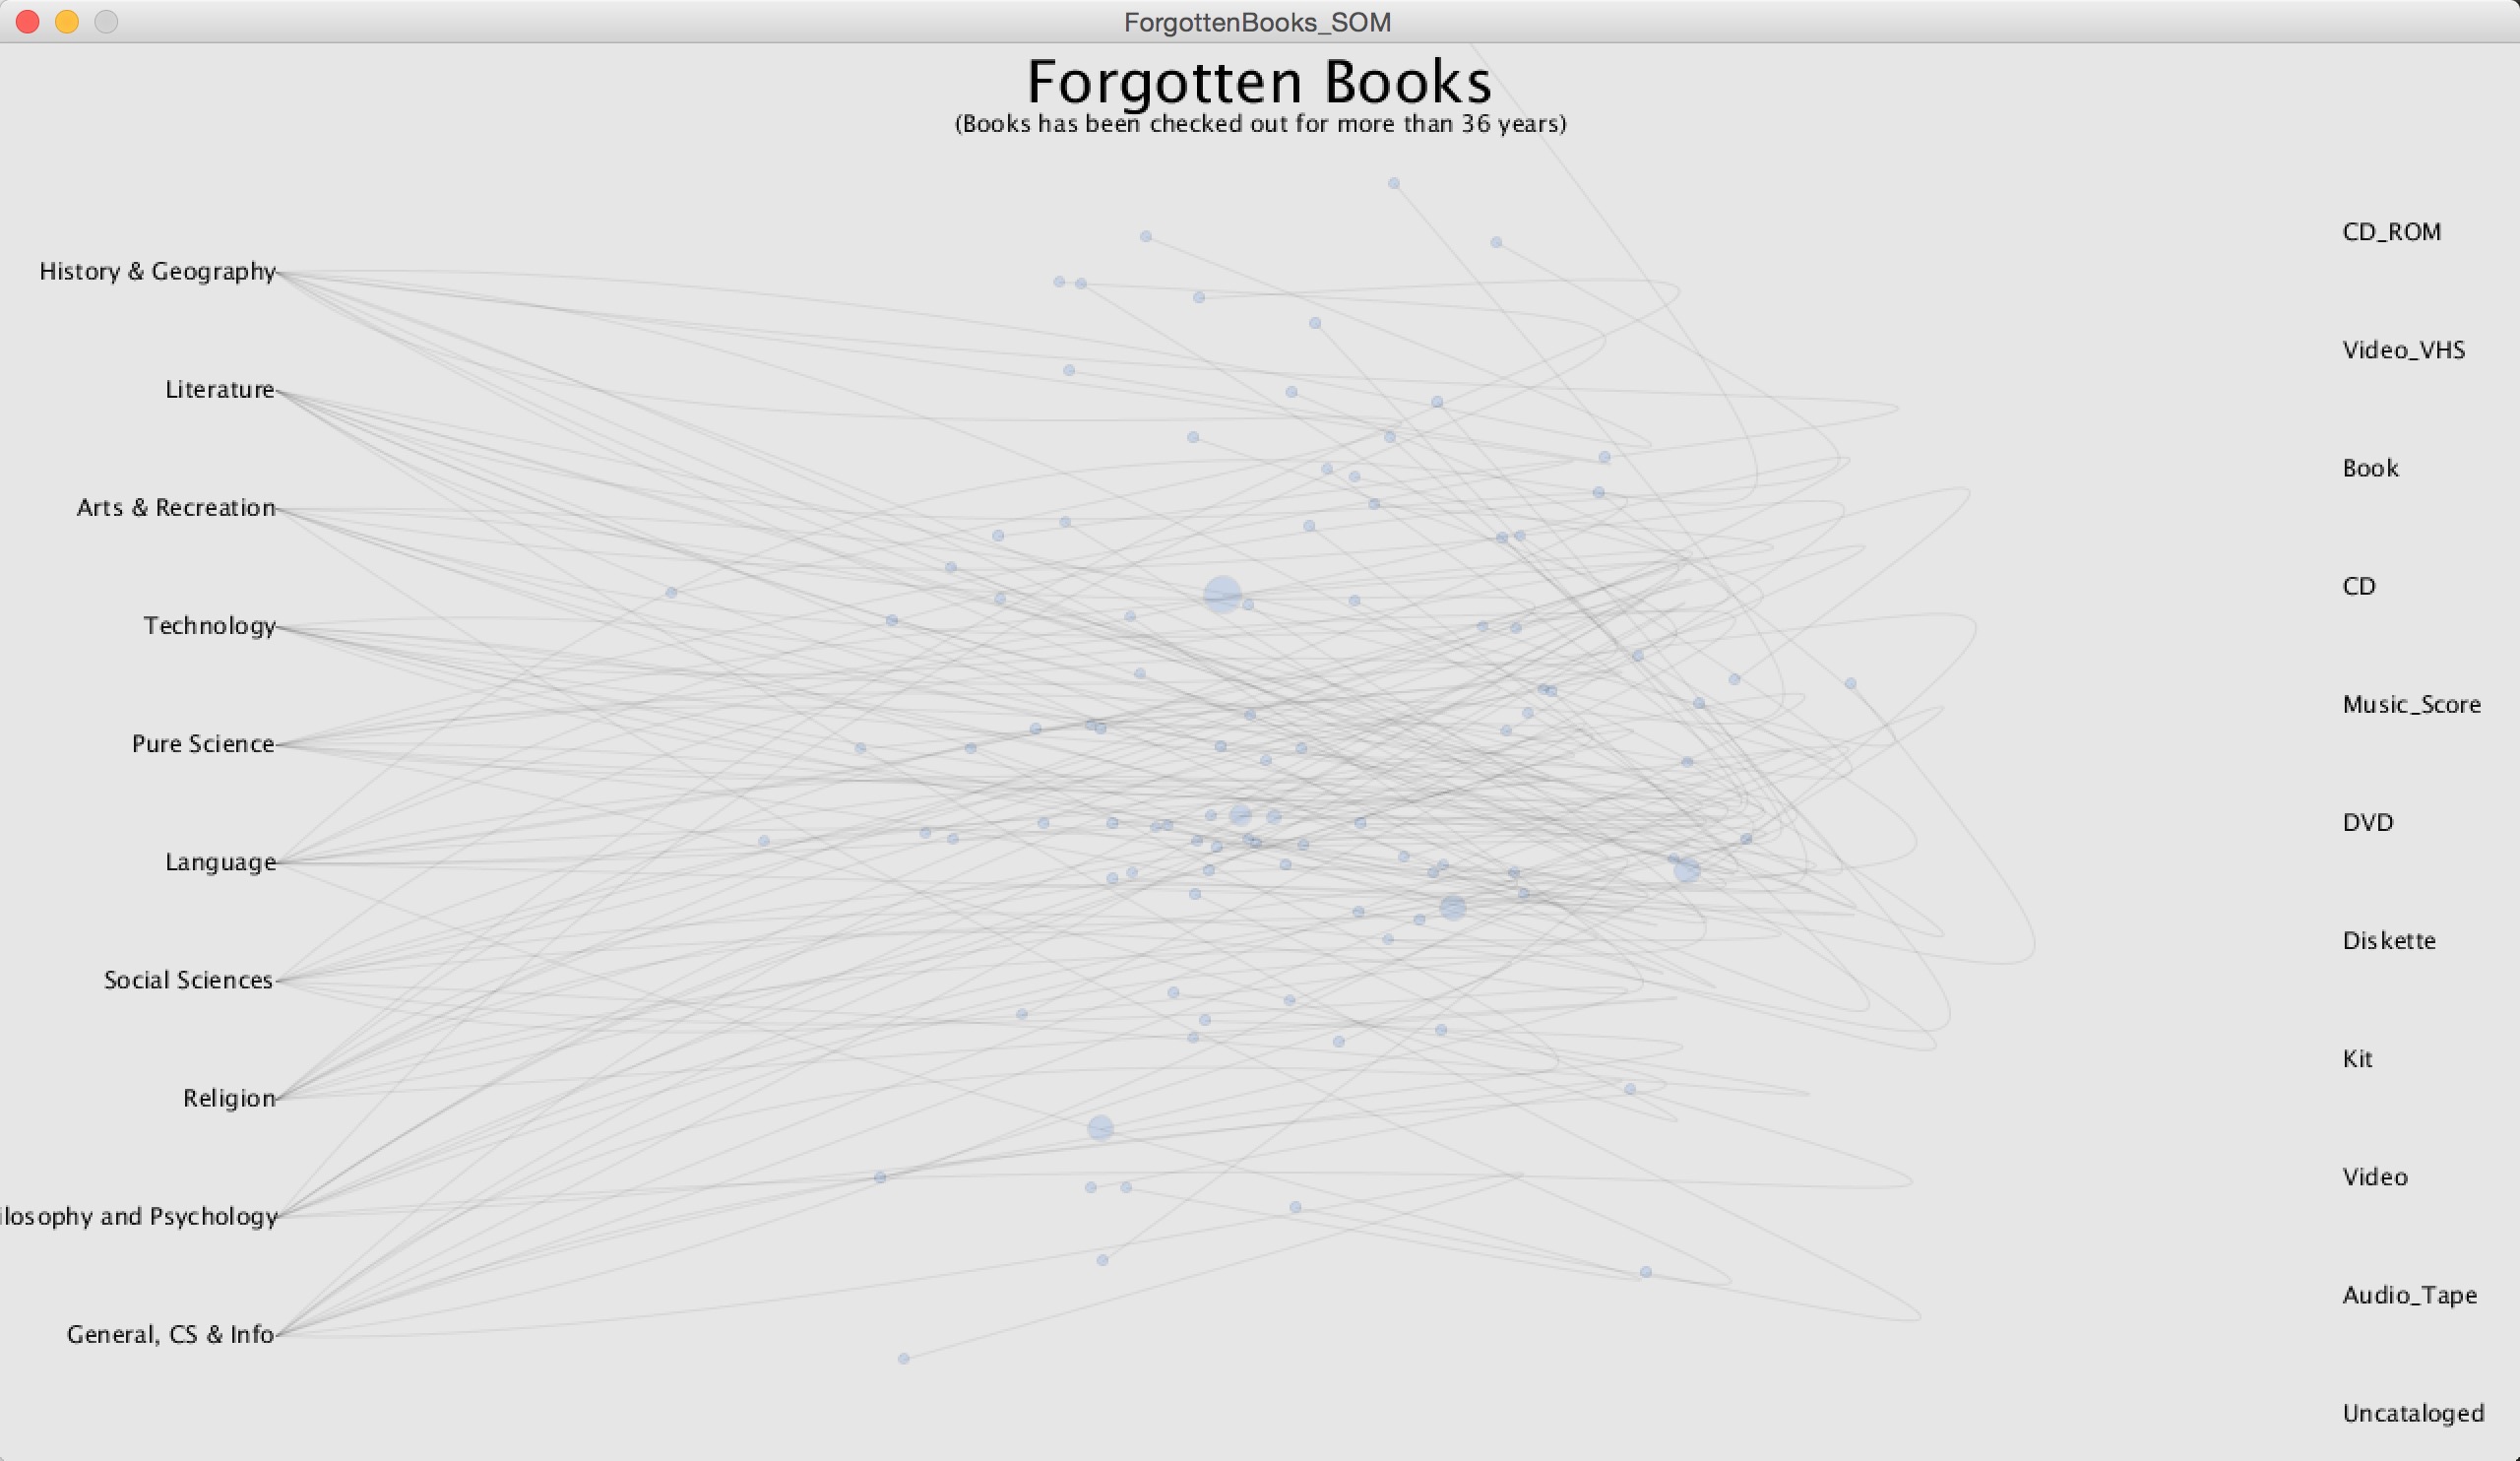
As a matter of fact, the initial attention of this project was to design a self-organizing map based on the the first project, Forgotten Books. However, it didn't look visually interesting.
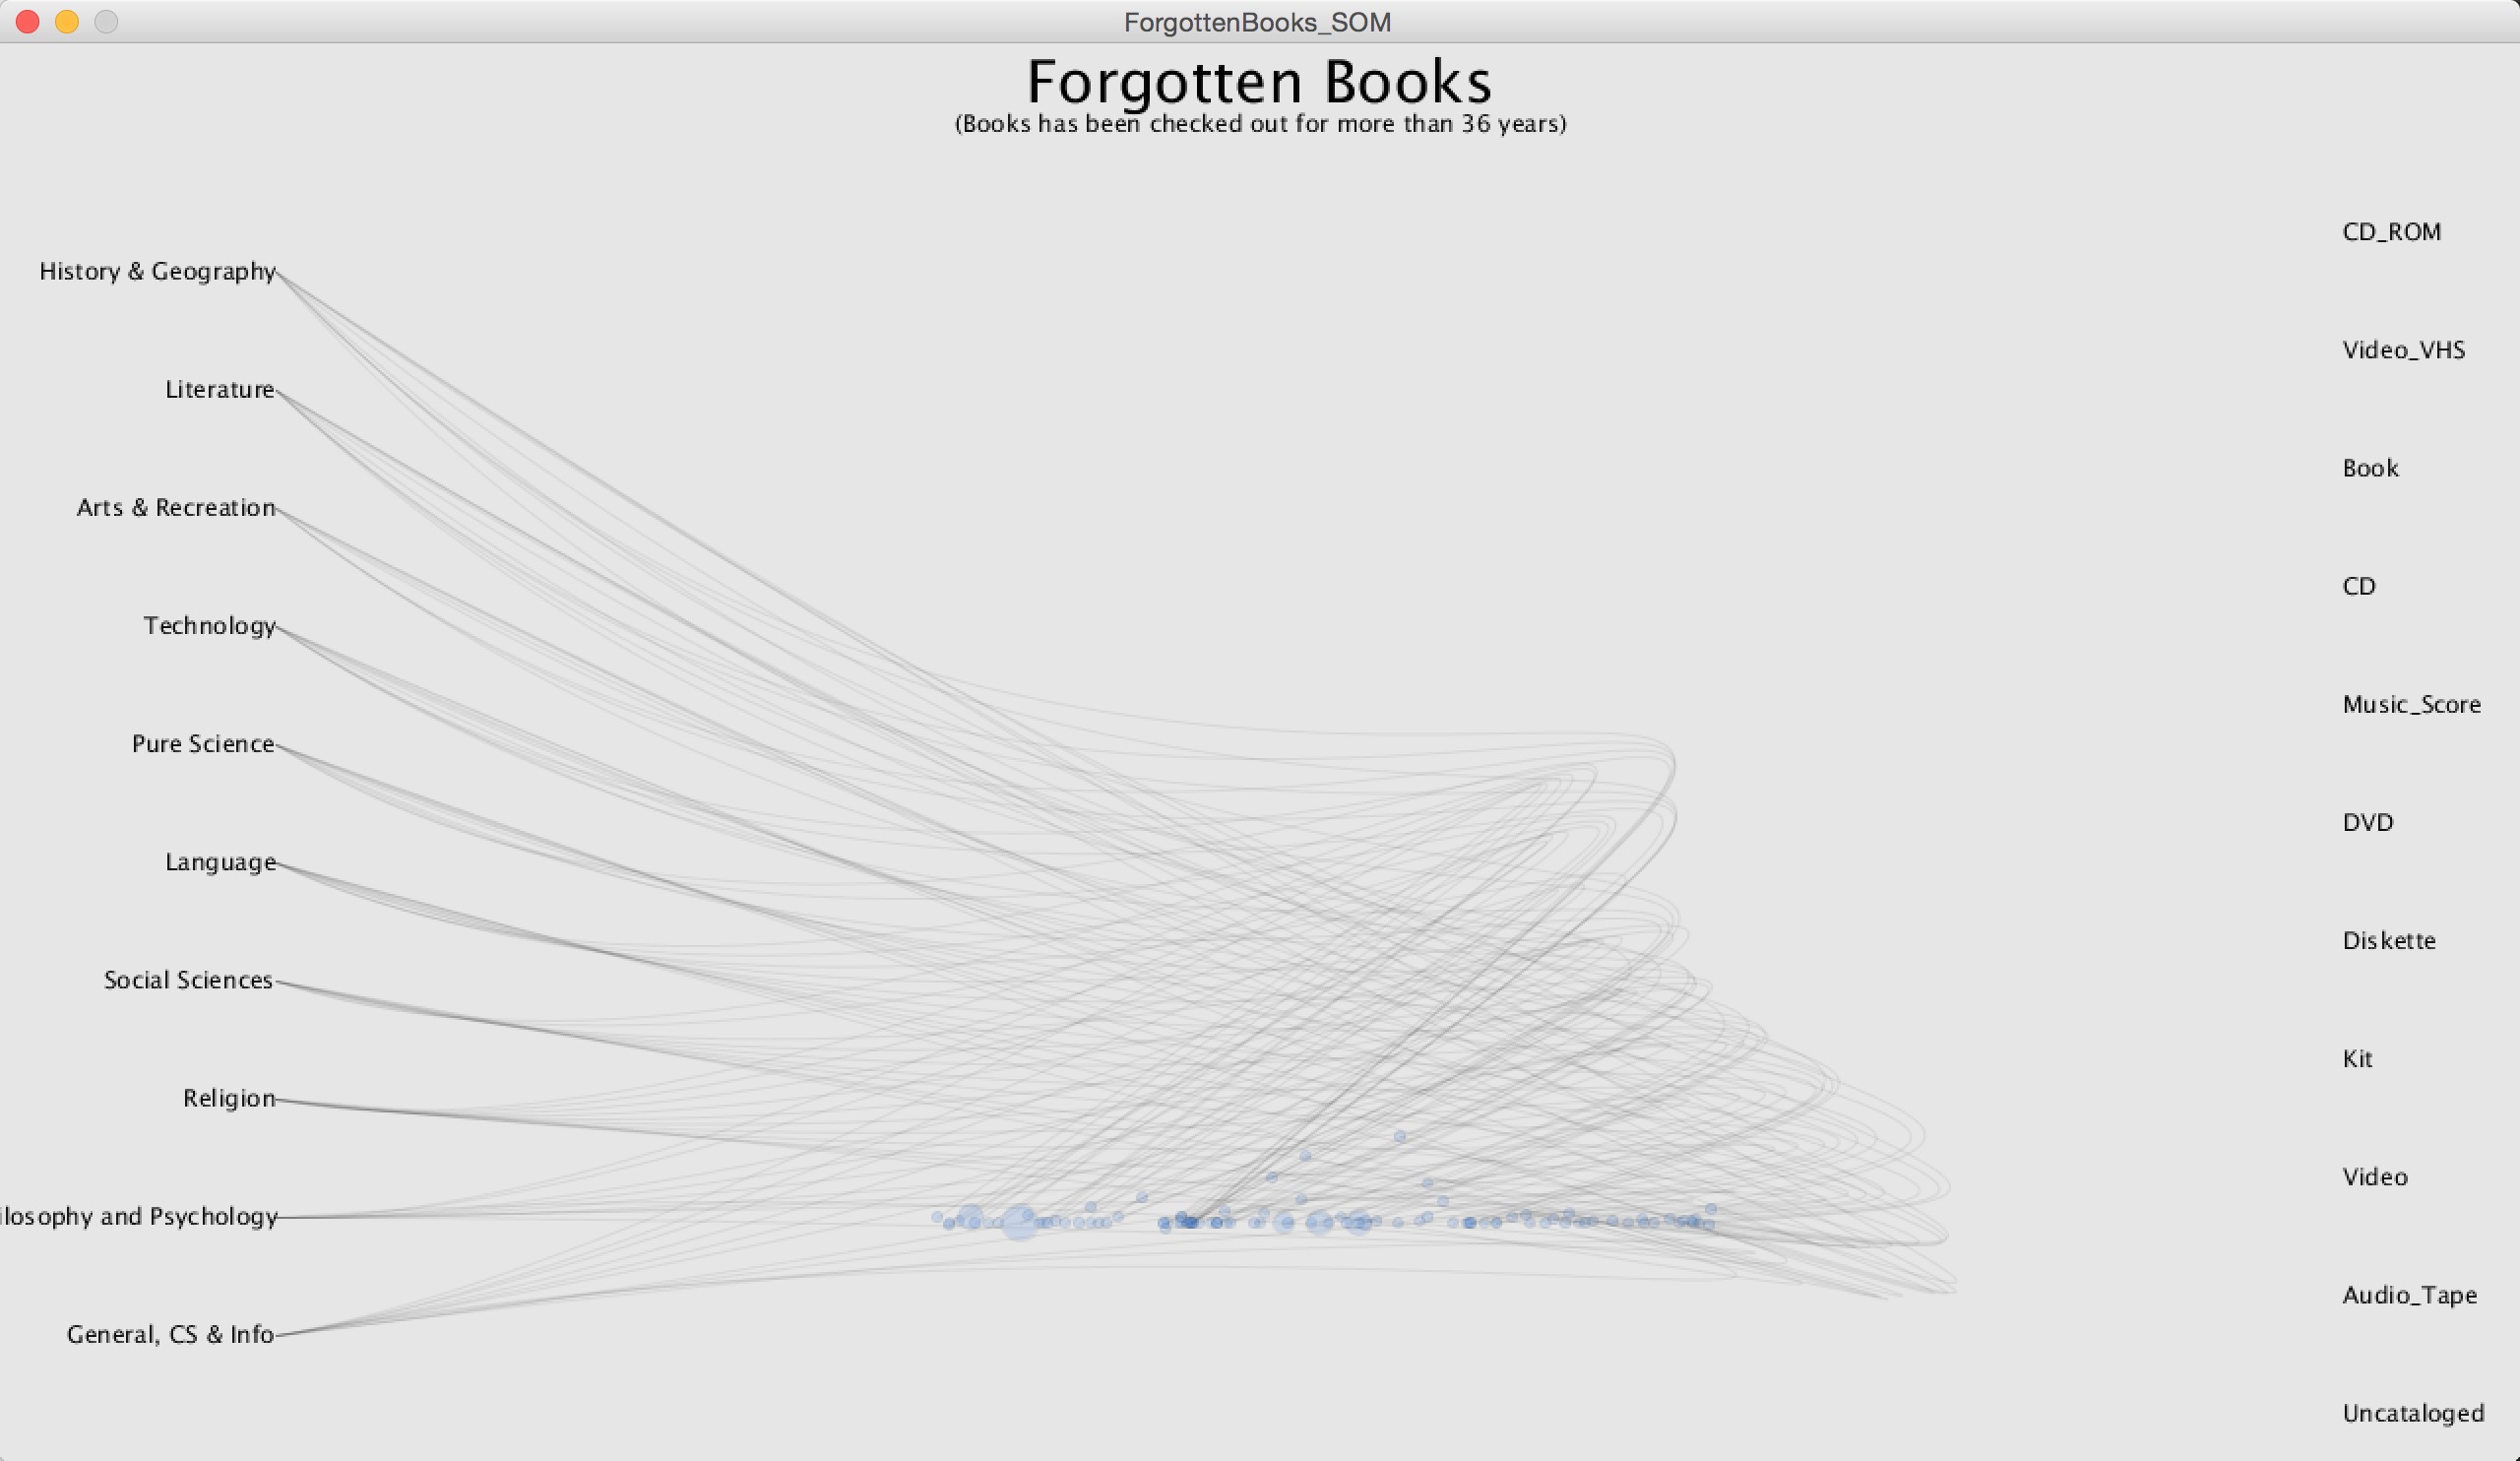
Be inspired by the above image of all the circles horizontally aligned and were connected with arcs, it's not a bad idea to reorder the matrix as an arc form.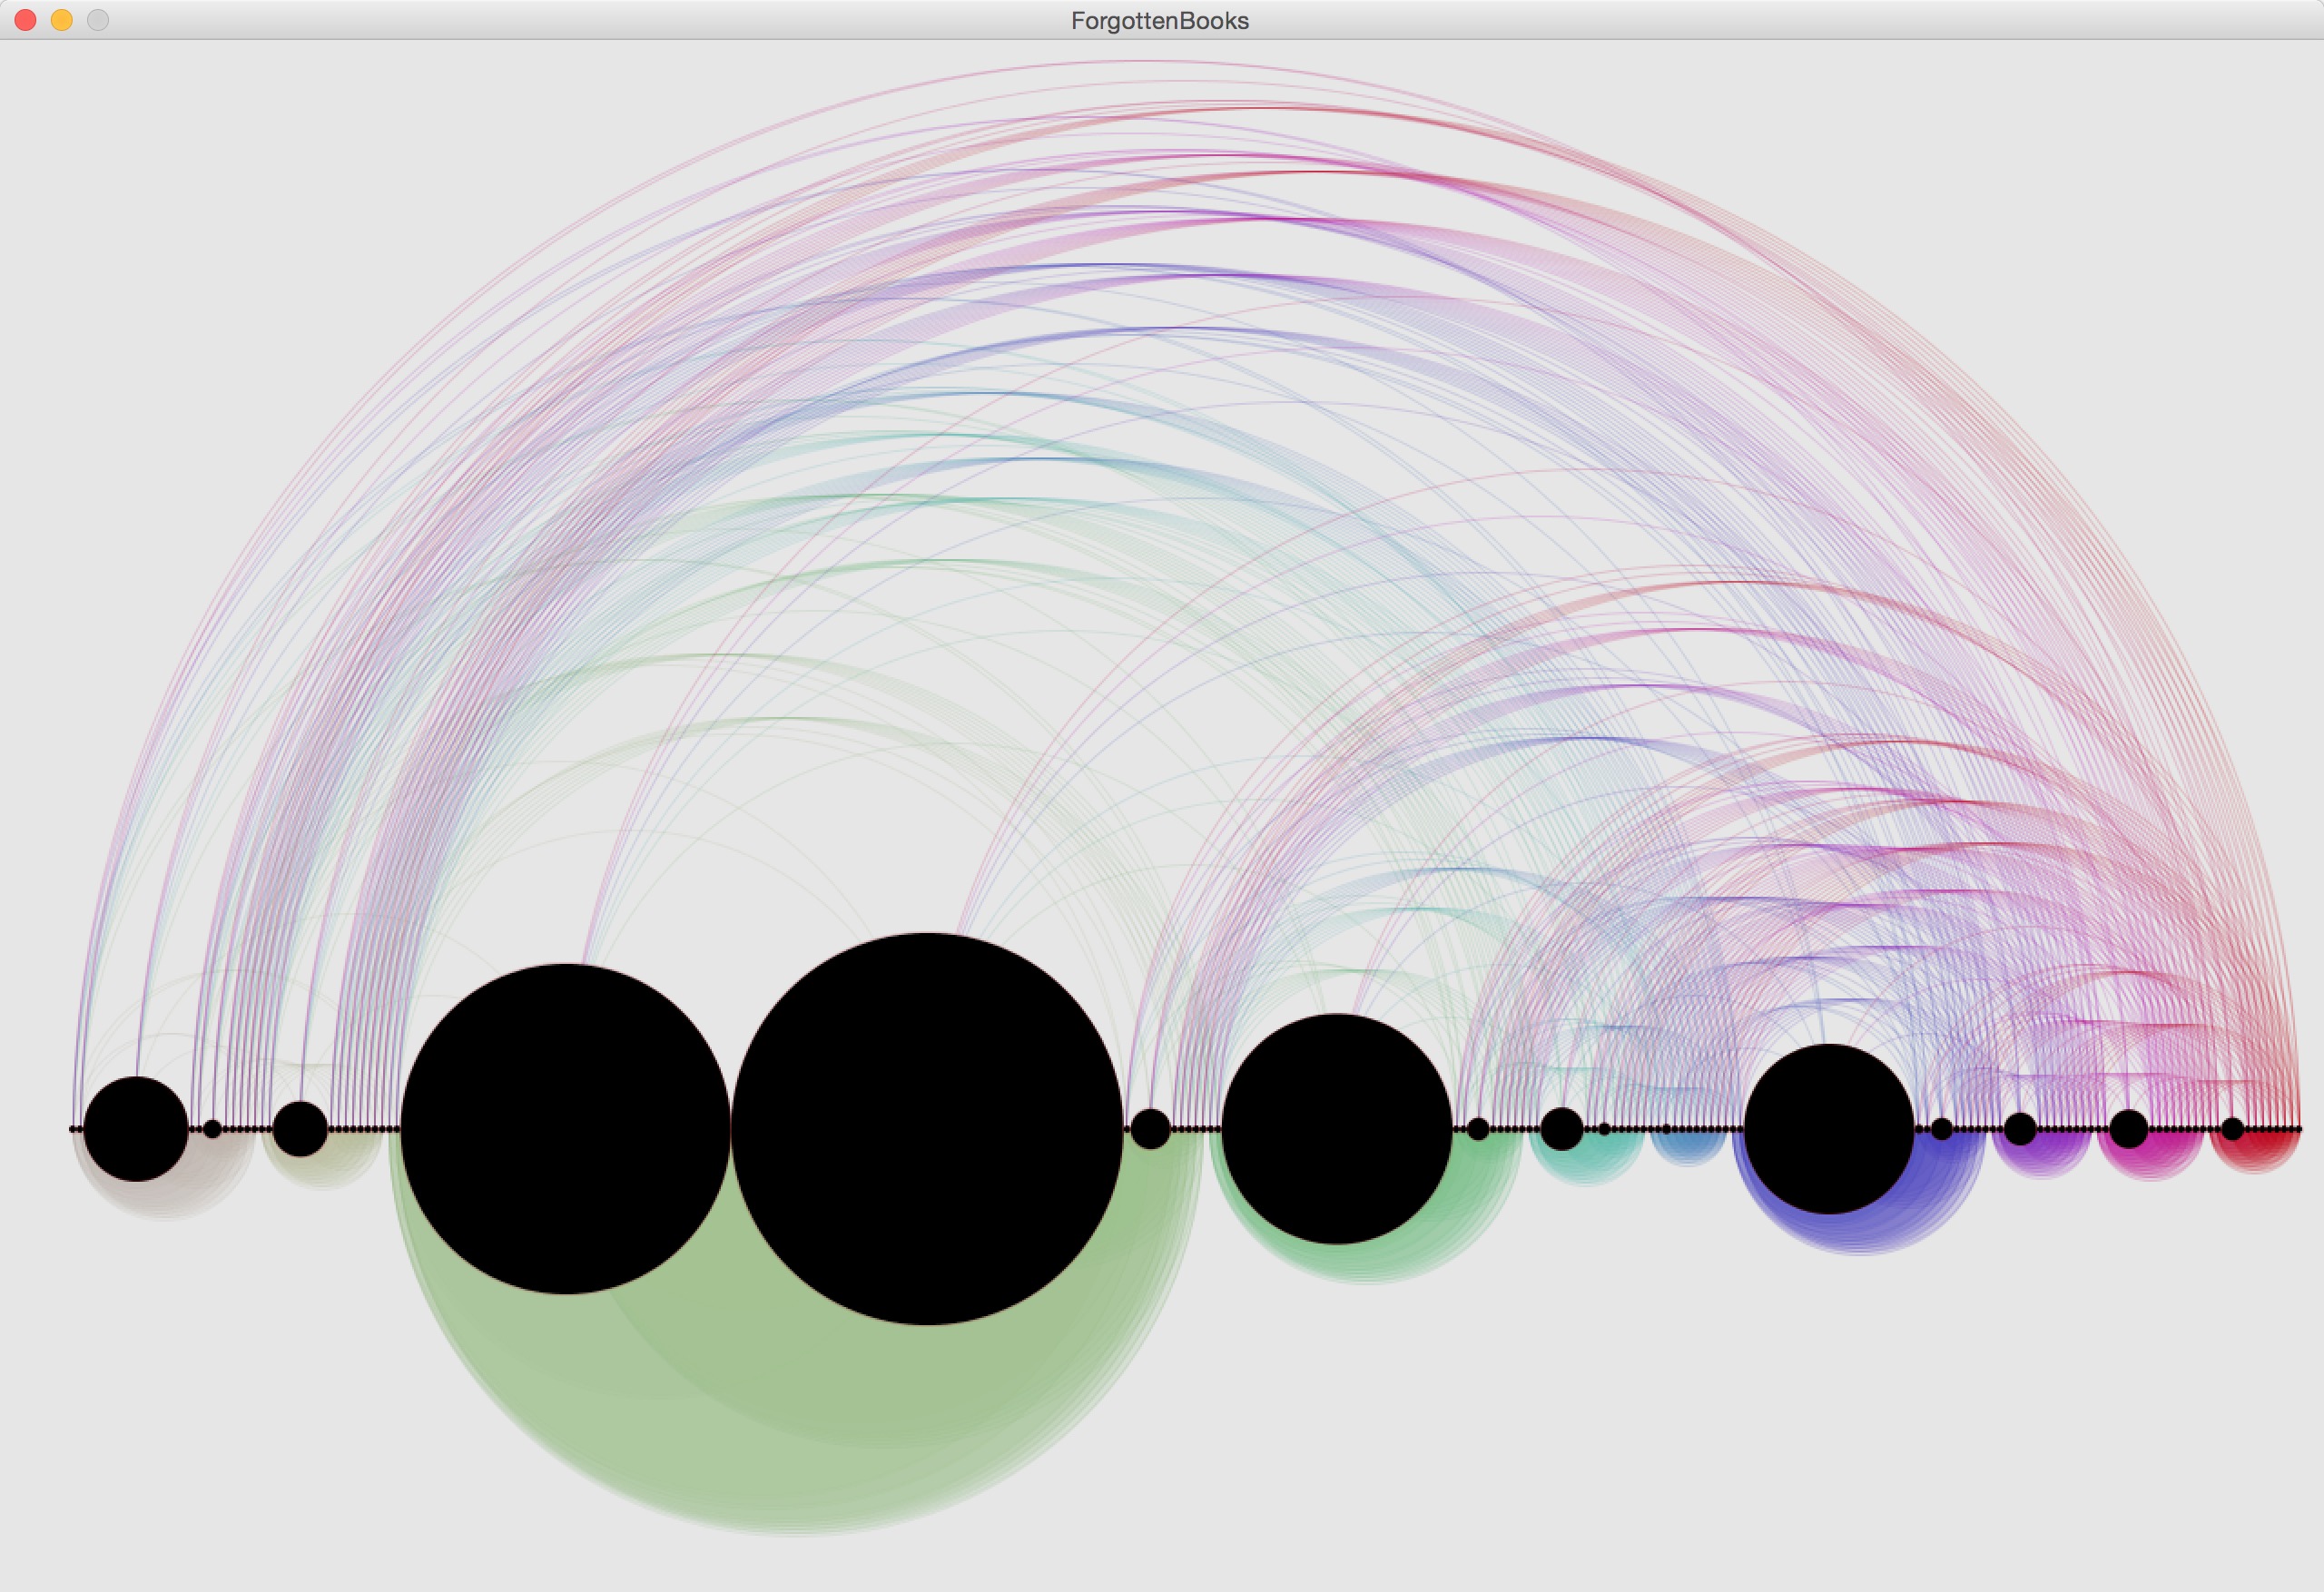
Be inspired by the above image of all the circles horizontally aligned and were connected with arcs, it's not a bad idea to reorder the matrix as an arc form.
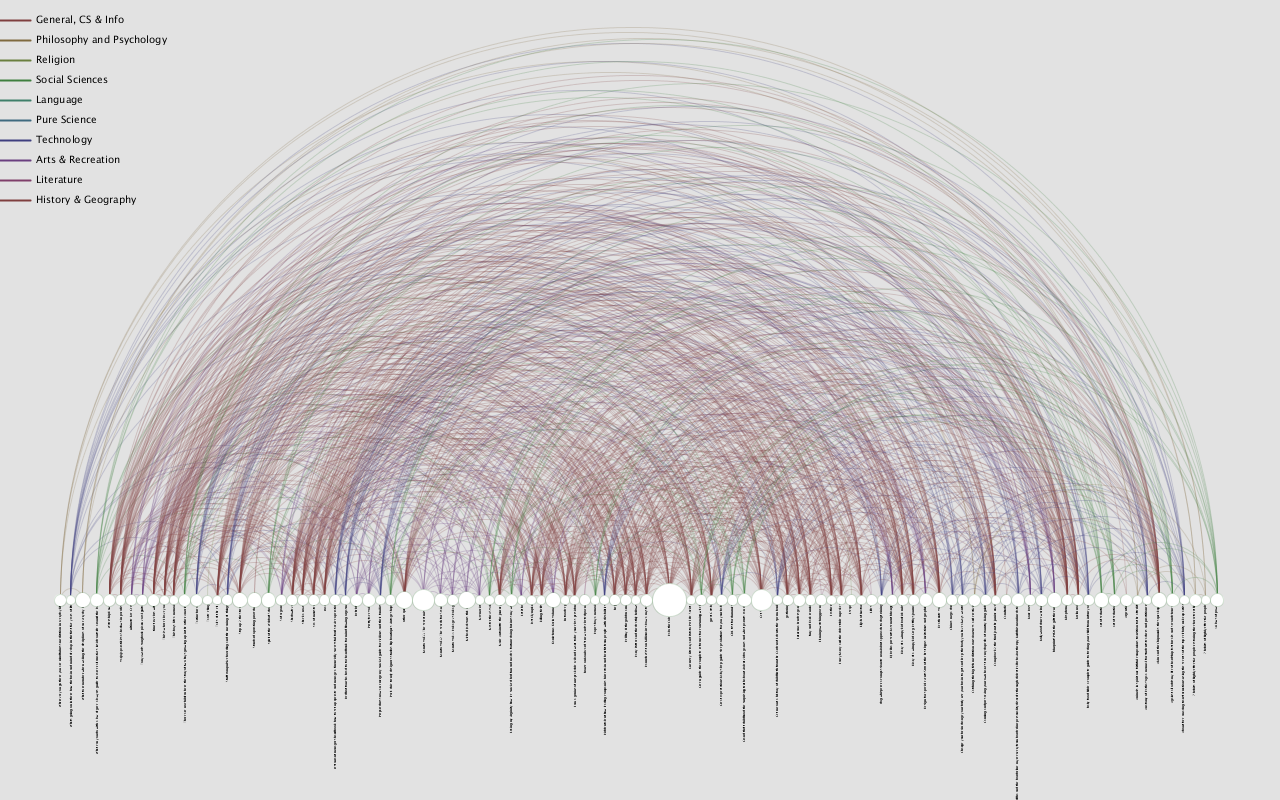
Final result
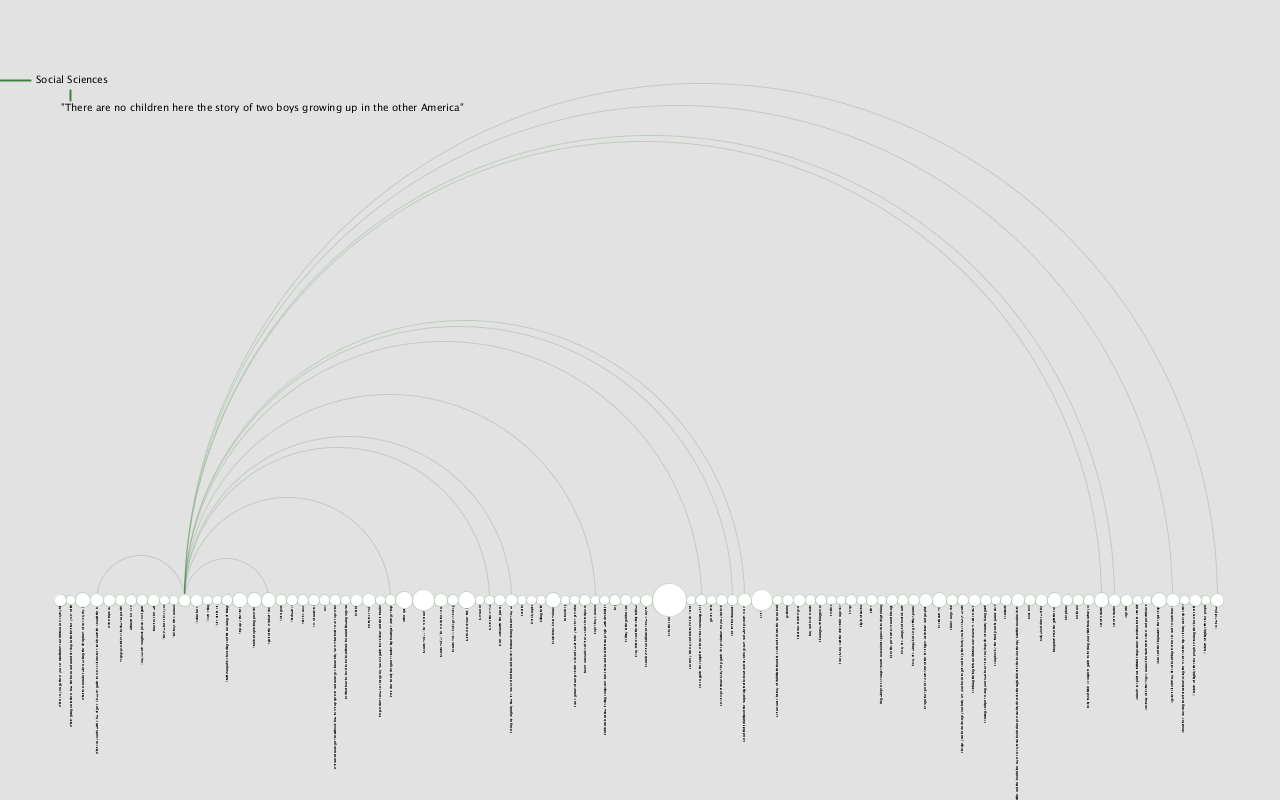
Each circle on the lower area represents a book. The bigger the circle, the more checked out times it has. If two circles share the same Dewey class, then they are connected with an arc. And different colors represent different Dewey classes. The visual elements below the circles are the titles of the books. They are not very readable, but I think they are visually interesting and balance the layout.
When mouse hovers on a circle, it will filter out the books with the same dewey category of the hovering book. And the upper left corner will present details of the hovering book as well.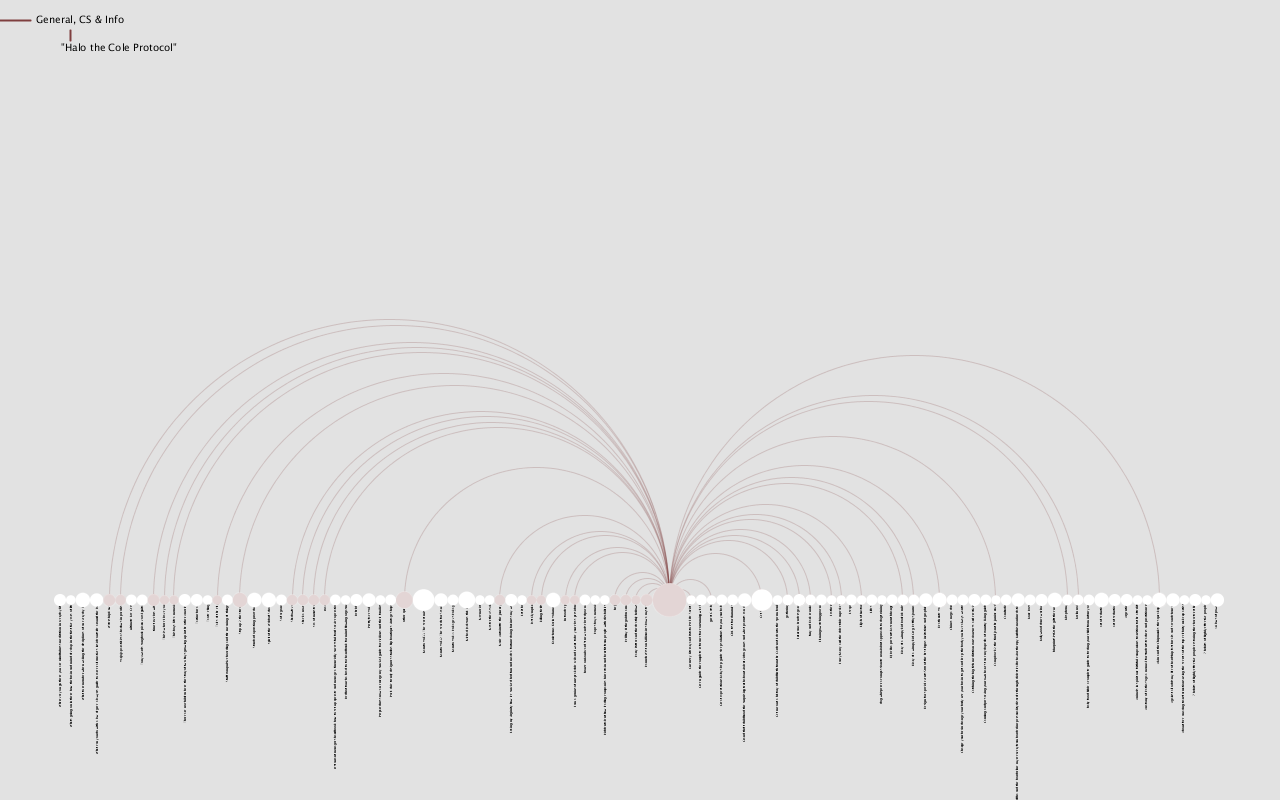
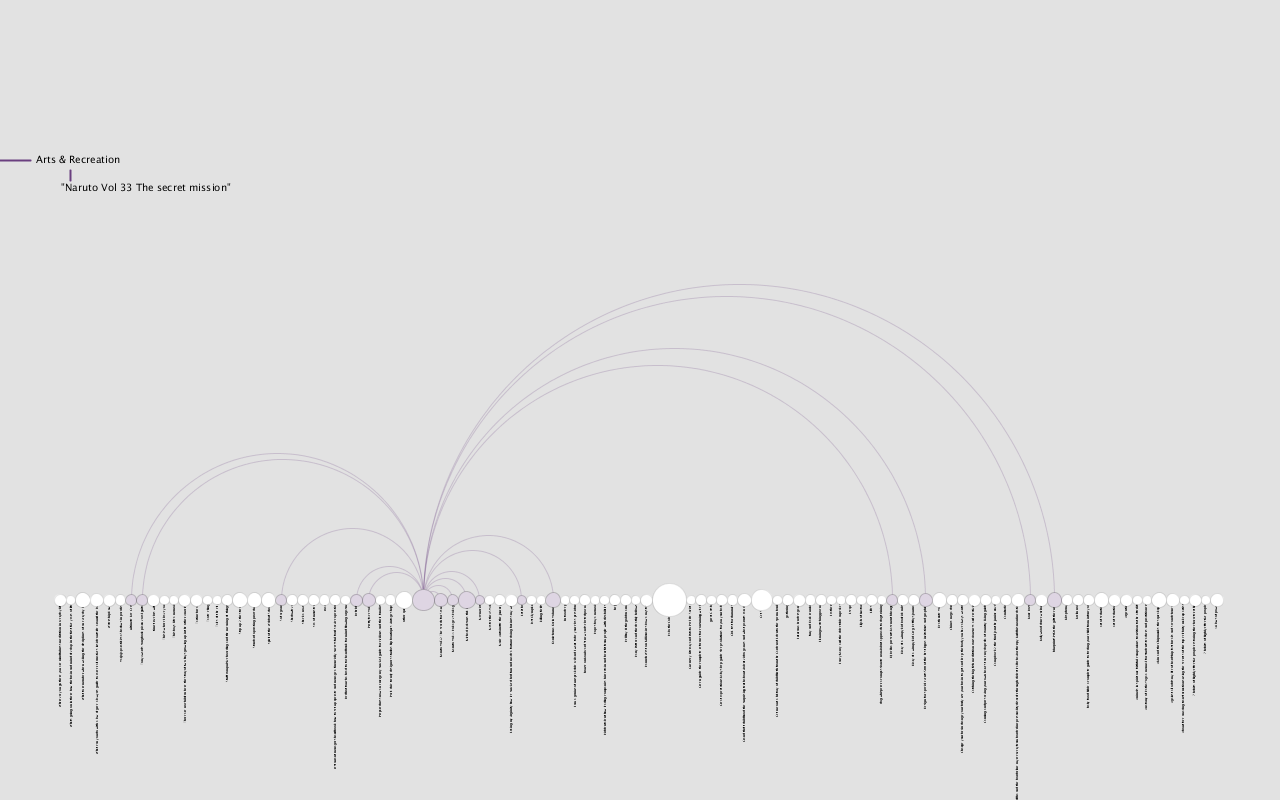
When mouse hovers on a circle, it will filter out the books with the same dewey category of the hovering book. And the upper left corner will present details of the hovering book as well.
Code
All work is developed within Processing
Move the mouse on each circle to see details of that book. Left click the mouse to see the overview.
Source Code + Data
Move the mouse on each circle to see details of that book. Left click the mouse to see the overview.
Source Code + Data