Natural Rejection
MAT 259, 2015
Kurt Kaminski
Concept
It is said that over 99% of all life that ever lived has gone extinct1. Thus it stands to reason that our current extant state is rather unusual. By visualizing extinct species from the Tree Of Life Web Project's phylogenetic database, an interactive sculpture becomes the foundation for a meditation on survival and permanence.
Query
The Tree Of Life Web Project database contains 94,300 nodes in a >200mb hierarchical XML file. Each node contains several data including its taxonomic name, how many child nodes it has, and whether it is extinct or not. There are other flags that might be worth exploring further, such as a measure of confidence of its placement on the tree. The data is freely available under an Attribution Creative Commons License. More information about the Tree Of Life Web Project, specifically details of its database, can be found here:
http://tolweb.org/tree/home.pages/downloadtree.html
To parse the XML file, I wrote a pre-order tree traversal algorithm that loops through each node, looking for child and sibling nodes until it finishes. In pseudocode, the query looks something like this, where the function readNode calls itself if child nodes exist:
void readNode( parent_XML_node[ ] ) {
int number_of_children = parent_XML_node.length;
for ( int i = 0; i < number_of_children; i++ ) {
[[ perform maths here to figure out position of next branch and check if it's extinct ]]
XML children [ ] = getChildren(parent_XML_node[i]);
if ( children.length > 0) readNode(children[ ]);
}
}
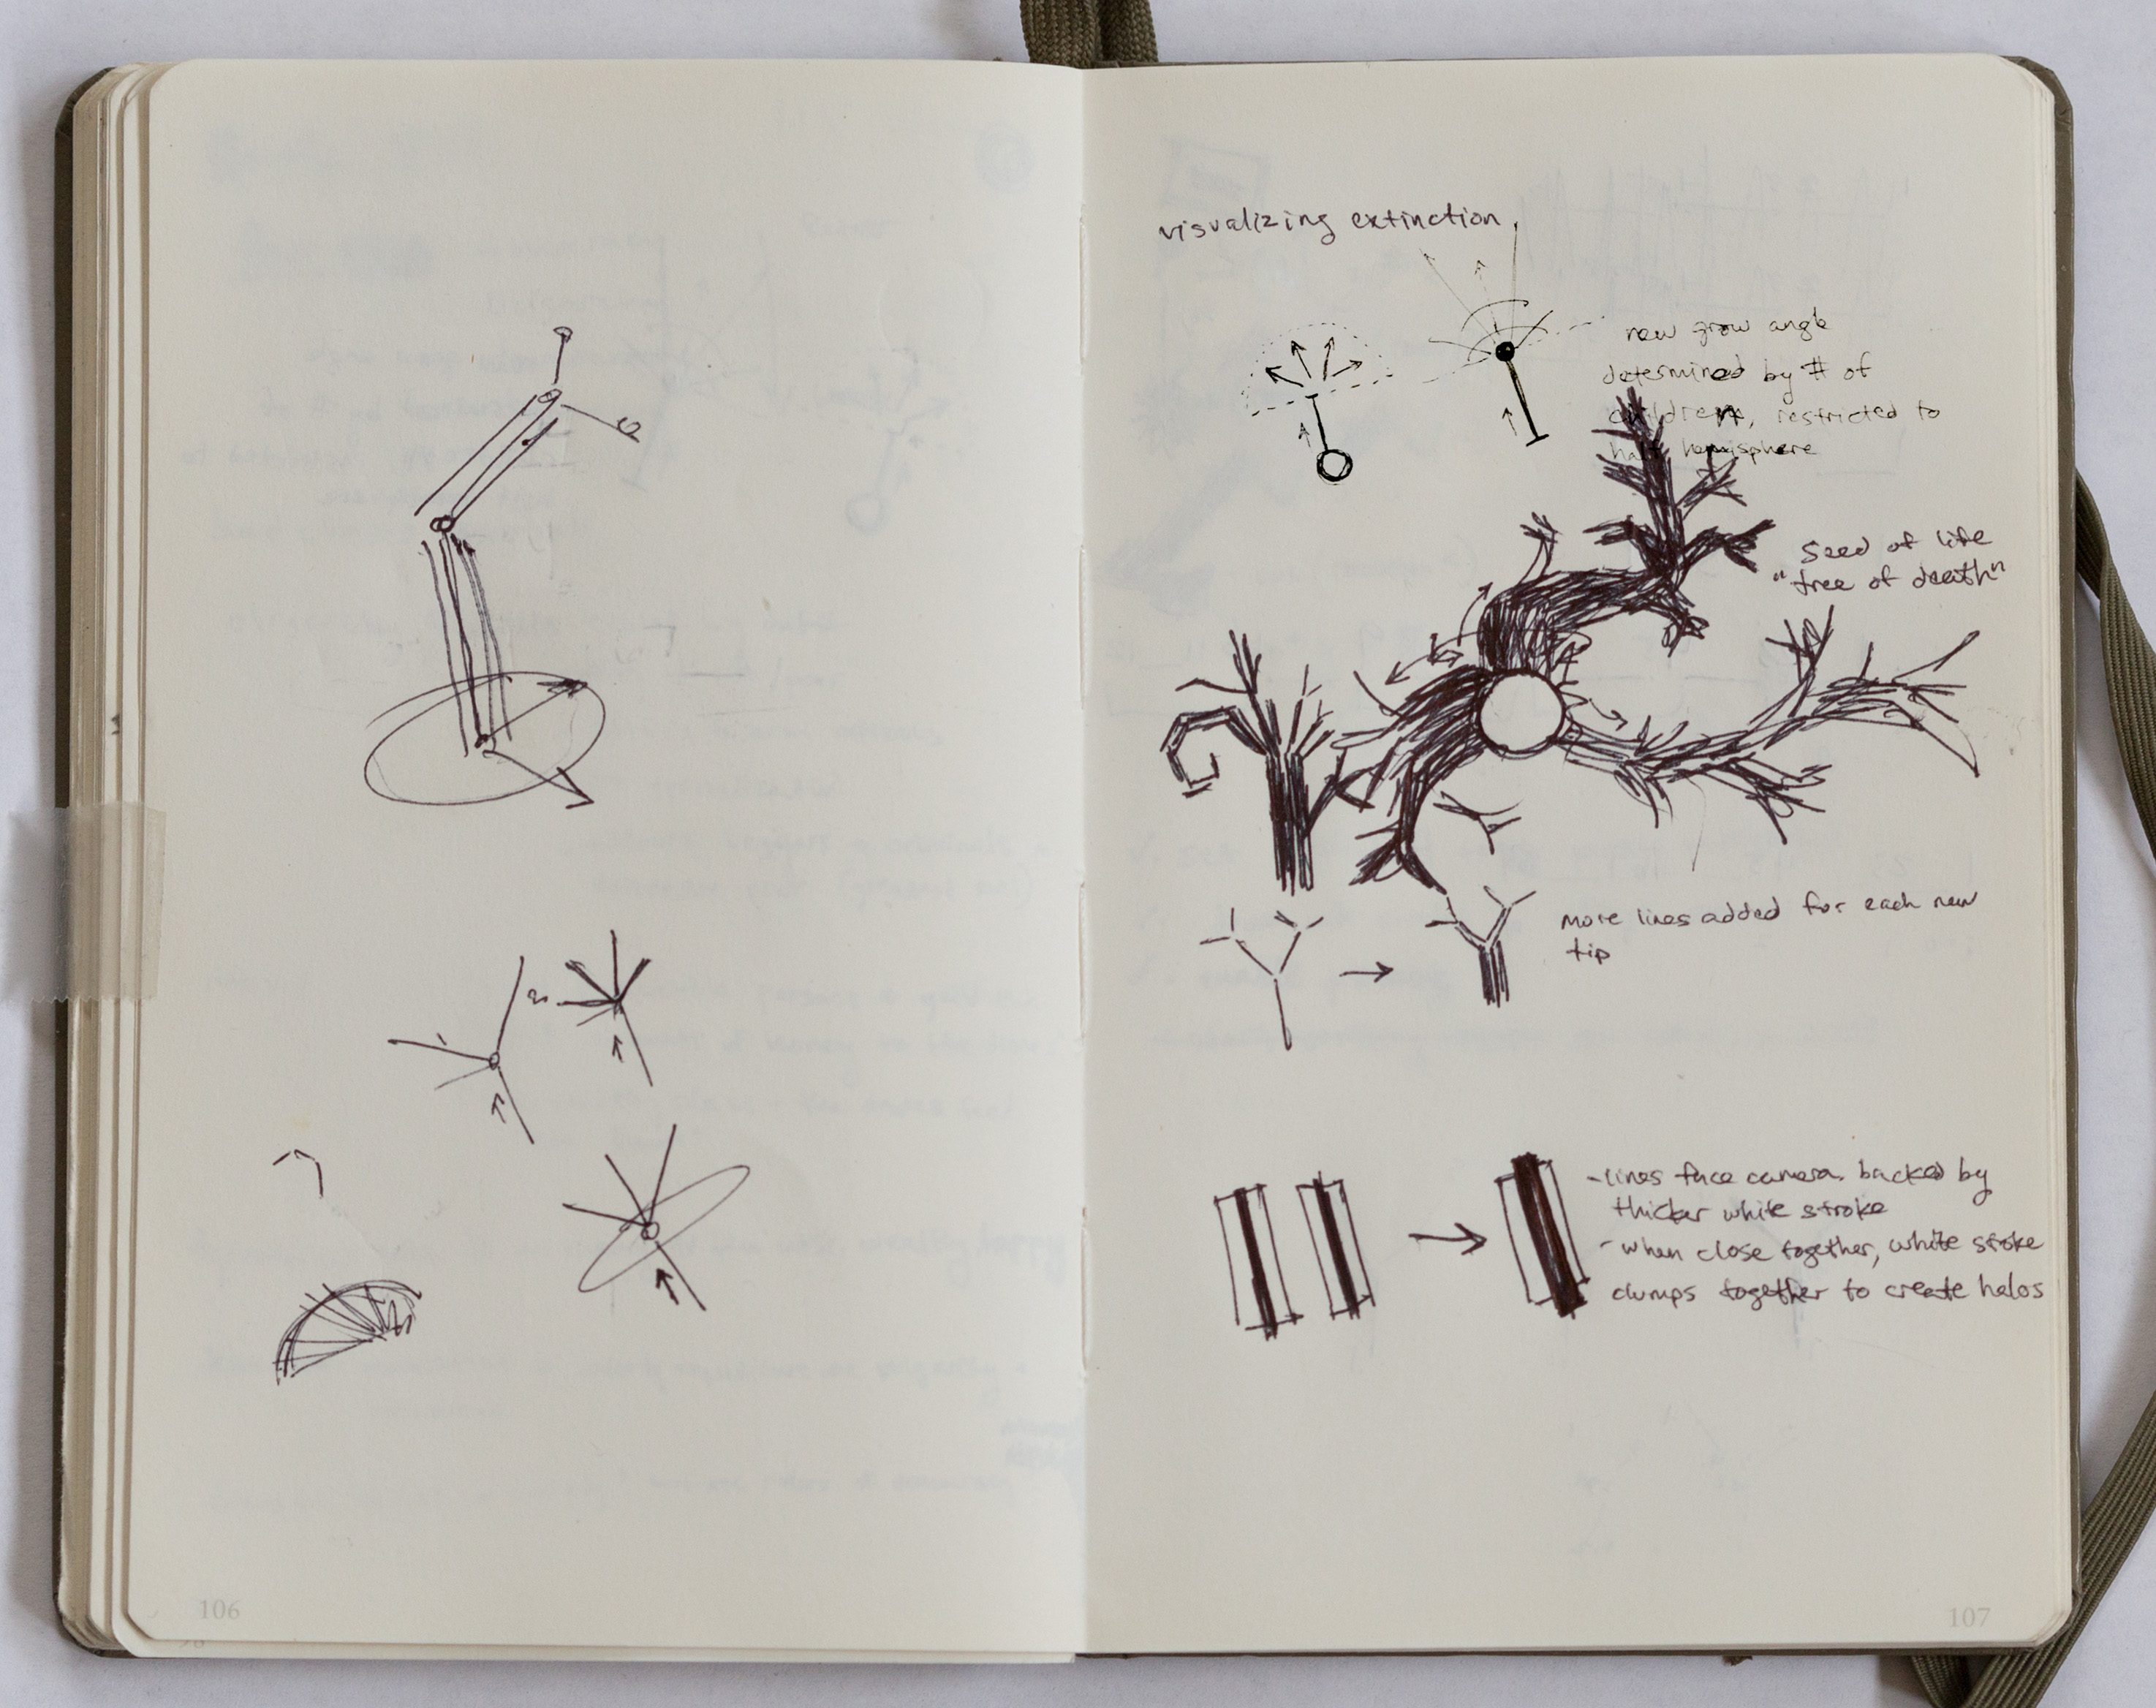
Preliminary sketches
Early in the project, I became attracted to Charles Darwin's simple "tree of life" diagram from his notebook. I was curious if there was a way to elegantly create a tree of life in 3D. After more searching, I came across the beautiful and useful "Depth-dependent halos" described by Tobias Isenberg et. al.2. With these two points of inspiration, I began sketching ideas about the rules for the branches, how bundles of paths might build up over generations, and how depth-dependent halos might be implemented.

Process
As I continued to develop the project, the program became increasingly complex. The following is a summary of my road to completion.
During traversal of the XML object, an array of Branch objects is created. Each Branch object has knowledge of its worldspace position, grow direction, number of children, taxonomic name, and its parent branch. The angle, and thus vertex position, of the next branch is determined stochastically by the number of children it has, how deep in the tree it resides, and some degree of randomness.
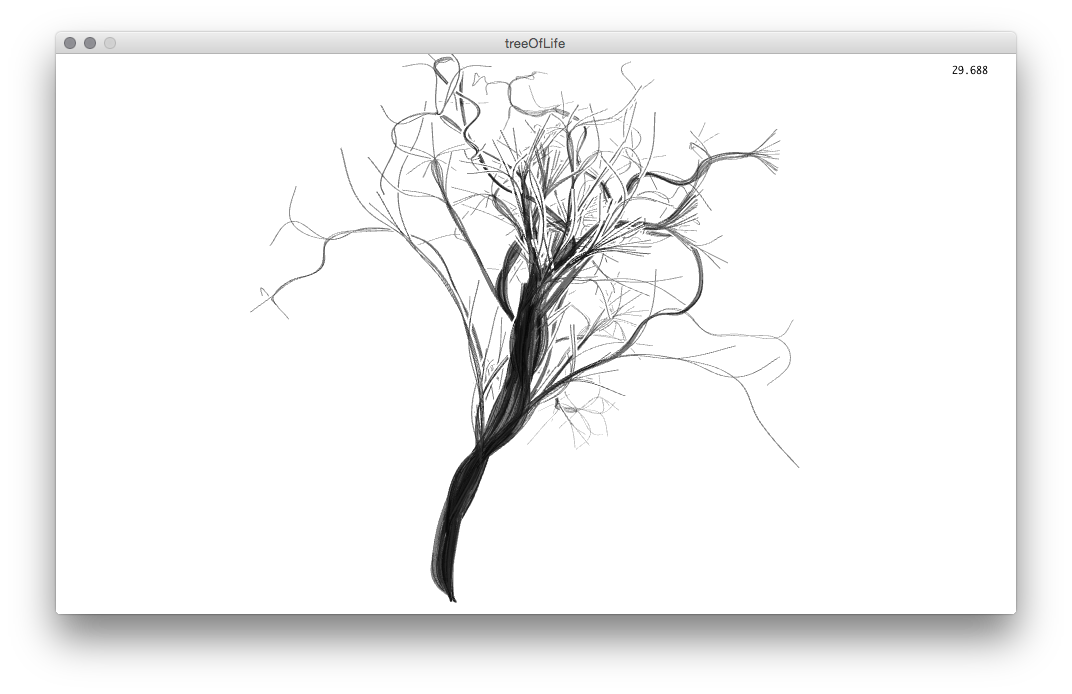
With this information, I then loop through the Branch array to construct a 3d mesh for visualization. To visualize the entire tree of all species (not just extinct ones), I simply look at each Branch and save a vertex at its position in a vertex buffer object. Since this mesh is not closed, I decided to render it using OpenGL's "LINES" method which requires two unique vertices to describe a line. There are 188600 vertices in the tree of life.
A smaller test case was used in many of these early images. The node for Harpalinae, a type of beetle, was used which contains about 1200 children in total.
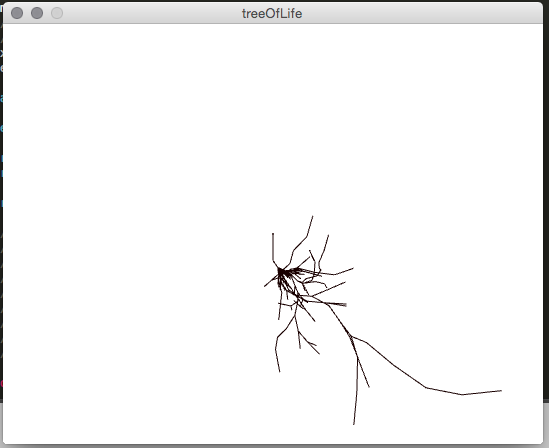
The first successful branching structure.
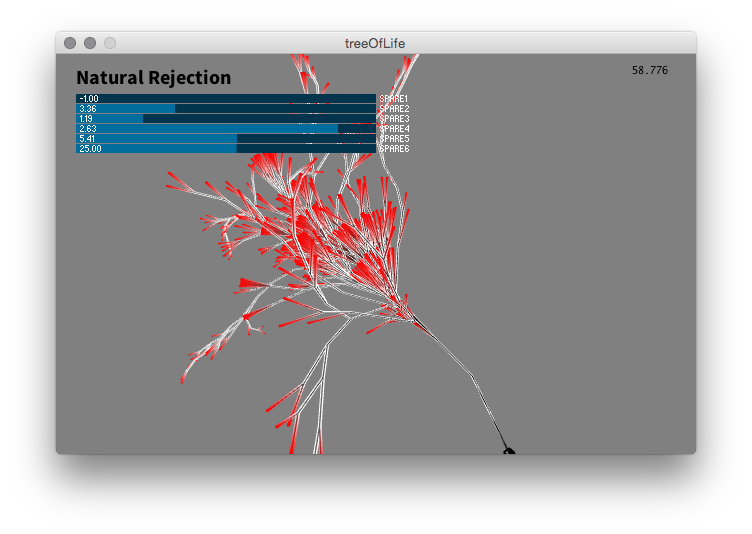
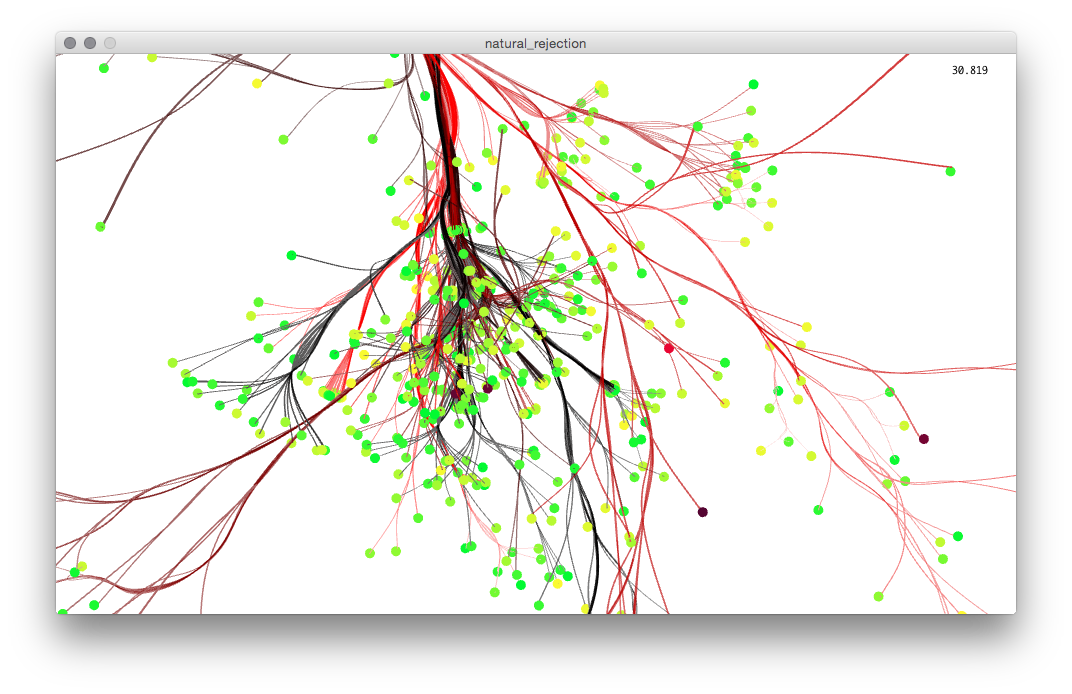
An early interactive version where controls were made to adjust trigonomic values relating to how the tree takes shape over generations. Color was initially used to aid in understanding the algorithm. Here, red is used to highlight the end points of branches.
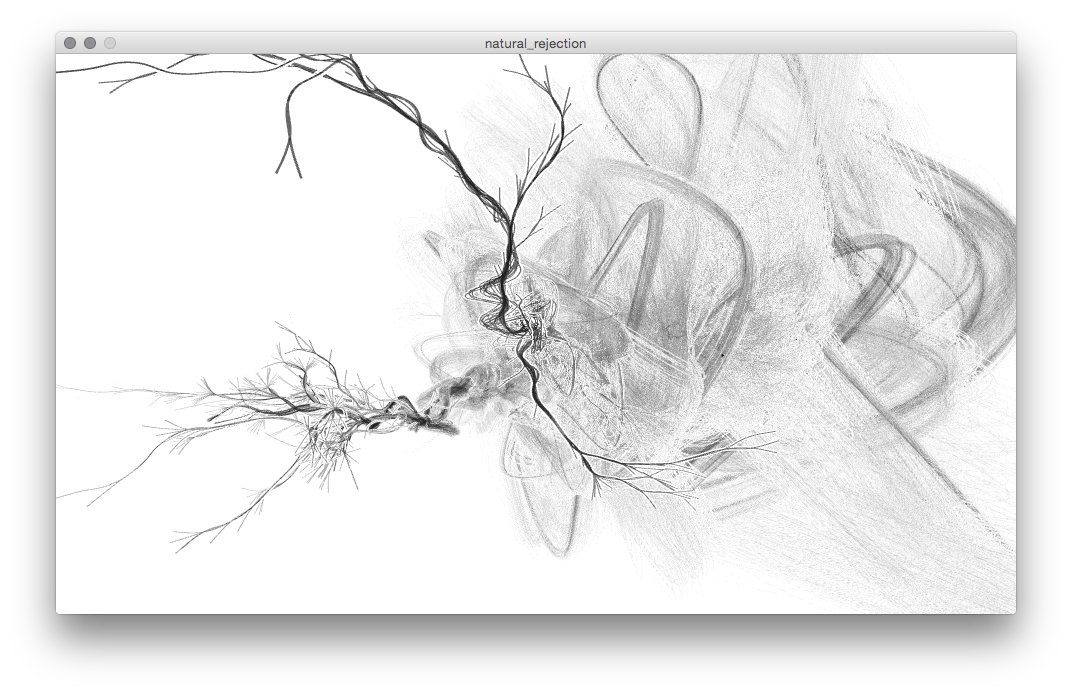
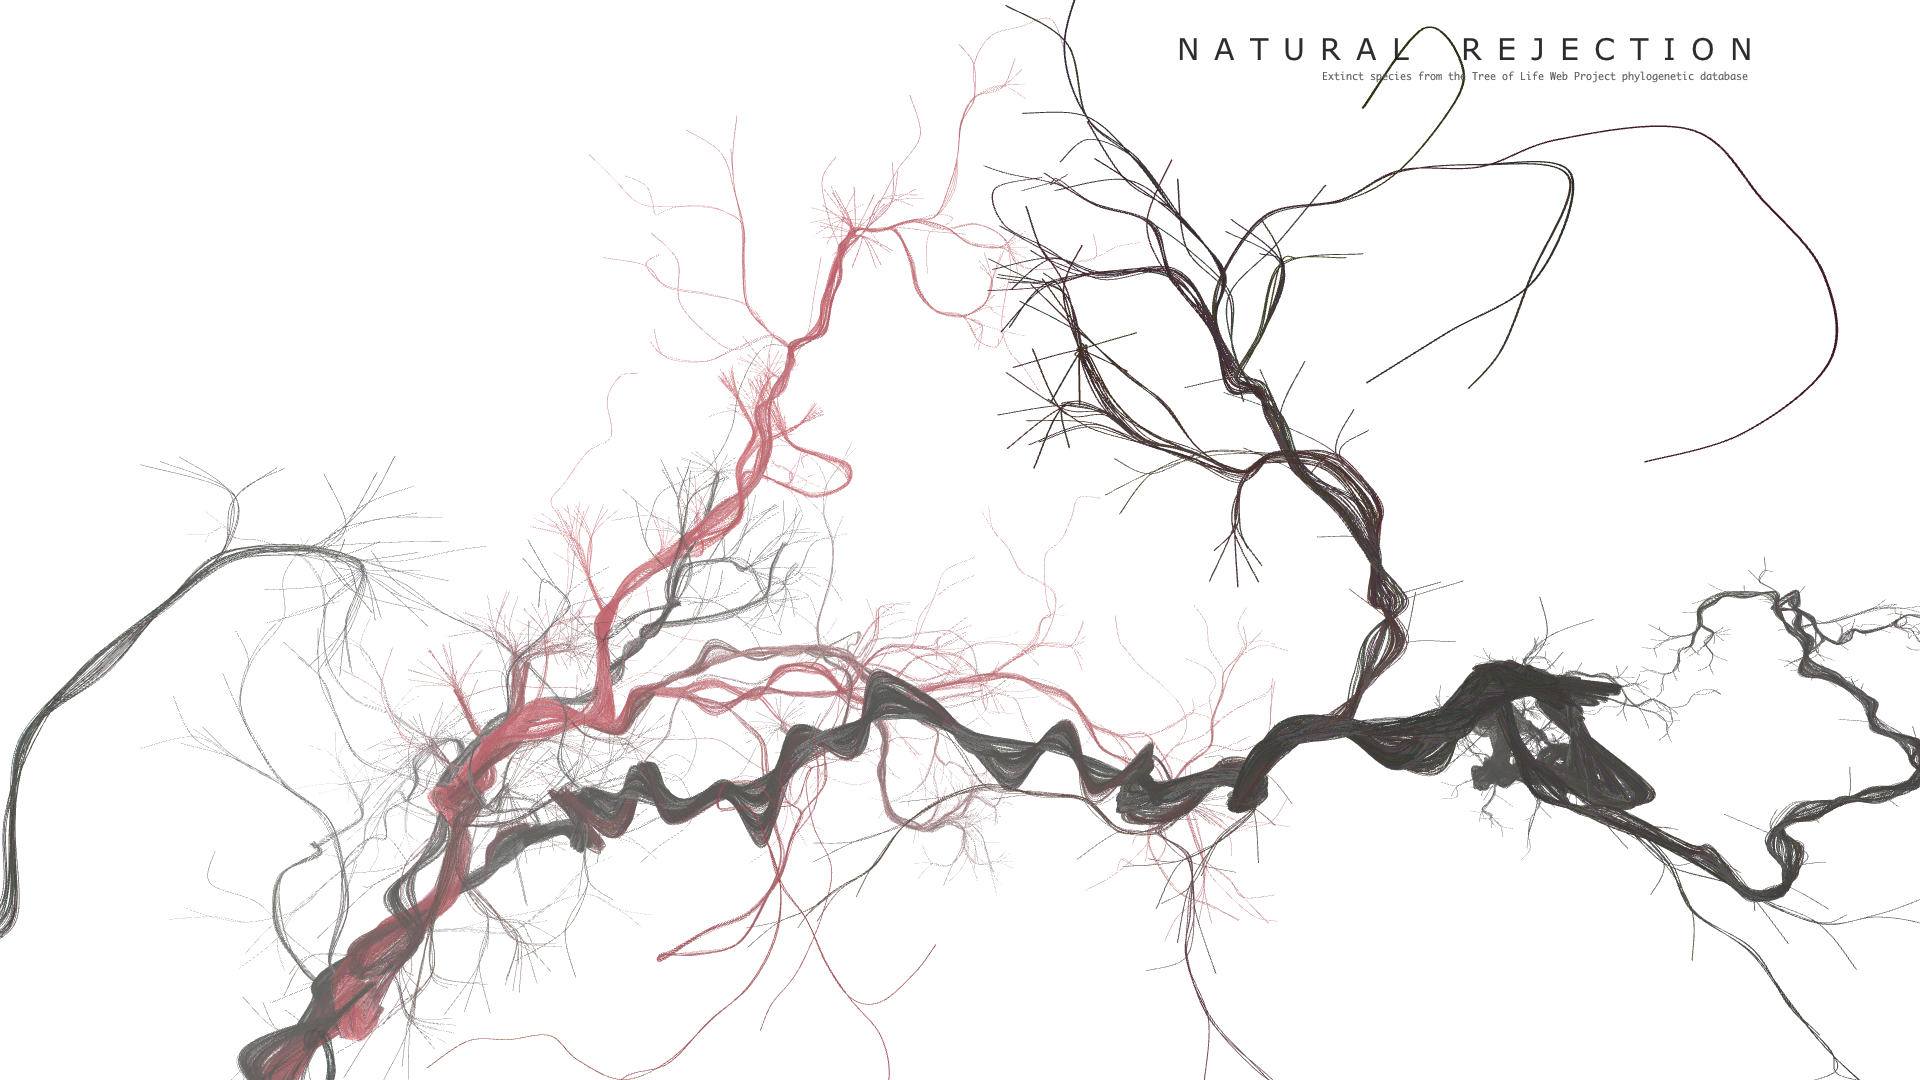
To achieve my primary visualization of extinct species, I start at Branch objects that are flagged as extinct, working my way backwards to the base of the tree. Here, an array of vertex buffer objects is created, each one representing a single species. Curve vertices are used instead of a standard vertex. This allows for the rendering of Catmull-Rom splines which have a pleasing aesthetic. To aid in the visualization I added another stochastic process when placing the curve vertices which offsets their position the closer to the root they get. For the rendering, I implemented a few visual techniques to aid in comprehending the data. First, depth-dependent halos were implemented via a modified OpenGL Line shader to modify the stroke width of the curves. This halo shader displaces the lines back away from the viewing plane and thickens their stroke weight. It greatly aids in seeing the shape of densely packed nodes, and has a unique visual appeal. Rendering the halos is optional for the user.
One of many errors in drawing curved lines.
A stable tree with curved vertices and depth-dependent halos enabled.
To actually glean some information from the visualization, I implemented a color picking technique to see the name of each extinct species by hovering the mouse cursor over its terminal point. There are not many Processing libraries that deal with 3d picking, so I attempted to implement my own based on raycasting. This had some extra challenges due to the way Processing and Peasycam handle viewport matrices, so I abandoned it in favor of a "color picking" method described by Processing forum user jeff_g3.
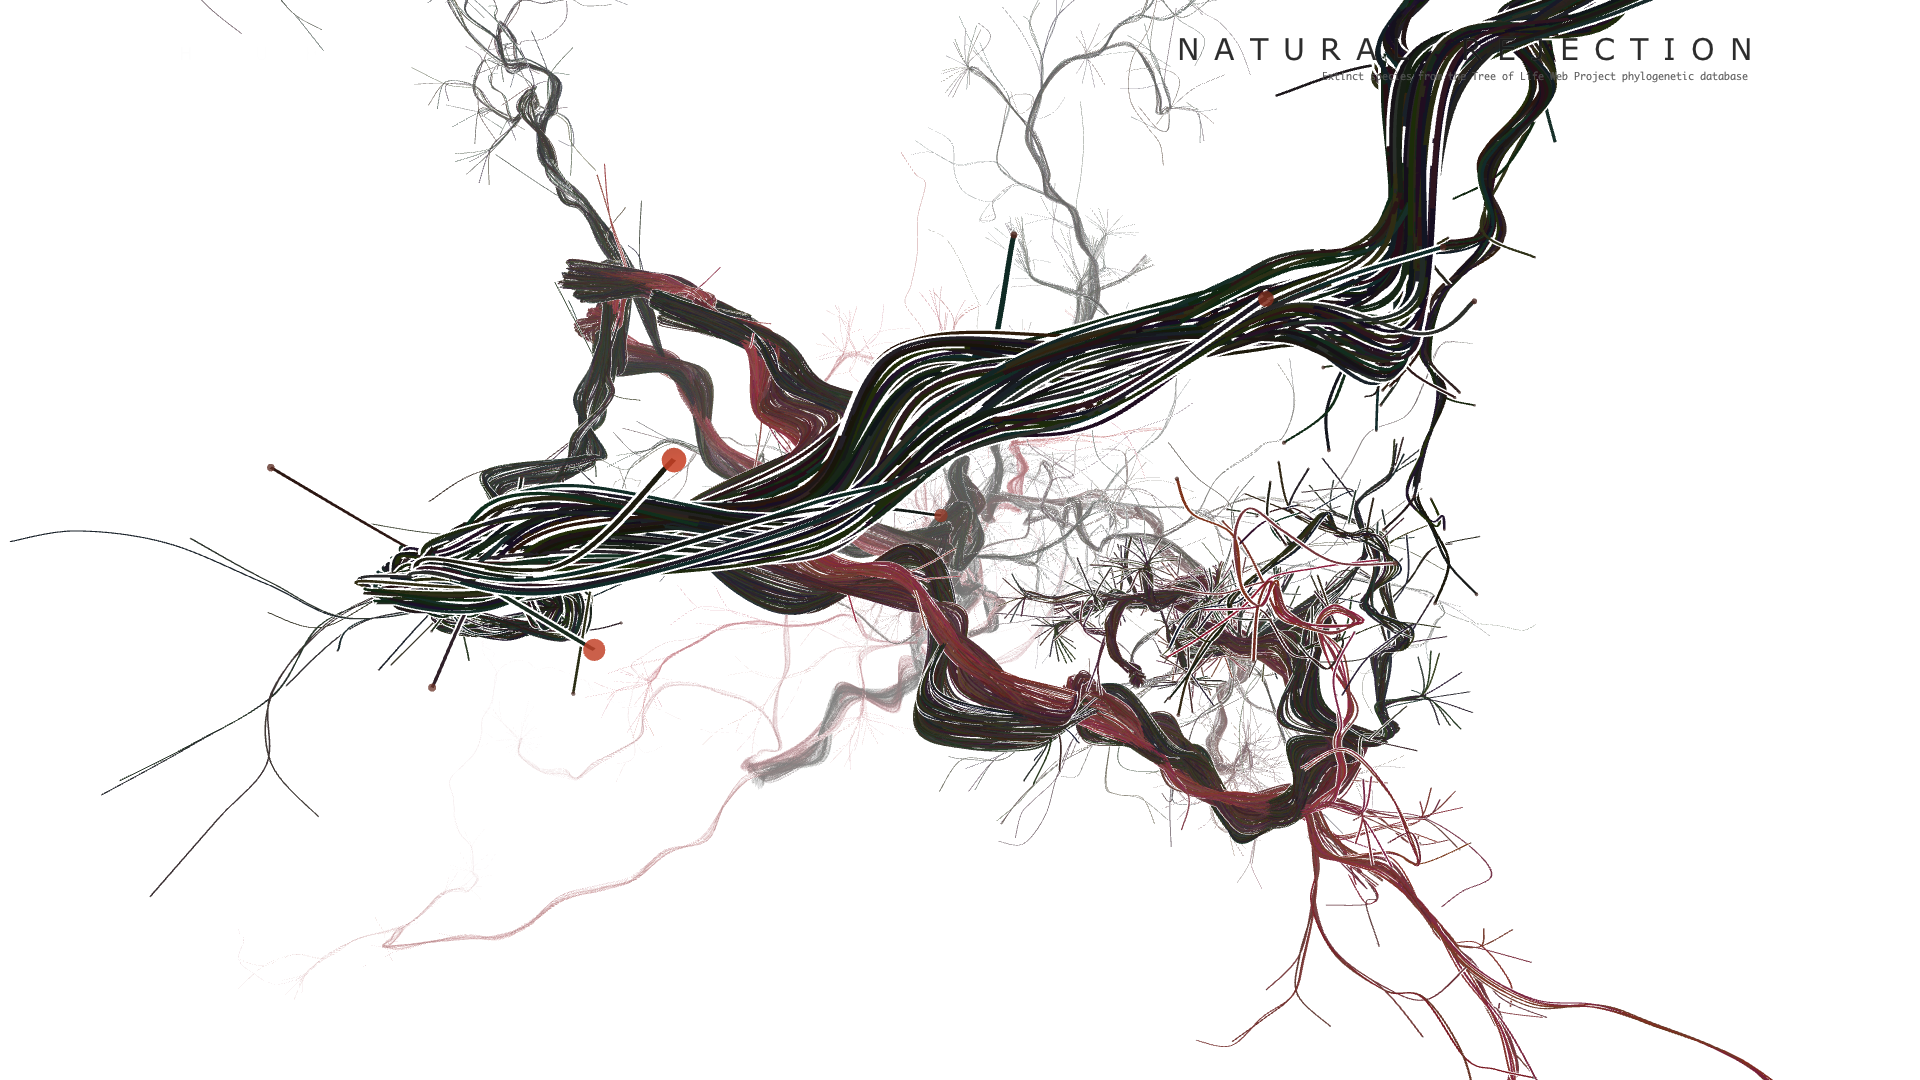
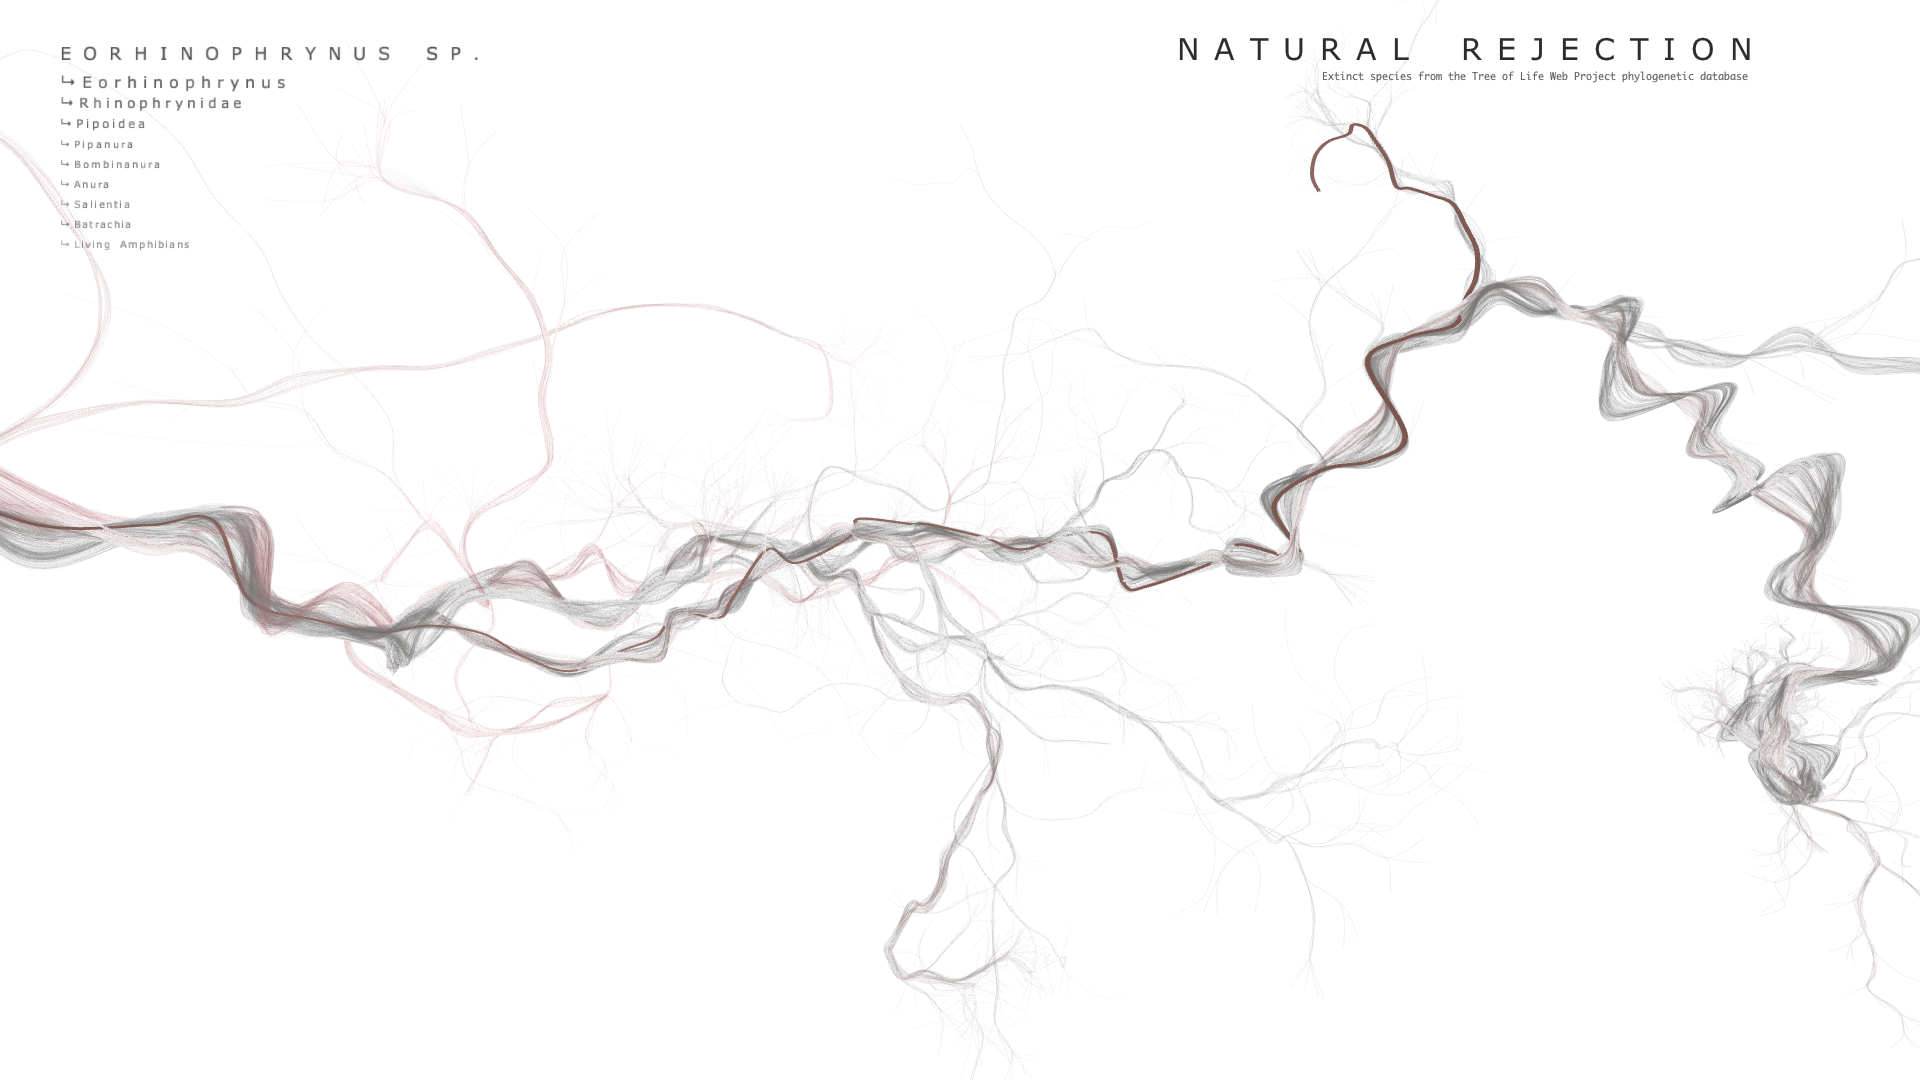
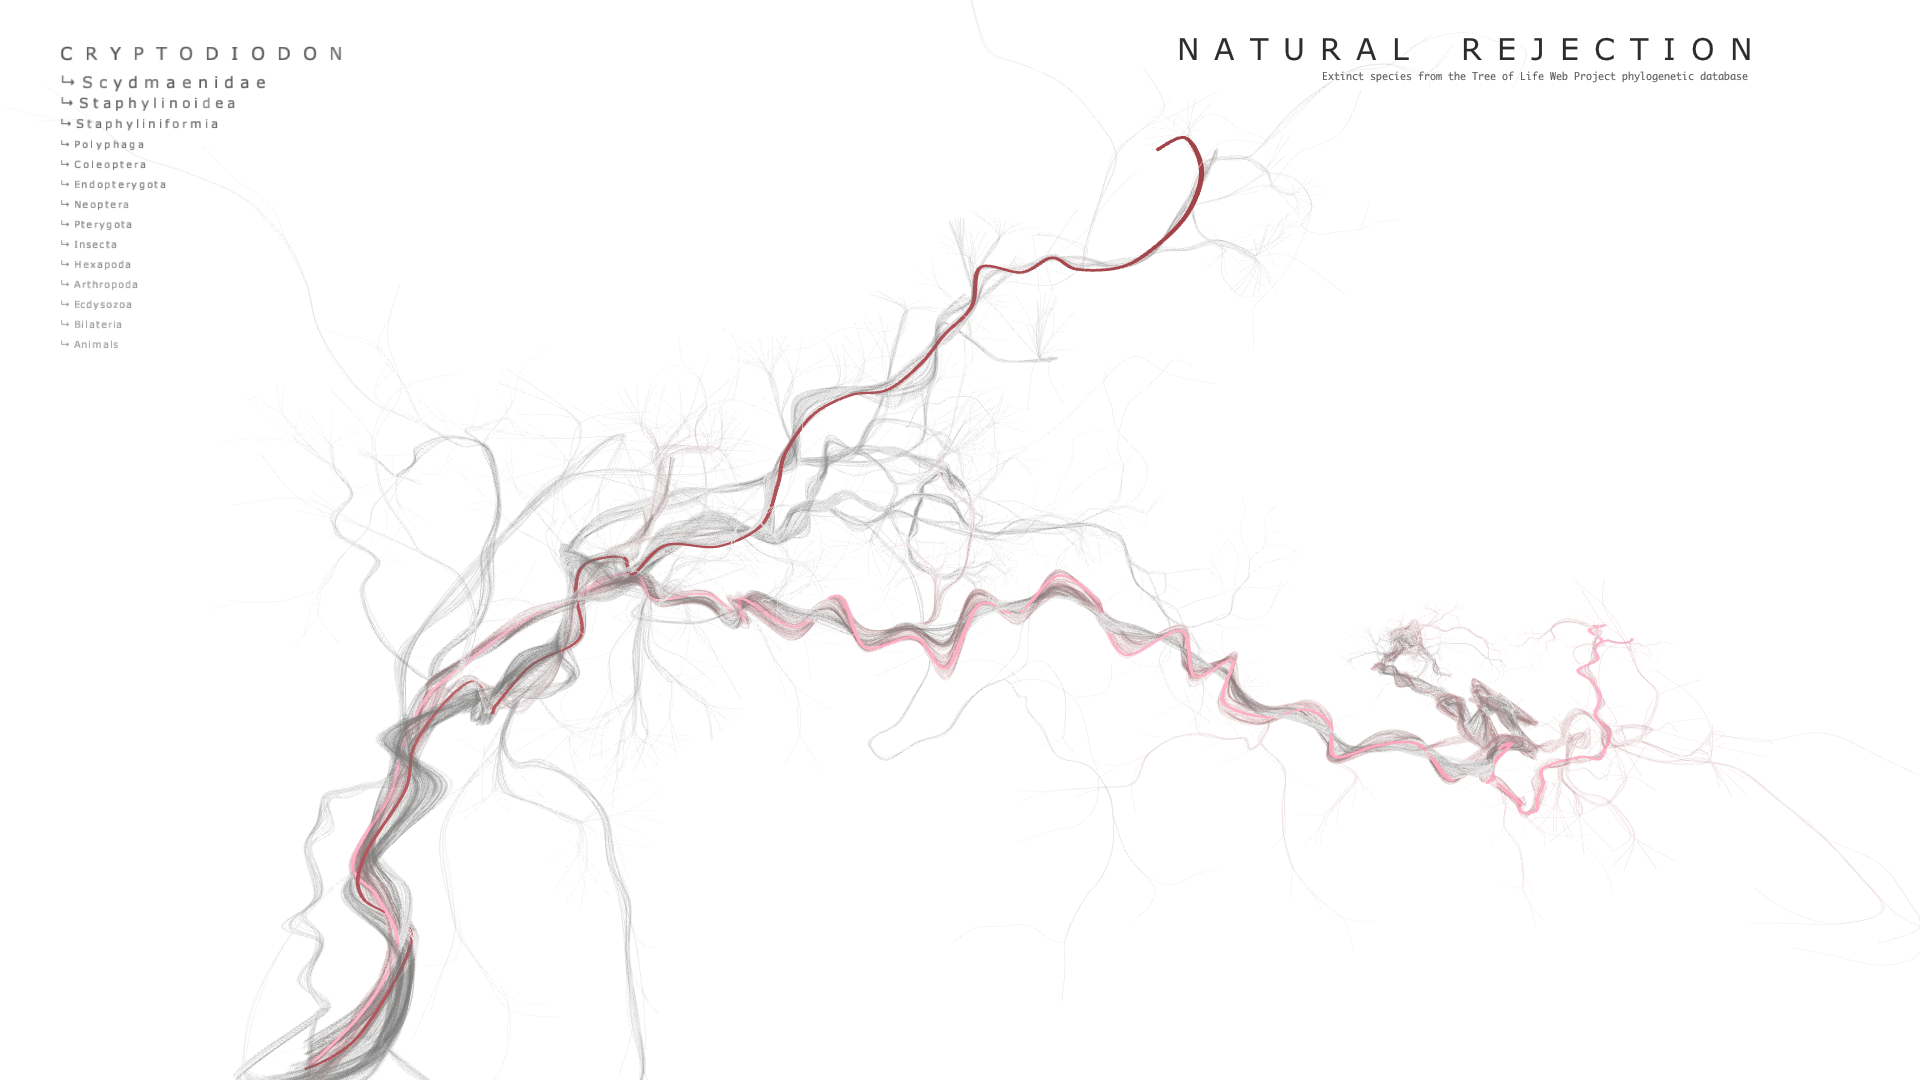
When hovering over a point, the extinct species' name is displayed at the top of the screen along with the names of 3 of its parent nodes. The user can use the UP and DOWN arrow keys to add or subtract the number of parent nodes to display. The points have their own OpenGL shader which modulates their radius according to the proximity of the mouse. For some reason, getting this effect to not blow up when the camera came close was very difficult and took quite a bit of time to solve.
The earliest working implementation of color picking.
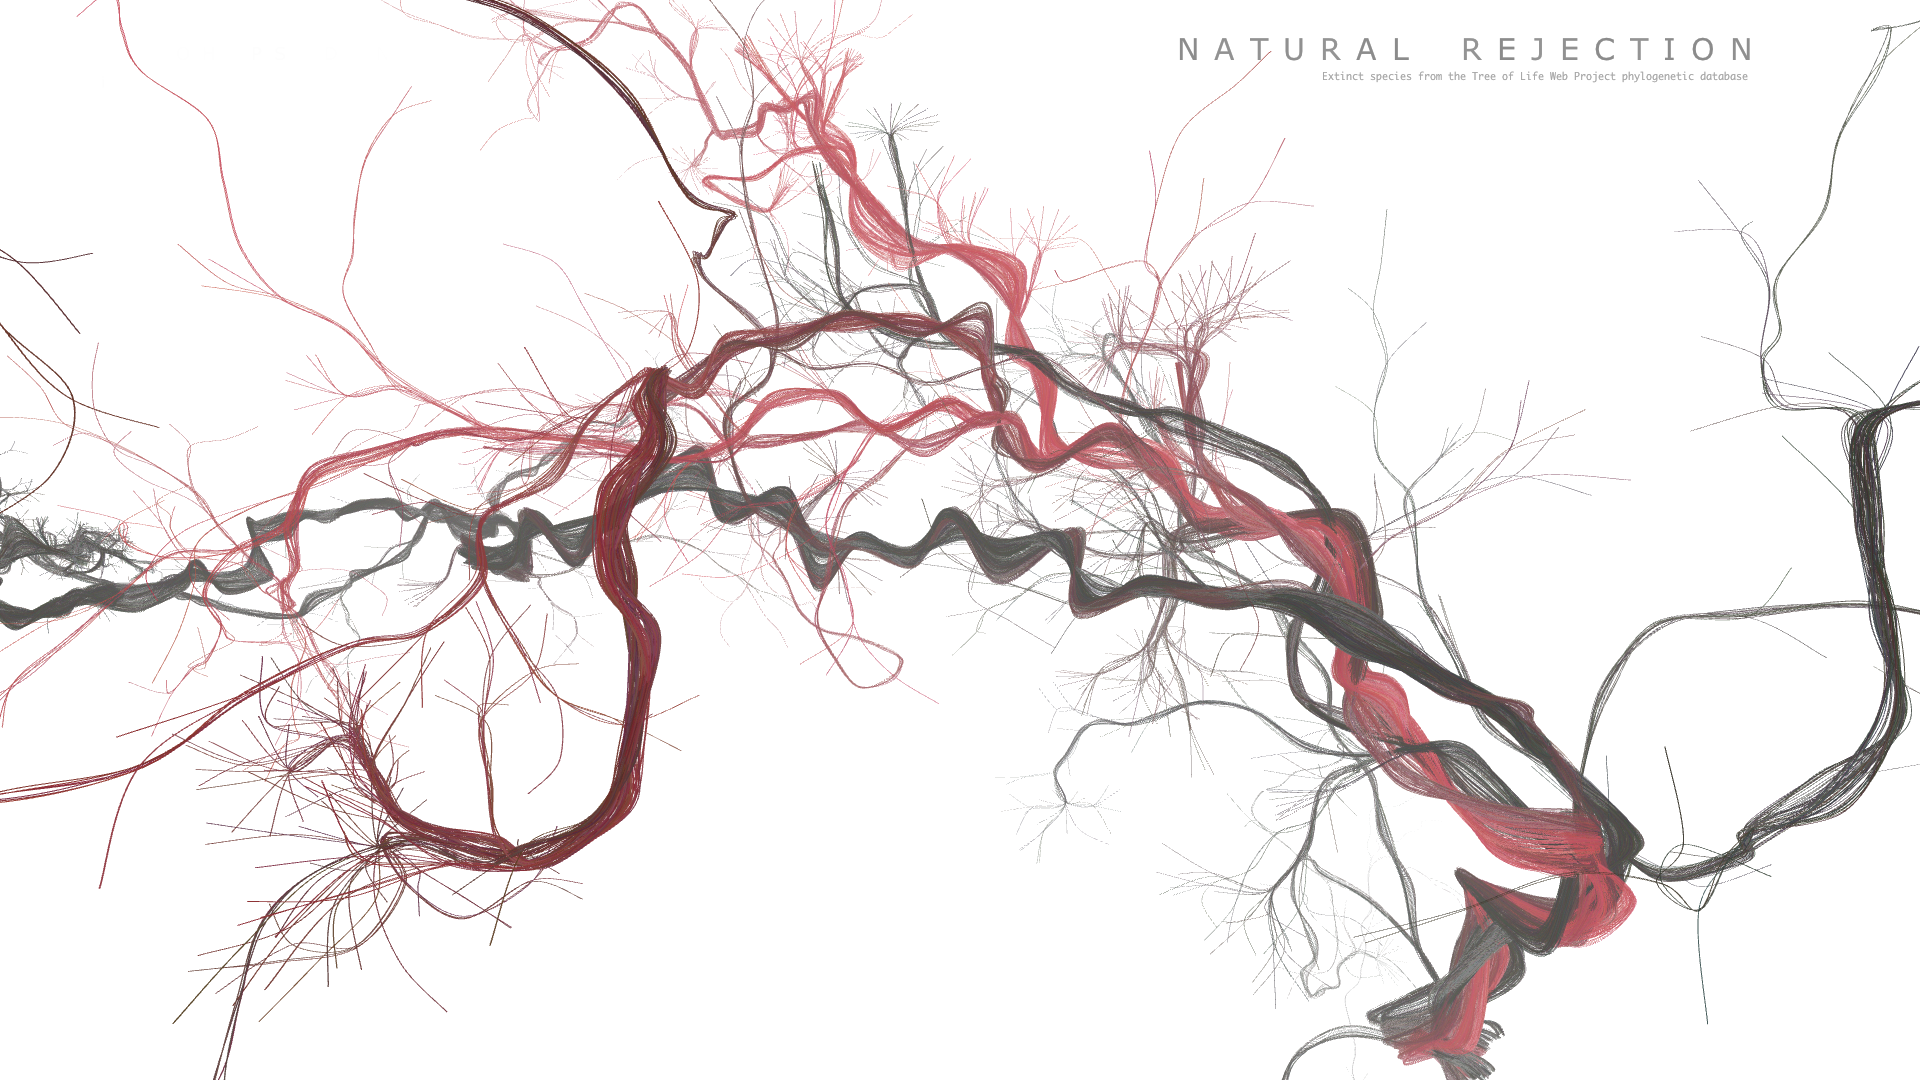
The primary shader used for the curves is also a modified OpenGL line shader. When the user is hovering over an extinct species, the species of interest will increase in stroke weight and become a brighter, more solid color while the rest of the tree's transparency will increase. This aids in seeing its path back to the root. While hovering over a point, the user can click once on it to "lock" it so that it will remain highlighted while the user can explore the rest of the tree. Clicking away from the point unlocks it. Furthermore, OpenGL was leveraged to achieve a depth effect where the color and transparency is attenuated based on how far away from the picture plane the vertex is. This helps to bring focus to the foreground and gives a sense of shaping.
Finally, the entire database may be visualized as more basic vertex geometry, not curves. It's rendered as semi-transparent, giving the impression of a cloud or swarm. This helps the user understand the overall shape of the tree and how the extinct species in the database are distributed.
During traversal of the XML object, an array of Branch objects is created. Each Branch object has knowledge of its worldspace position, grow direction, number of children, taxonomic name, and its parent branch. The angle, and thus vertex position, of the next branch is determined stochastically by the number of children it has, how deep in the tree it resides, and some degree of randomness.
With this information, I then loop through the Branch array to construct a 3d mesh for visualization. To visualize the entire tree of all species (not just extinct ones), I simply look at each Branch and save a vertex at its position in a vertex buffer object. Since this mesh is not closed, I decided to render it using OpenGL's "LINES" method which requires two unique vertices to describe a line. There are 188600 vertices in the tree of life.
A smaller test case was used in many of these early images. The node for Harpalinae, a type of beetle, was used which contains about 1200 children in total.
The first successful branching structure.
An early interactive version where controls were made to adjust trigonomic values relating to how the tree takes shape over generations. Color was initially used to aid in understanding the algorithm. Here, red is used to highlight the end points of branches.
To achieve my primary visualization of extinct species, I start at Branch objects that are flagged as extinct, working my way backwards to the base of the tree. Here, an array of vertex buffer objects is created, each one representing a single species. Curve vertices are used instead of a standard vertex. This allows for the rendering of Catmull-Rom splines which have a pleasing aesthetic. To aid in the visualization I added another stochastic process when placing the curve vertices which offsets their position the closer to the root they get. For the rendering, I implemented a few visual techniques to aid in comprehending the data. First, depth-dependent halos were implemented via a modified OpenGL Line shader to modify the stroke width of the curves. This halo shader displaces the lines back away from the viewing plane and thickens their stroke weight. It greatly aids in seeing the shape of densely packed nodes, and has a unique visual appeal. Rendering the halos is optional for the user.
One of many errors in drawing curved lines.
A stable tree with curved vertices and depth-dependent halos enabled.
To actually glean some information from the visualization, I implemented a color picking technique to see the name of each extinct species by hovering the mouse cursor over its terminal point. There are not many Processing libraries that deal with 3d picking, so I attempted to implement my own based on raycasting. This had some extra challenges due to the way Processing and Peasycam handle viewport matrices, so I abandoned it in favor of a "color picking" method described by Processing forum user jeff_g3.
When hovering over a point, the extinct species' name is displayed at the top of the screen along with the names of 3 of its parent nodes. The user can use the UP and DOWN arrow keys to add or subtract the number of parent nodes to display. The points have their own OpenGL shader which modulates their radius according to the proximity of the mouse. For some reason, getting this effect to not blow up when the camera came close was very difficult and took quite a bit of time to solve.
The earliest working implementation of color picking.
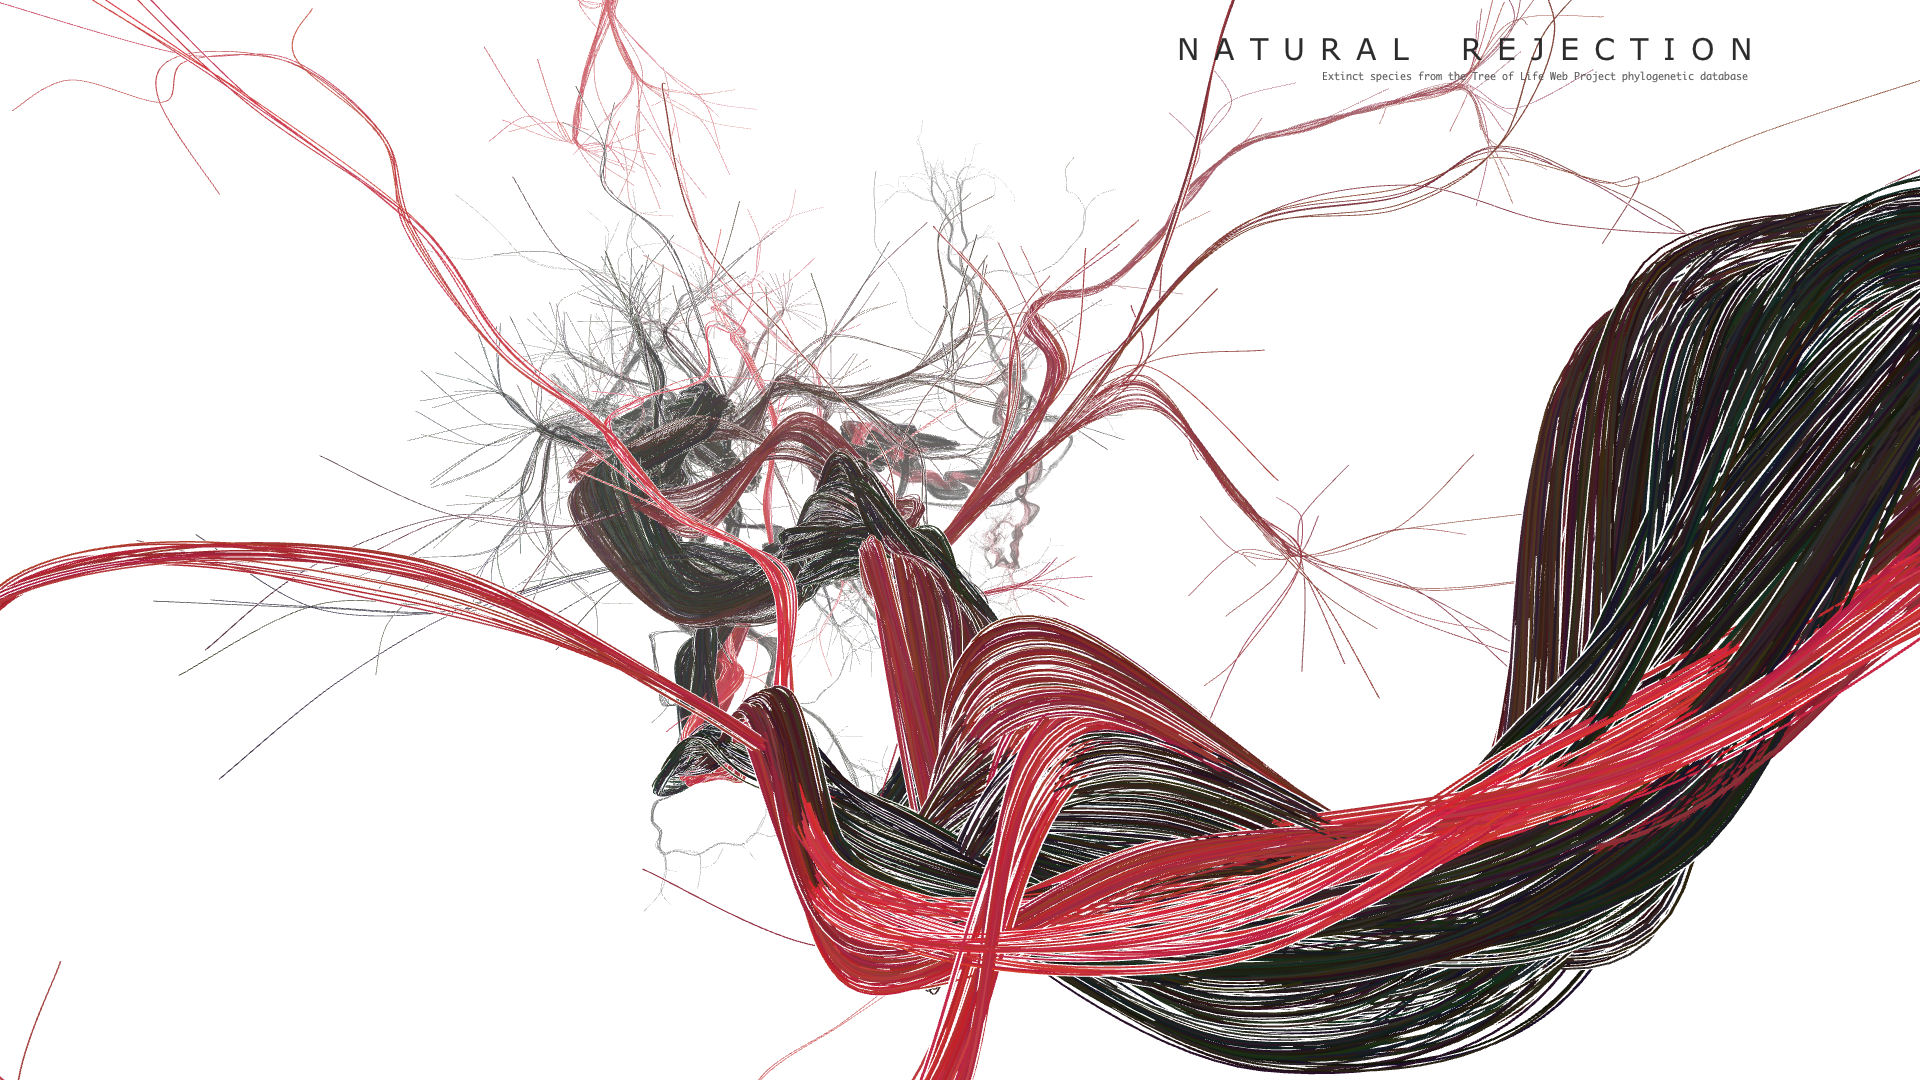
The primary shader used for the curves is also a modified OpenGL line shader. When the user is hovering over an extinct species, the species of interest will increase in stroke weight and become a brighter, more solid color while the rest of the tree's transparency will increase. This aids in seeing its path back to the root. While hovering over a point, the user can click once on it to "lock" it so that it will remain highlighted while the user can explore the rest of the tree. Clicking away from the point unlocks it. Furthermore, OpenGL was leveraged to achieve a depth effect where the color and transparency is attenuated based on how far away from the picture plane the vertex is. This helps to bring focus to the foreground and gives a sense of shaping.
Finally, the entire database may be visualized as more basic vertex geometry, not curves. It's rendered as semi-transparent, giving the impression of a cloud or swarm. This helps the user understand the overall shape of the tree and how the extinct species in the database are distributed.
Final result
Code
I used Processing with Peasycam.
Source Code + Data
Control: Hover over branch tips to show species name and illustrate path to the base. Click on the tip to lock the selection. Double click to focus on the node.
UP arrow: increase taxonomy list size
DOWN arrow: decrease taxonomy list size
1: show halo effect
2: show entire tree
H: show GUI
R: rebuild tree
?: show help menu
References:
1. D. M. Raup, Extinction - Bad Genes or Bad luck. 1992. W. W. Norton & Company.
2. M. H. Everts, H. Bekker, J. Roerdink, and T. Isenberg. 2009. Depth-Dependent Halos: Illustrative Rendering of Dense Line Data. IEEE Transactions on Visualization and Computer Graphics http://www.cs.rug.nl/~isenberg/personal/papers/Everts_2009_DDH.pdf.
3. jeff_g. Peasycam and picking library. Reply #10. 2013. http://forum.processing.org/one/topic/peasycam-and-picking-library.html