Urban Agriculture in Seattle
MAT 259, 2015
Kurt Kaminski
Concept
Seattle is home to a widespread community garden program. I was curious if any patterns could be discerned from Seattle Public Library checkout habits within the Dewey class 630: Agriculture. MySQL was used to query each Dewey number, from 630 to 631, accumulating the number of checkouts per month across 8 years, from 2006 to 2013.
Query
SELECT
MONTH(cout),
YEAR(cout),
COUNT(IF( deweyClass >=630 AND deweyClass < 631, 1, NULL)) as "630",
COUNT(IF( deweyClass >=631 AND deweyClass < 632, 1, NULL)) as "631",
COUNT(IF( deweyClass >=632 AND deweyClass < 633, 1, NULL)) as "632",
COUNT(IF( deweyClass >=633 AND deweyClass < 634, 1, NULL)) as "633",
COUNT(IF( deweyClass >=634 AND deweyClass < 635, 1, NULL)) as "634",
COUNT(IF( deweyClass >=635 AND deweyClass < 636, 1, NULL)) as "635",
COUNT(IF( deweyClass >=636 AND deweyClass < 637, 1, NULL)) as "636",
COUNT(IF( deweyClass >=637 AND deweyClass < 638, 1, NULL)) as "637",
COUNT(IF( deweyClass >=638 AND deweyClass < 639, 1, NULL)) as "638",
COUNT(IF( deweyClass >=639 AND deweyClass < 640, 1, NULL)) as "639"
FROM
spl2.inraw
WHERE
deweyClass >= 630 AND deweyClass < 640
AND DATE(cout) >= '20060101'
AND DATE(cout) <= '20131231'
AND (itemtype = "acbk" OR itemtype = "arbk")
GROUP BY MONTH(cout), YEAR(cout)
ORDER BY YEAR(cout), MONTH(cout)
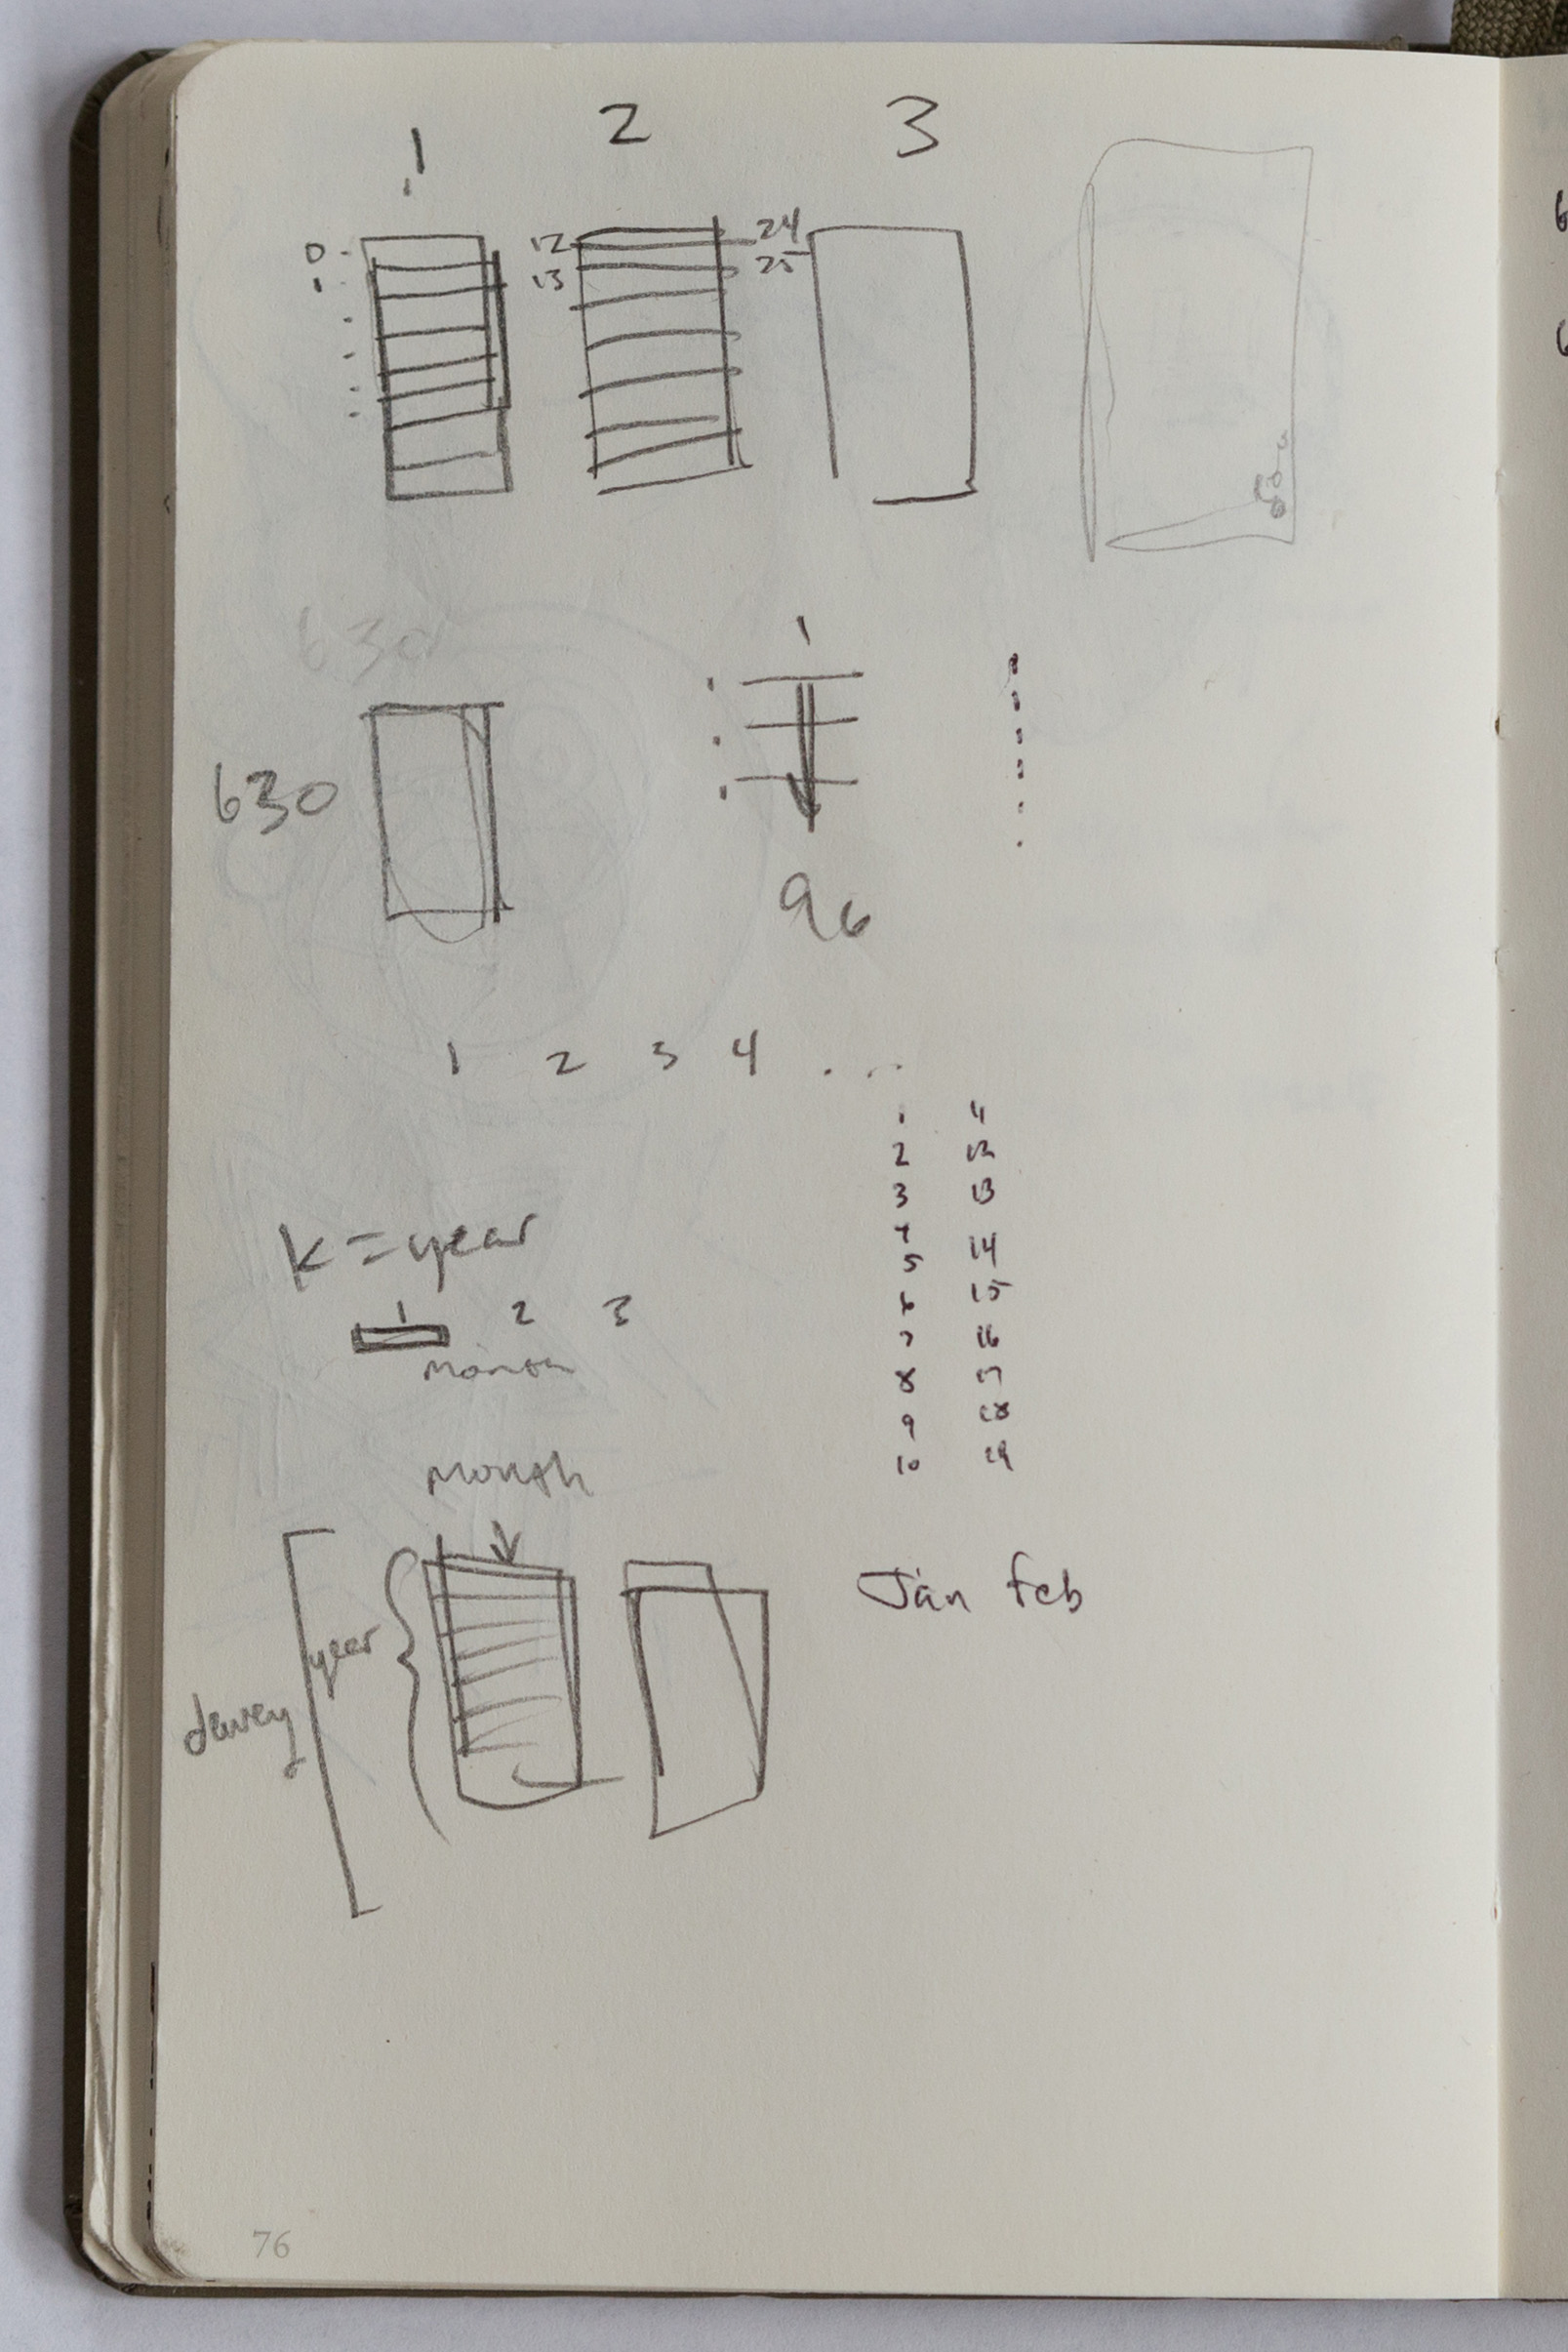
Preliminary sketches
In these early sketches, I was thinking of a way to visualize all the dewey classes, years, and months all at once. The bottom most panel shows the layout I settled on, which is a row for each dewey class with one column per month, that column being subdivided into multiple rows for each year.
Process
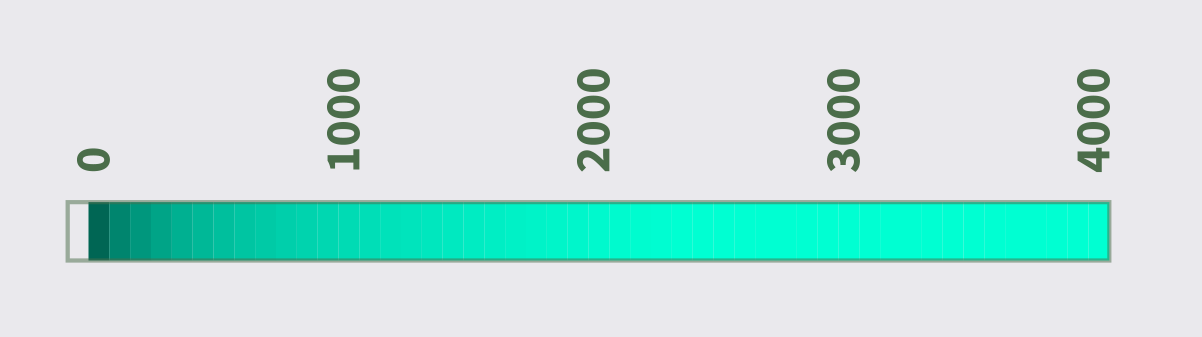
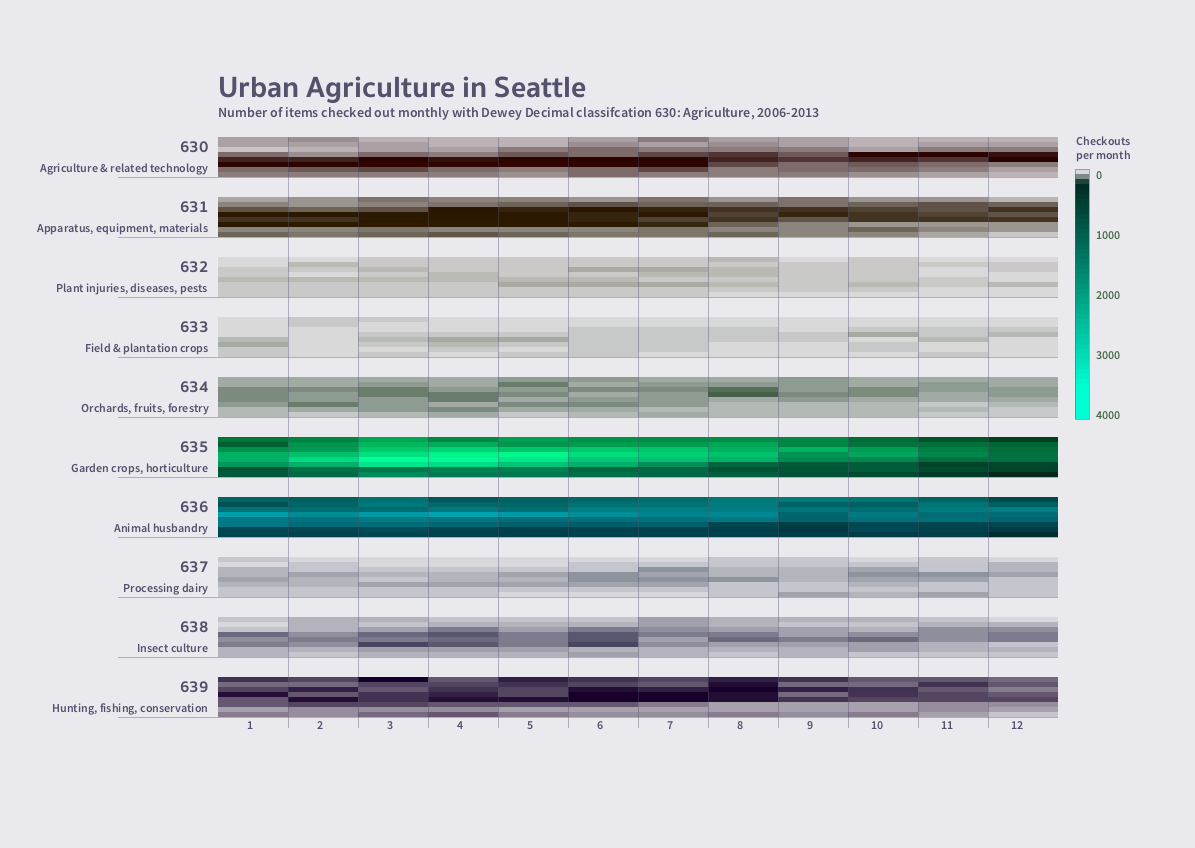
I implemented a slightly unorthodox method of coloring the data. There is a lot of variation within each Dewey class across time, but some Dewey classes dominate the data, for example 635 gets well into the thousands per month, whereas 630 stays in the hundreds. By modulating not only the brightness but also the transparency of each cell in the matrix, more variation can be revealed in the low range while maintaining variation in the high ranges. I made the alpha channel have a minimum value of 20 (out of 255) for legibility and aesthetic reasons. Hue varies based on Dewey number.
Final result
The visualization makes clear the most activity occurs during Spring, with March being the most important month for those interested in horticulture. Checkouts tend to dwindle as winter approaches, but items related to hunting and fishing see a slight increase before Fall as people prepare for the hunting season. Interest in insect culture regularly spikes during the month of June as gardeners likely seek defense against summer pests. Overall, fewer items have been checked out across all Dewey numbers in 2012 and 2013 compared to prior years.
Code