Average Lending Time for each Dewey Class and Year
MAT 259, 2015
Donghao Ren
Concept
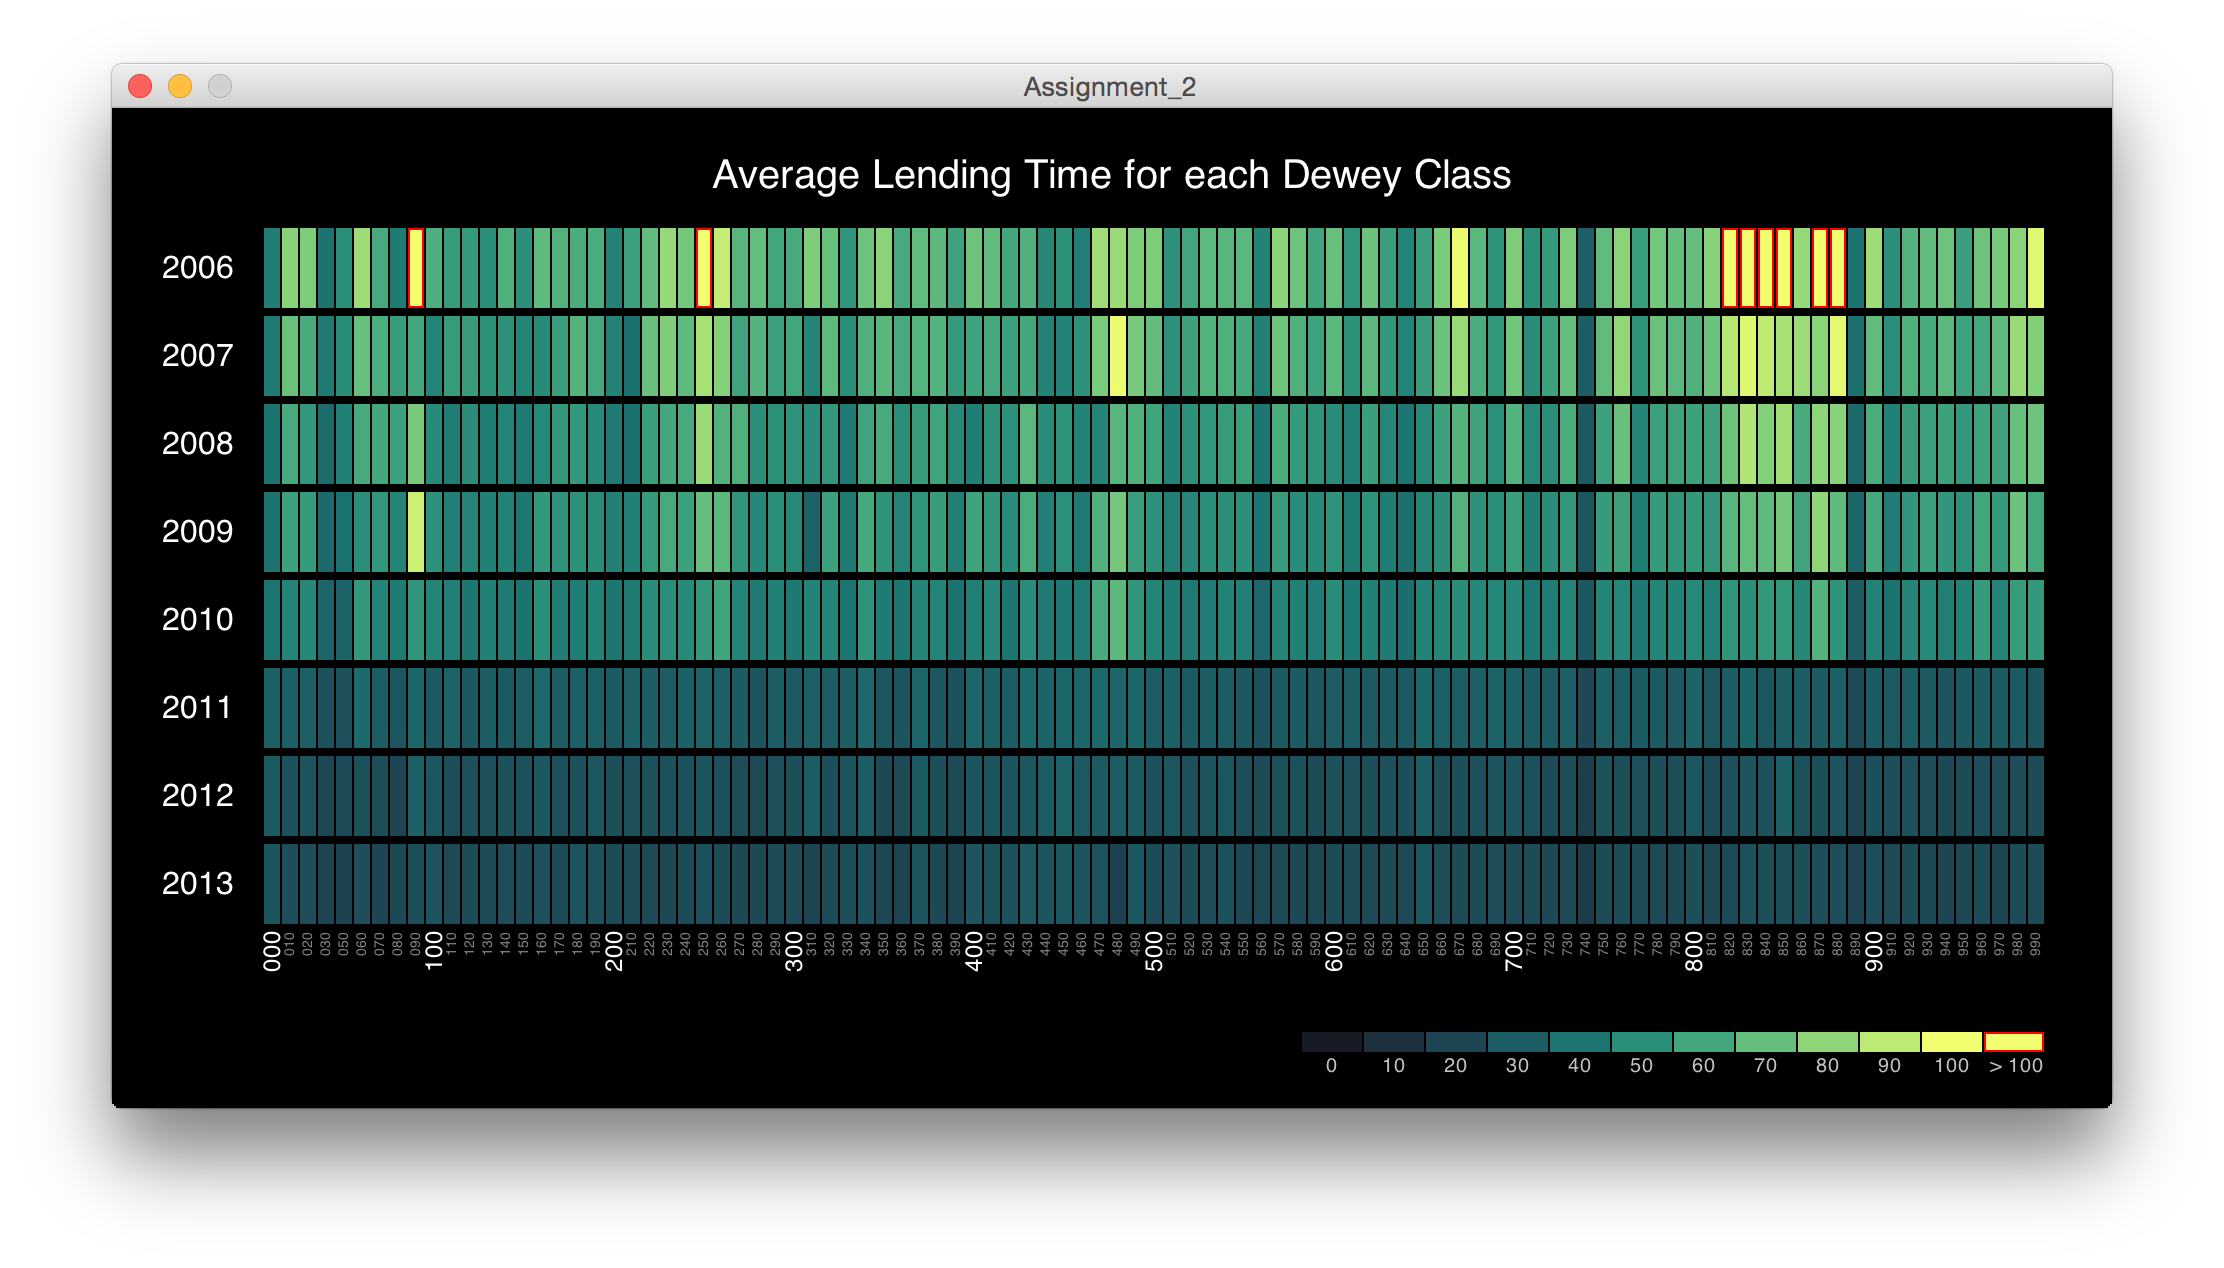
The visualization shows the average lending time for each Dewey class and each year from 2006 to 2013, using a heatmap metaphor. The color scales are designed using HCL Picker (http://tristen.ca/hcl-picker/), which provides a perceptually linear color scale (one exception: the blueish color scale comes from Mathematica). See http://vis4.net/blog/posts/avoid-equidistant-hsv-colors/ for the reason why linear RGB/HSV is not ideal for data visualization. Each row of the matrix represents a year, each column is a Dewey category (100 sub-categories). The color of each cell represents the average lending time for the corresponding year and category. There’s a legend showing the color scale at the bottom right.
From the visualization we can see the overall trend of lending time is decreasing, and years 2011, 2012, 2013’s lending time are much smaller than previous years. From the categories’s perspective, 800 categories’ lending time are the highest, which are literatures of different languages. Other interesting patterns include: 090 Manuscripts & rare books at year 2009, 480 Classical & modern Greek languages at year 2007. These might relate to some external events.
From the visualization we can see the overall trend of lending time is decreasing, and years 2011, 2012, 2013’s lending time are much smaller than previous years. From the categories’s perspective, 800 categories’ lending time are the highest, which are literatures of different languages. Other interesting patterns include: 090 Manuscripts & rare books at year 2009, 480 Classical & modern Greek languages at year 2007. These might relate to some external events.
Query
SELECT
  class,
  GROUP_CONCAT(CAST(year AS CHAR(40)) ORDER BY year) AS years,
  GROUP_CONCAT(CAST(average_lending_time AS CHAR(40)) ORDER BY year) AS average_lending_times,
  GROUP_CONCAT(CAST(count AS CHAR(40)) ORDER BY year) AS counts
FROM (
  SELECT
    SUBSTRING(deweyClass, 1, 2) AS class,
    YEAR(cout) AS year,
    COUNT(*) AS count,
    AVG(TIMESTAMPDIFF(DAY, cout, cin)) AS average_lending_time
  FROM
    spl2.inraw
  WHERE
    cout >= "2006" AND cout < "2014"
   AND itemtype LIKE "%bk"
    AND deweyClass != ""
  GROUP BY
    class, year
) AS innerTable
GROUP BY
  class
ORDER BY
  class ASC;
Process
Visual encoding: Year -> Vertical axis, Dewey Class -> Horizontal axis, Average lending time -> Color.
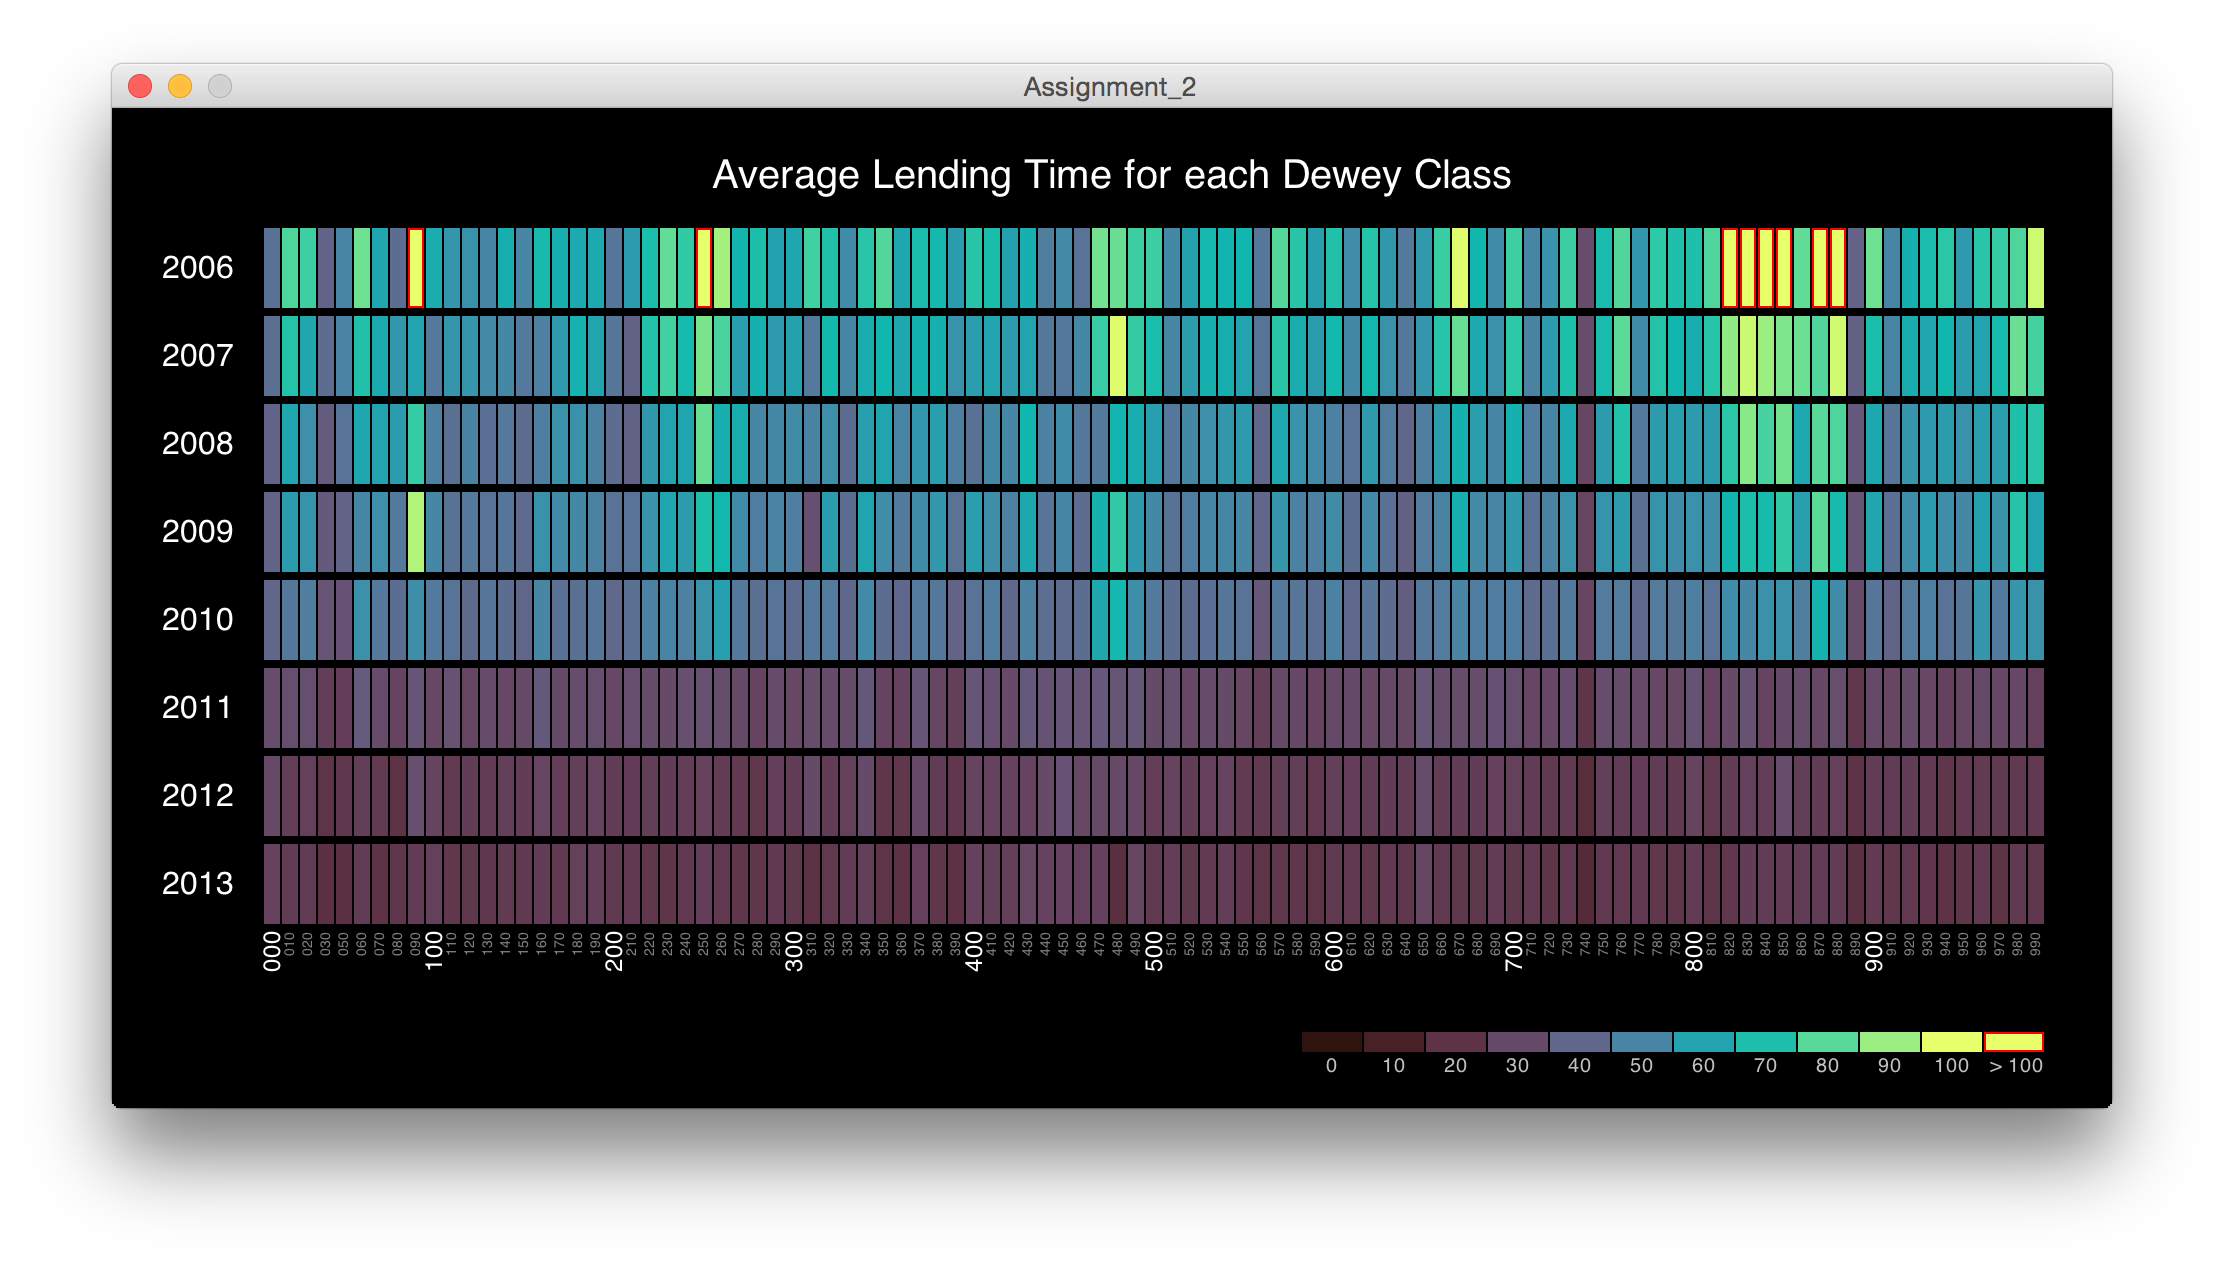
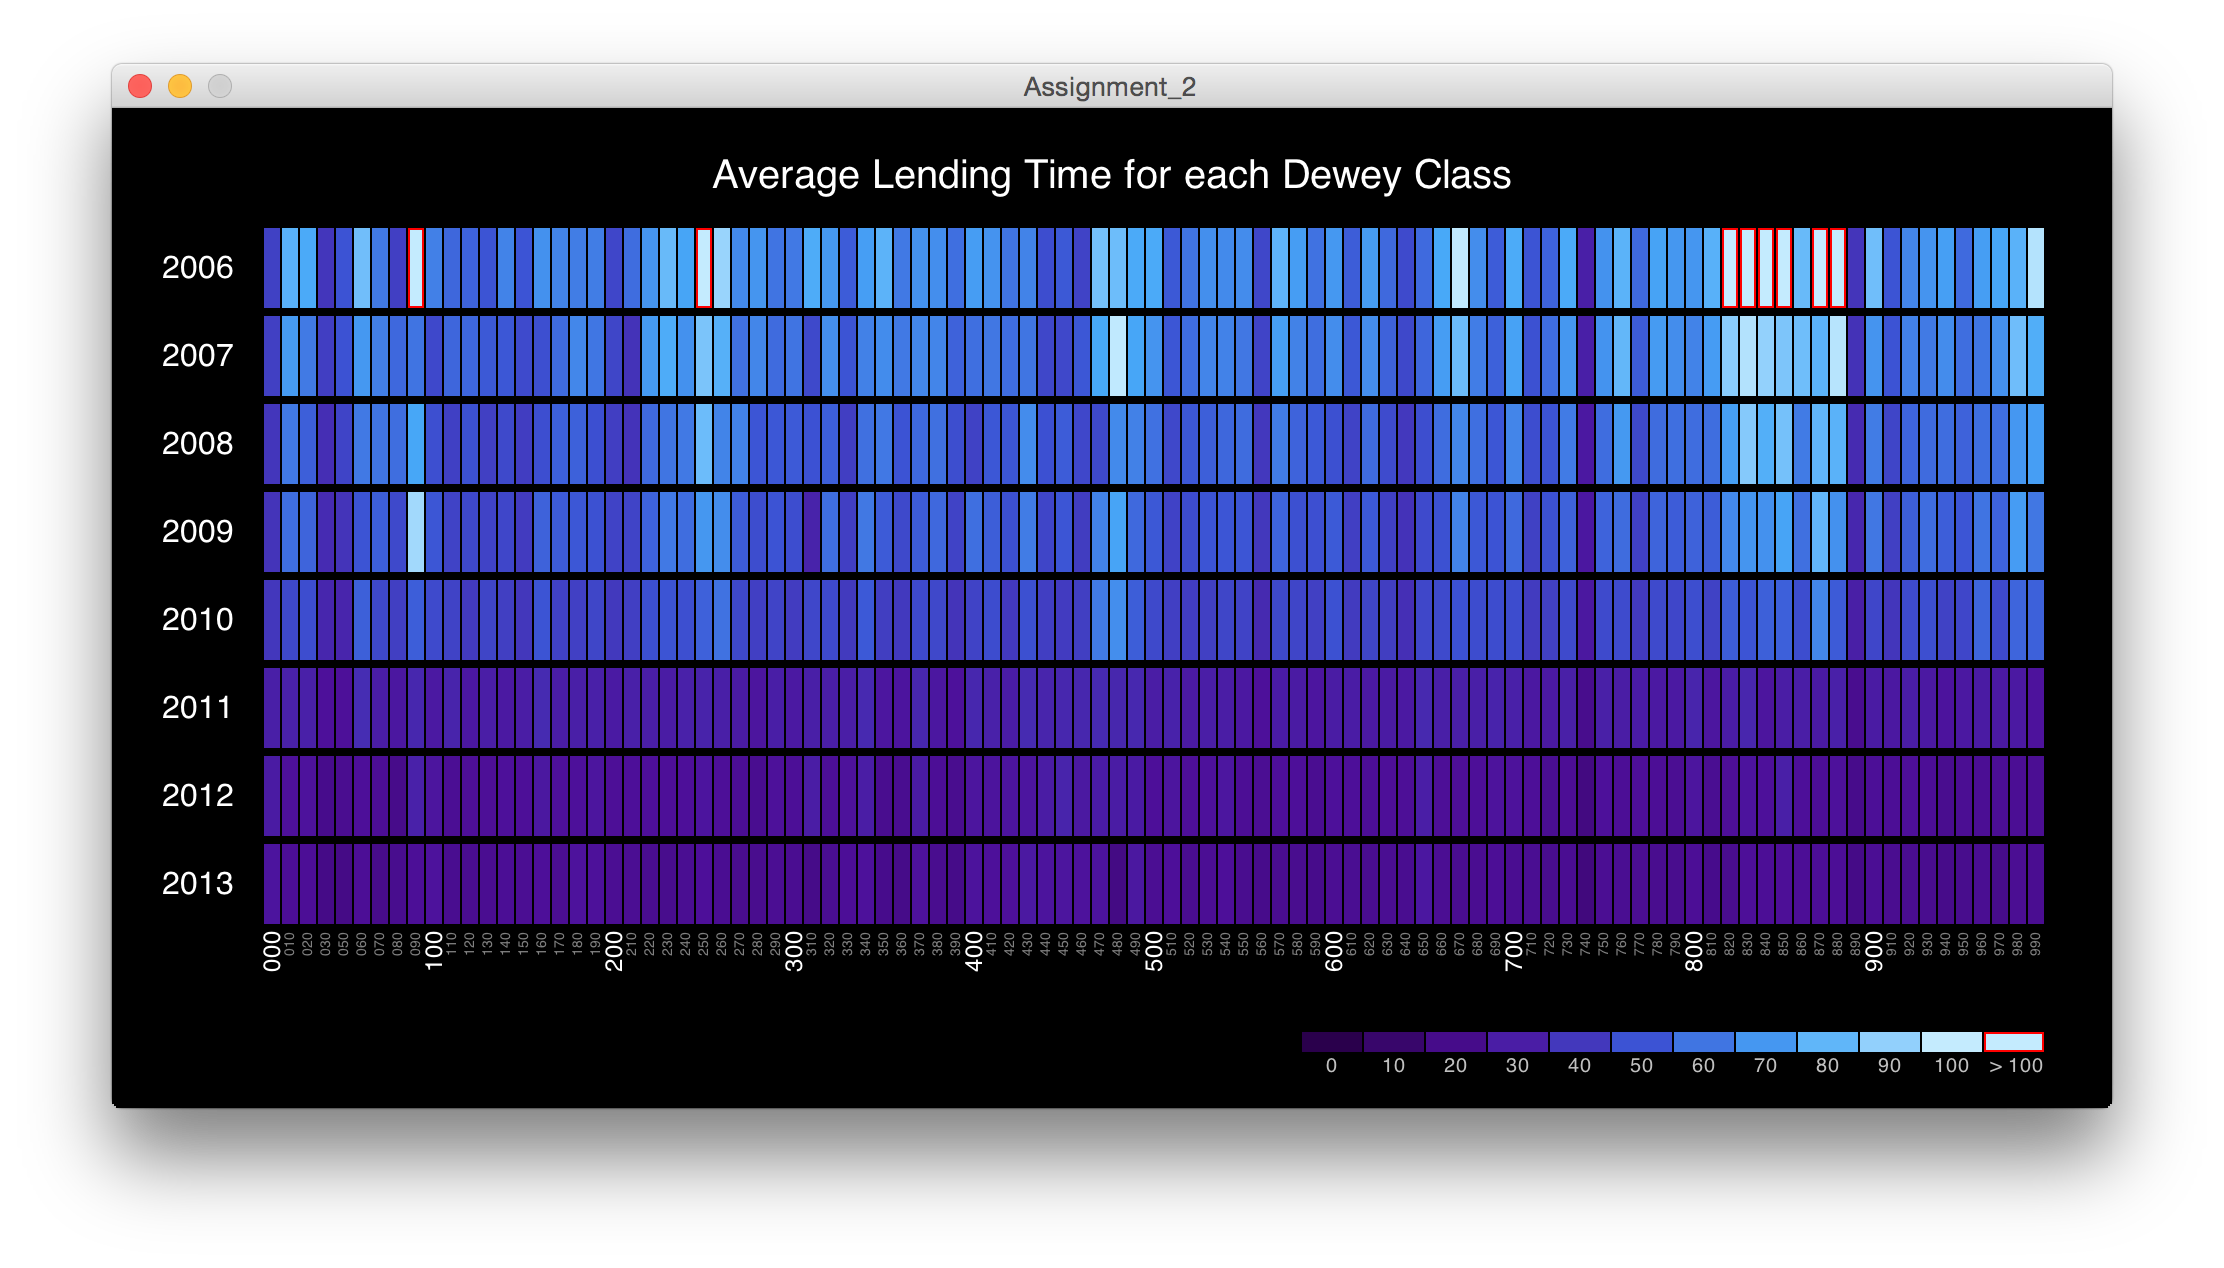
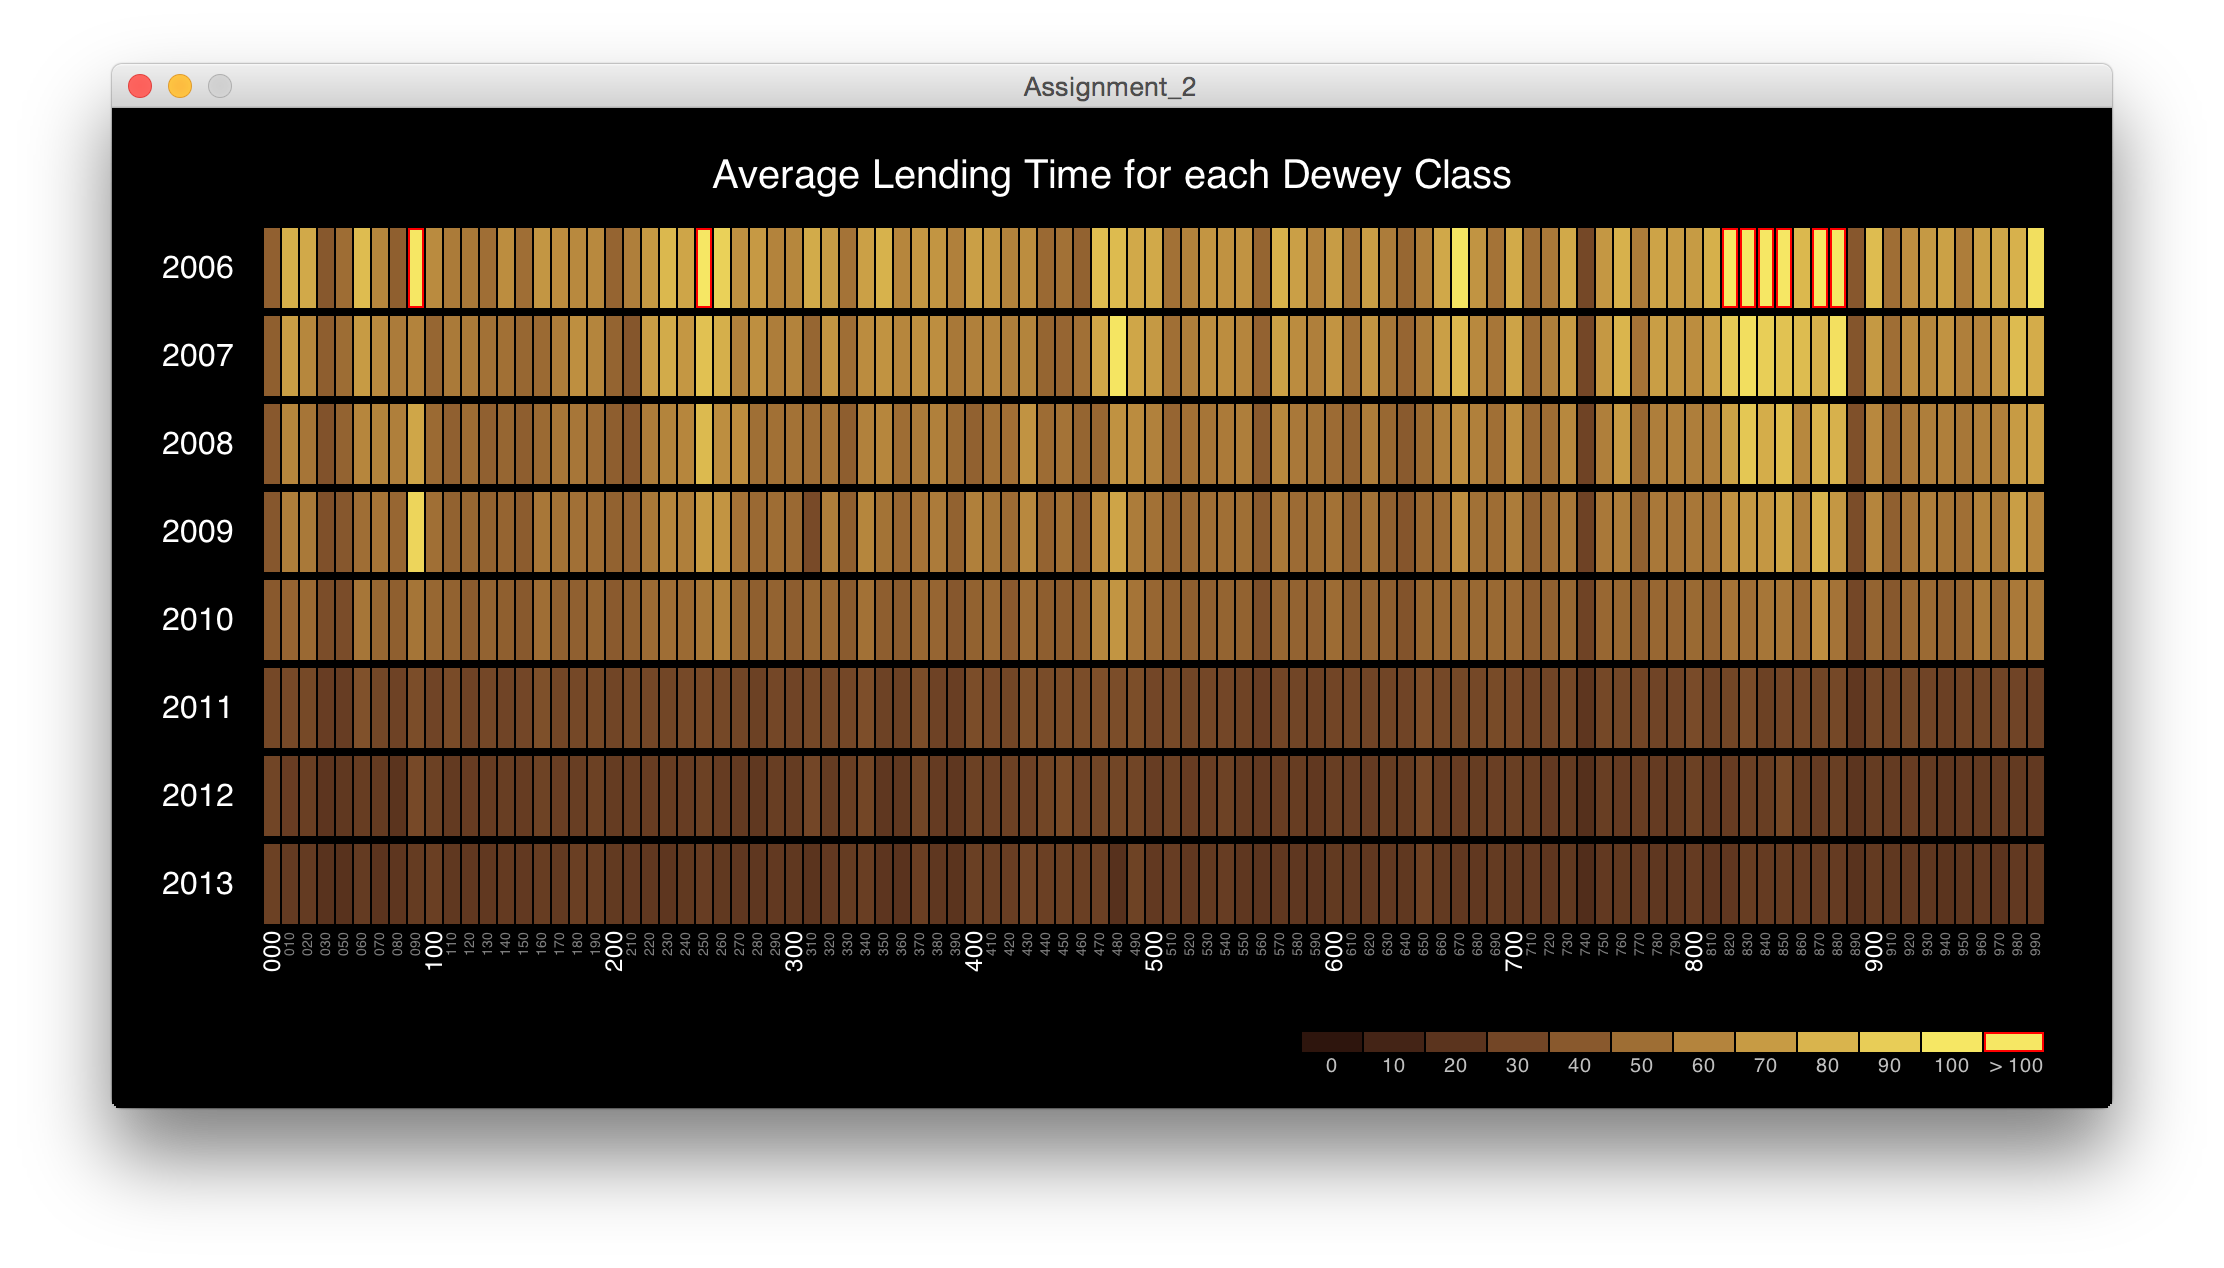
Color choirces: Multiple gradients experimented.
Color choirces: Multiple gradients experimented.
Final result
I experimented multiple color choices, including a scale from Mathematica, and several others from HCL Picker.
Code