Outliers
MAT 259, 2015
Daniel Imberman
Concept
For this project I wanted to be able to further research my look into finding outliers through comparison of normalized averages and standard deviations
Query
SELECT hour(day1.cdate),
sum(case when deweyClass>=810 and deweyClass<820 and dayofweek(day1.cdate) = 1 then 1 else 0 end),
sum(case when deweyClass>=810 and deweyClass<820 and dayofweek(day1.cdate) = 2 then 1 else 0 end),
sum(case when deweyClass>=810 and deweyClass<820 and dayofweek(day1.cdate) = 3 then 1 else 0 end),
sum(case when deweyClass>=810 and deweyClass<820 and dayofweek(day1.cdate) = 4 then 1 else 0 end),
sum(case when deweyClass>=810 and deweyClass<820 and dayofweek(day1.cdate) = 5 then 1 else 0 end),
sum(case when deweyClass>=810 and deweyClass<820 and dayofweek(day1.cdate) = 6 then 1 else 0 end),
sum(case when deweyClass>=810 and deweyClass<820 and dayofweek(day1.cdate) = 7 then 1 else 0 end)
from (SELECT cout as cdate, deweyClass FROM ( SELECT cout, deweyClass FROM spl2.inraw WHERE DATE(cout) >= '2013-03-01' AND DATE(cout) < '2013-04-01' ) as outday1 where hour(outday1.cout) >=10 and hour(outday1.cout)<= 20 ) as day1 group by hour(day1.cdate) order by hour(day1.cdate)
Preliminary sketches
I found that by using a color pallete where the insignificant data was the same color as the background, it became much easier to find the outliers. I also found that having the seperate modes helped significantly in understanding the data.
chronological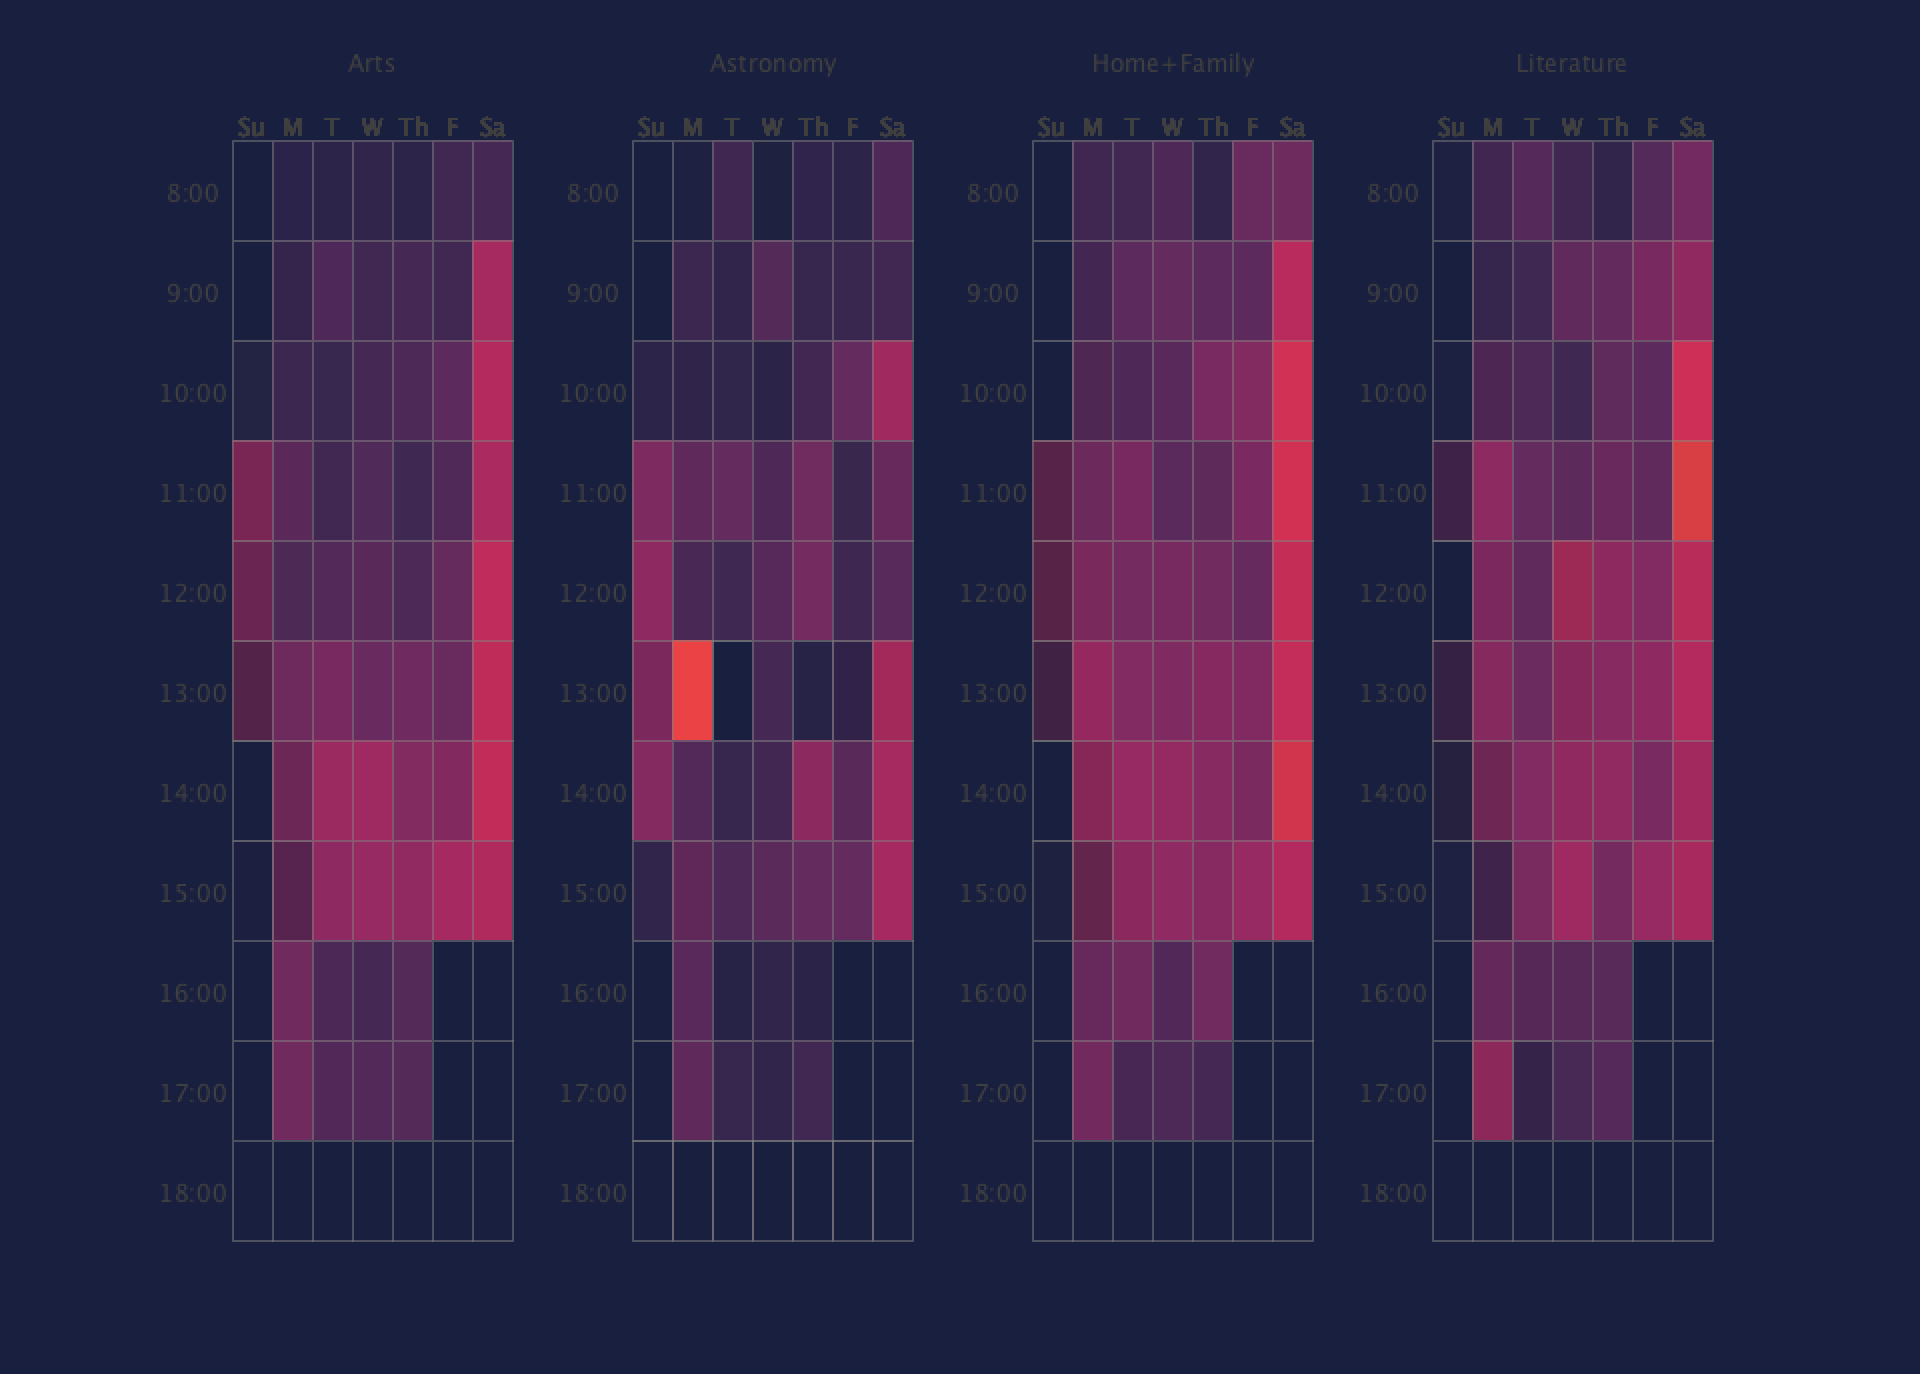
sorted by average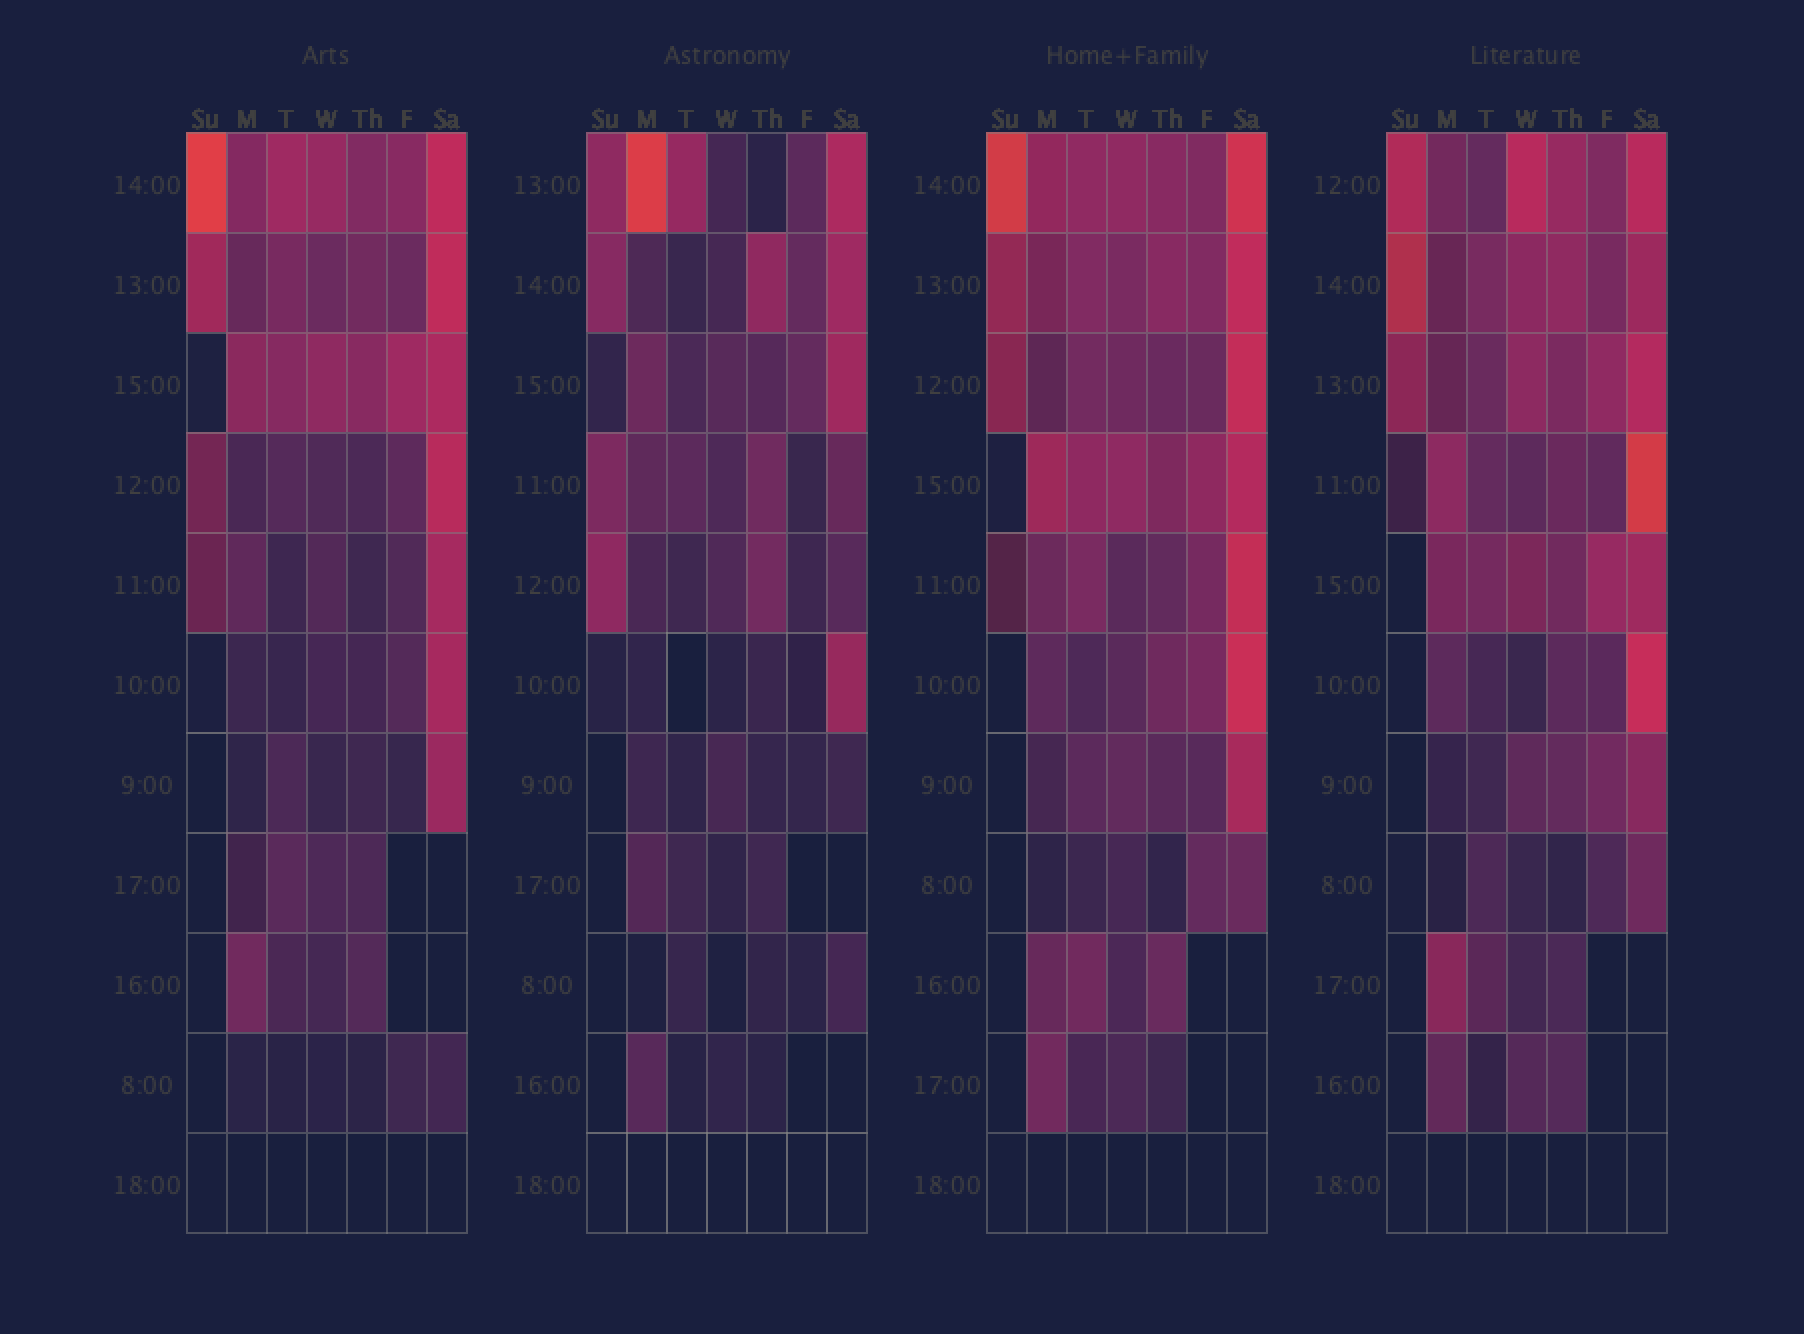
sorted by standard deviation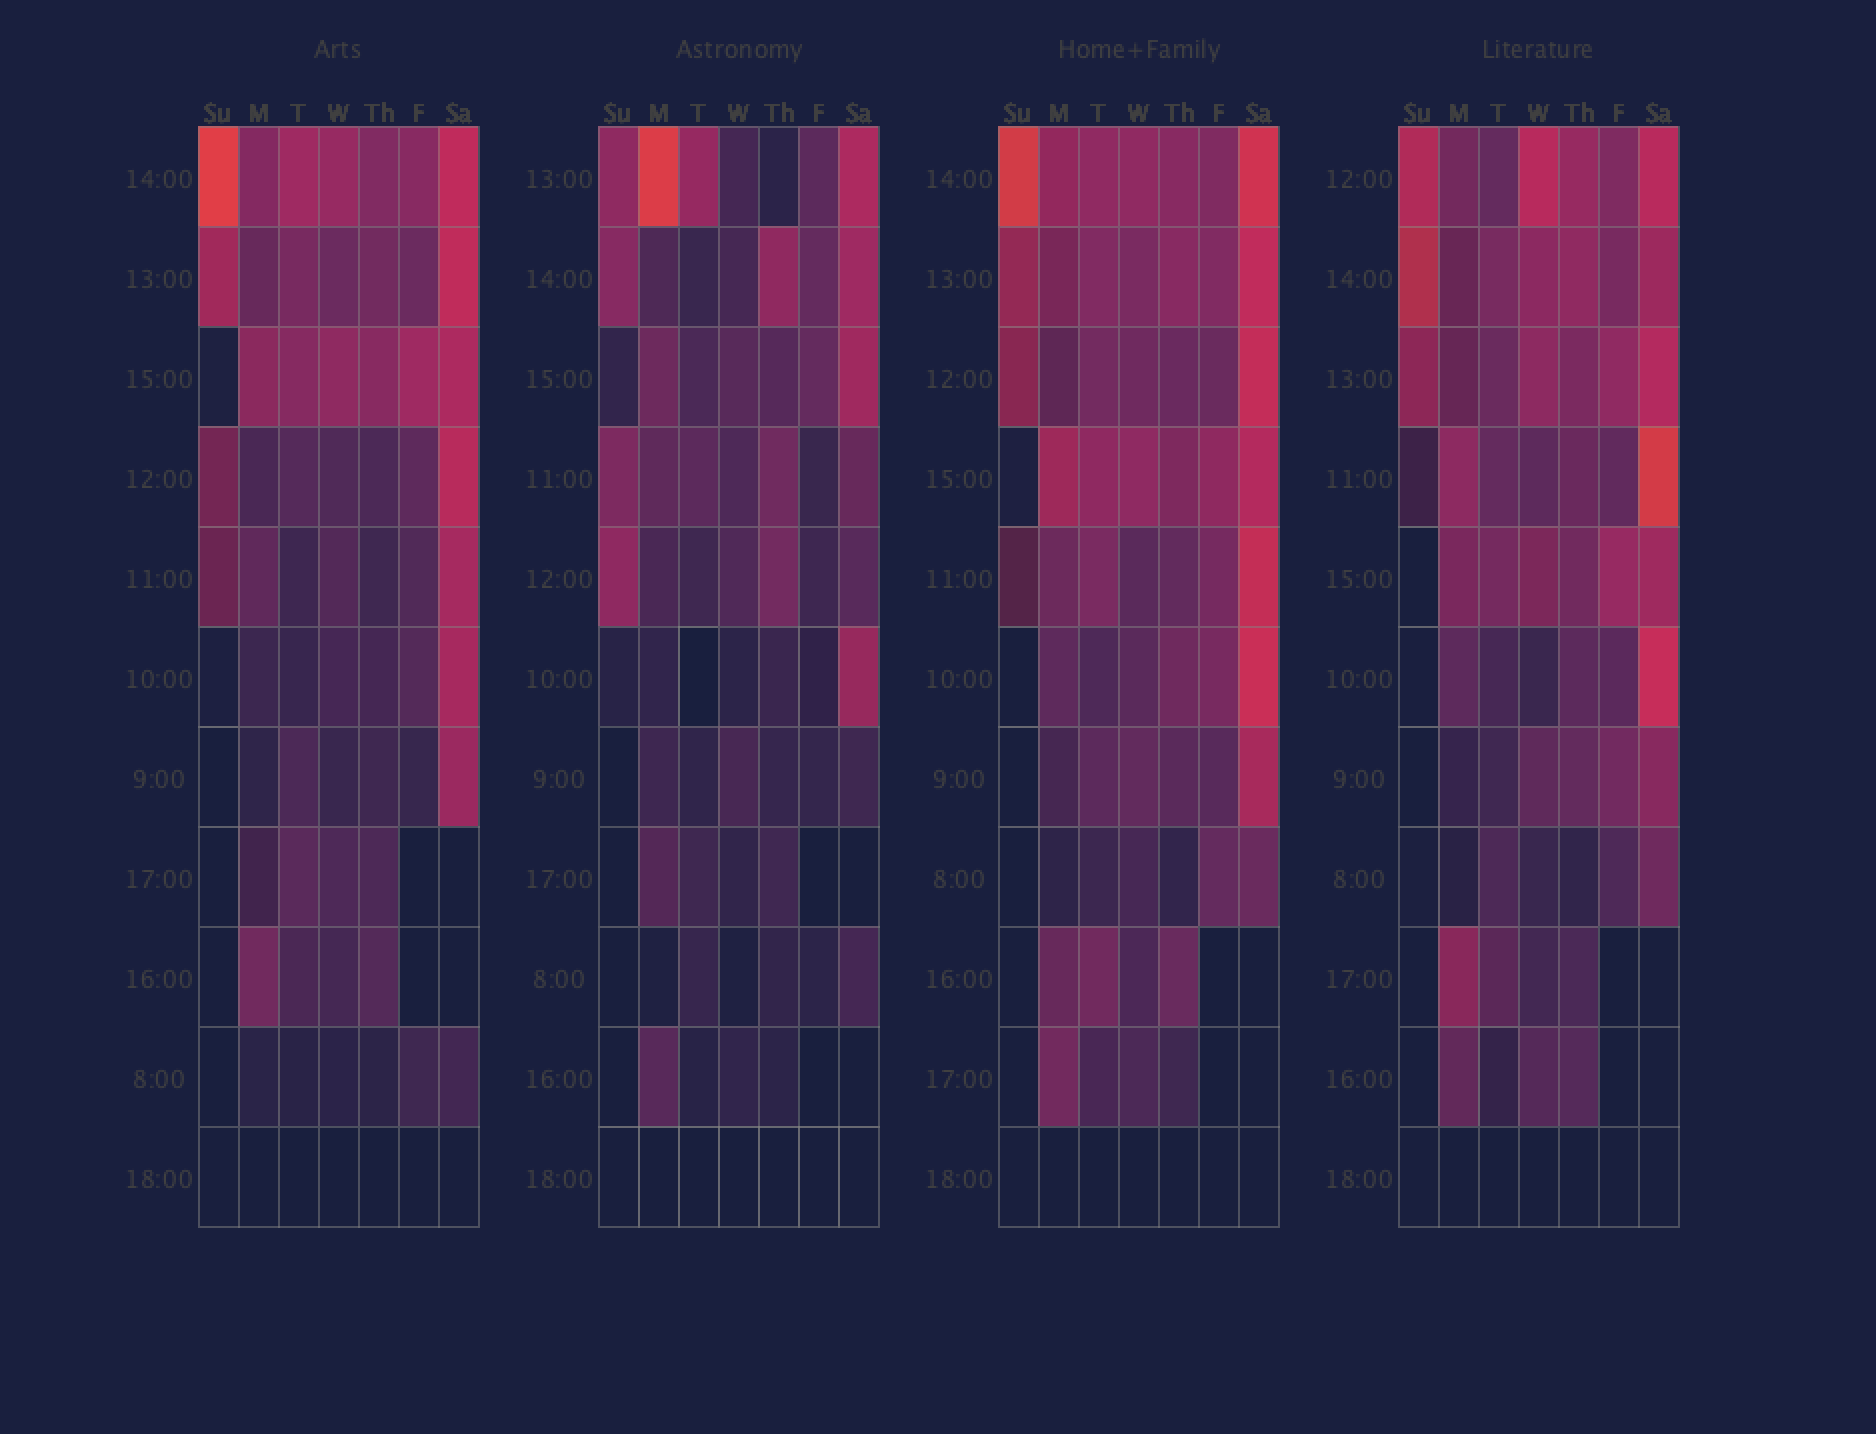
chronological
sorted by average
sorted by standard deviation
Process
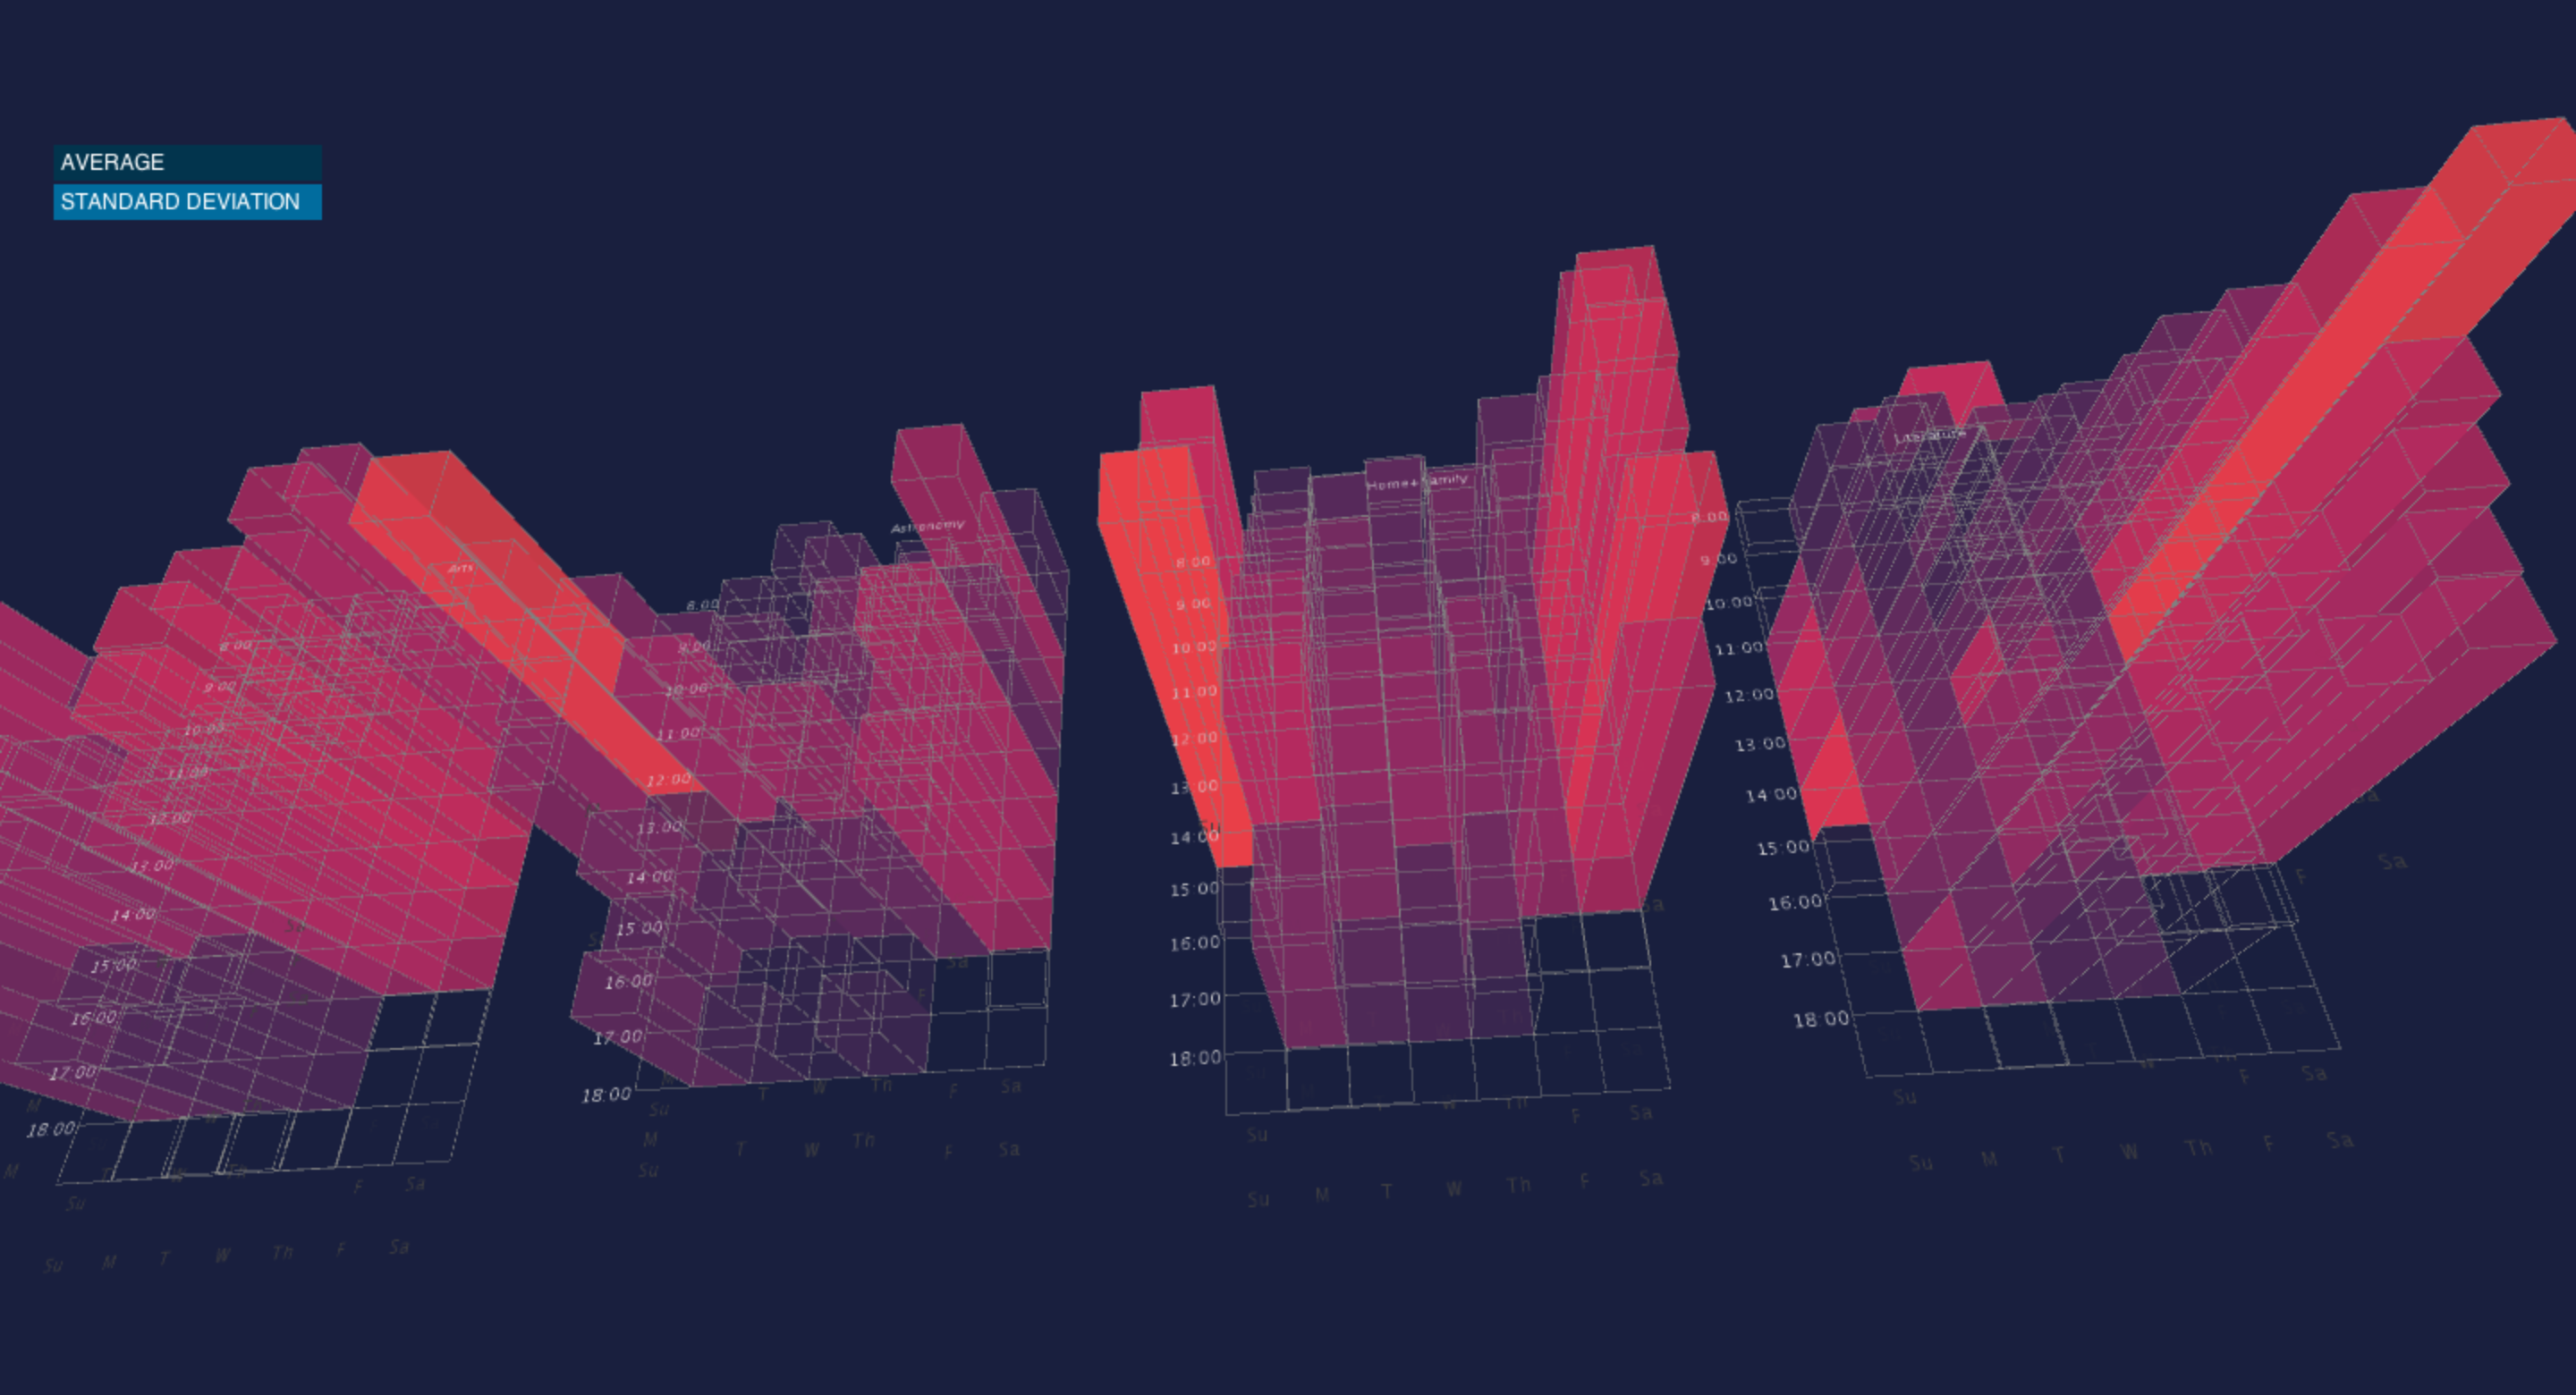
I was able to find a better color scheme that would look more similar to a heat mapping however I was having an issue in that it was hard to tell the relevance of any of the color. What's dense? what's sparse? everything seemed equally important and this simply was not the case.
Final result
sorted by average
sorted by standard deviation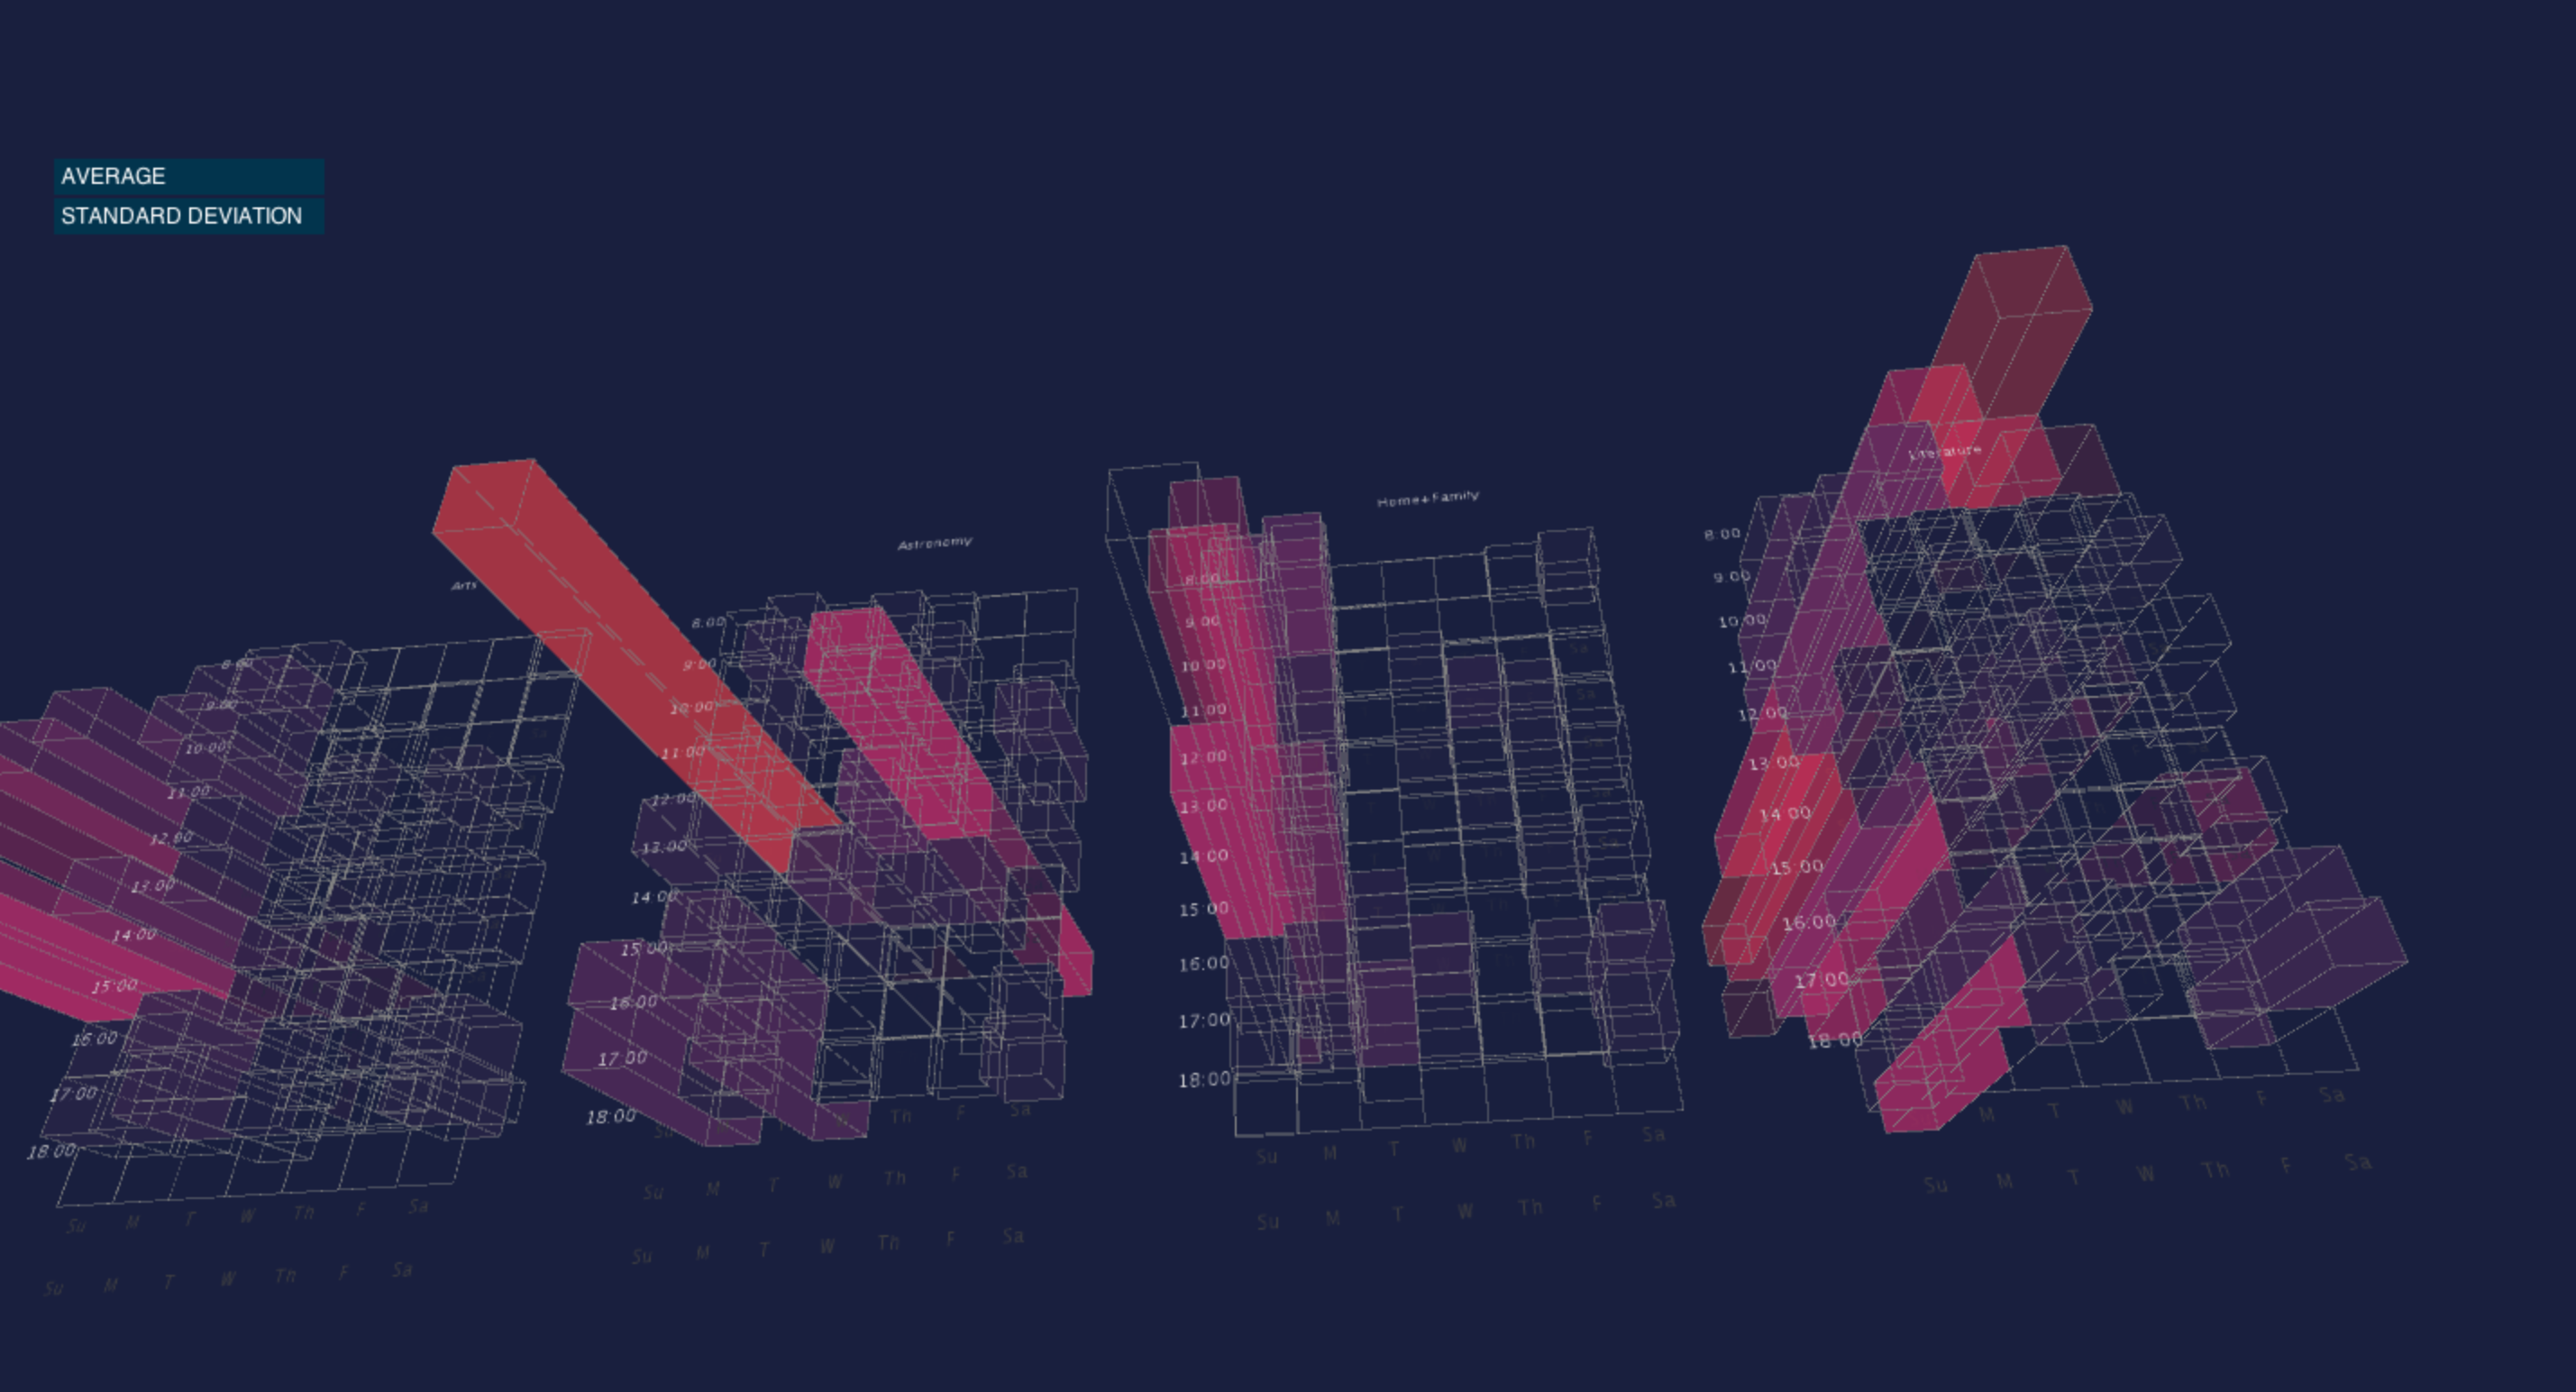
sorted by standard deviation
Code
I used Processing.
Control: A = sort by average
C = chronological
S = sort by standard deviation
Source Code + Data
Control: A = sort by average
C = chronological
S = sort by standard deviation
Source Code + Data