Trends of Modern Western Philosophy
MAT 259, 2015
Brock Noah
Concept
My previous visualization showed how weekly checkouts of a subclass compared to its siblings within a larger parent class. I wanted to continue a similar path of ranking an item in a group. For this next search I would narrow down to a topic that might change over time. I wanted to avoid a situation with consistent polar opposites, but I wouldn't know until I searched.
Query
SUM(CASE WHEN month(cout) = 1 THEN 1 ELSE 0 END) as January,
SUM(CASE WHEN month(cout) = 2 THEN 1 ELSE 0 END) as February,
SUM(CASE WHEN month(cout) = 3 THEN 1 ELSE 0 END) as March,
SUM(CASE WHEN month(cout) = 4 THEN 1 ELSE 0 END) as April,
SUM(CASE WHEN month(cout) = 5 THEN 1 ELSE 0 END) as May,
SUM(CASE WHEN month(cout) = 6 THEN 1 ELSE 0 END) as June,
SUM(CASE WHEN month(cout) = 7 THEN 1 ELSE 0 END) as July,
SUM(CASE WHEN month(cout) = 8 THEN 1 ELSE 0 END) as August,
SUM(CASE WHEN month(cout) = 9 THEN 1 ELSE 0 END) as September,
SUM(CASE WHEN month(cout) = 10 THEN 1 ELSE 0 END) as October,
SUM(CASE WHEN month(cout) = 11 THEN 1 ELSE 0 END) as Novermber,
SUM(CASE WHEN month(cout) = 12 THEN 1 ELSE 0 END) as December
FROM spl2.inraw
WHERE year(cout) ="2007"
AND (itemtype LIKE "%bk")
AND deweyClass is not null
AND deweyClass >= 190 AND deweyClass < 200
group BY floor(deweyClass) order by floor(deweyClass) ASC
Initial
Process
I searched through 190 Modern Western Philosophy, and its 10 subclasses. Other topics I would like to explore are 640 Home & family management and 680 Manufacture for specific uses.
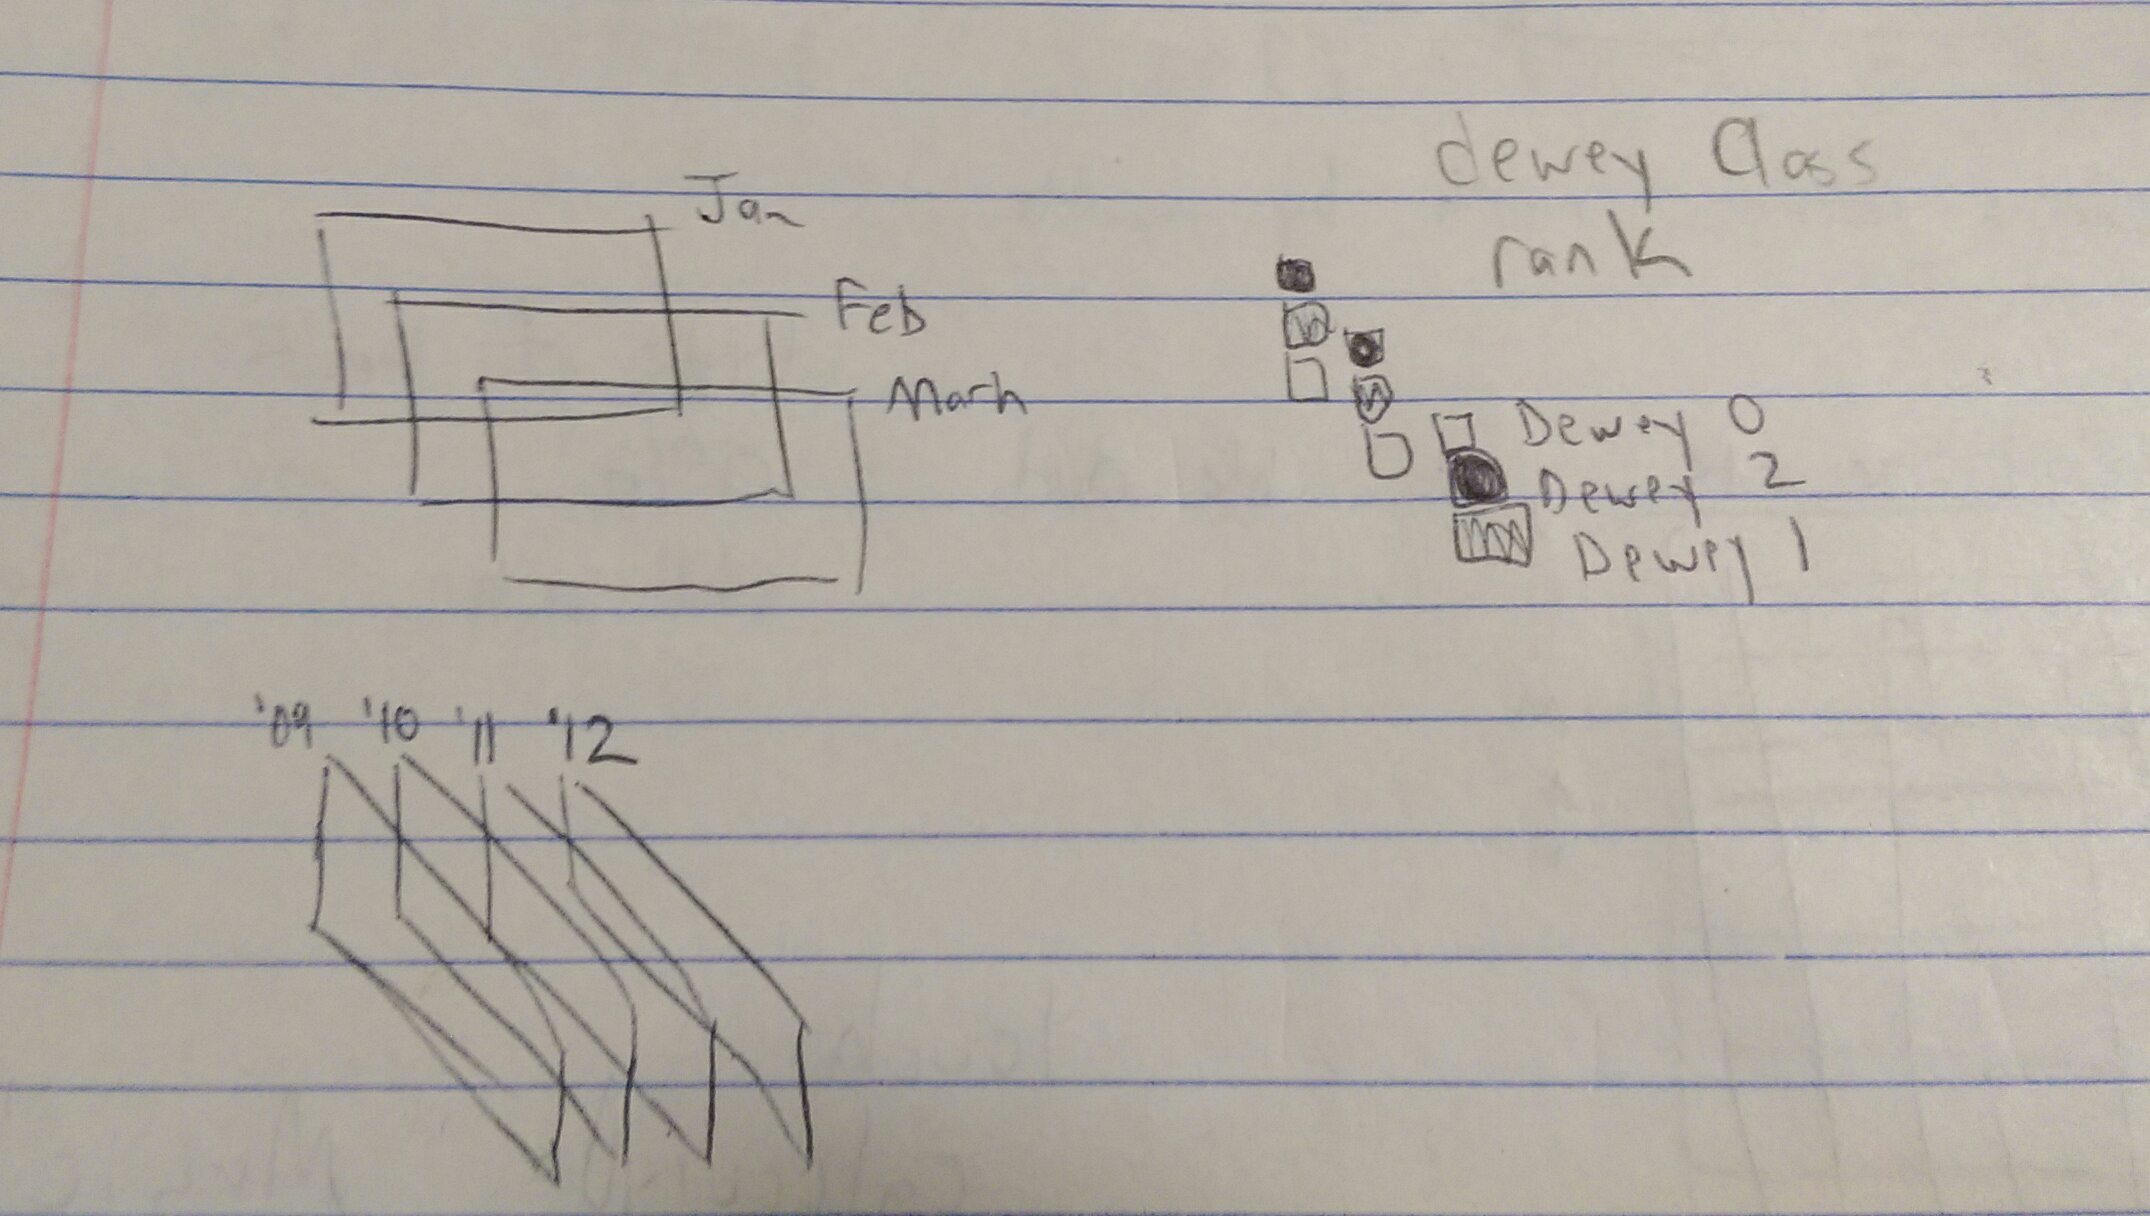
Instead of tracking weekly checkouts for one year, I capture an instance of a "ranking order" for each month for 6 years. Plot these points to track changes over time. In a boring system with no change or variation, each dewey class would fill a flat horizontal plane. A consistent checkout rate compared to others, each class would stay in the same place month after month.
Instead of tracking weekly checkouts for one year, I capture an instance of a "ranking order" for each month for 6 years. Plot these points to track changes over time. In a boring system with no change or variation, each dewey class would fill a flat horizontal plane. A consistent checkout rate compared to others, each class would stay in the same place month after month.
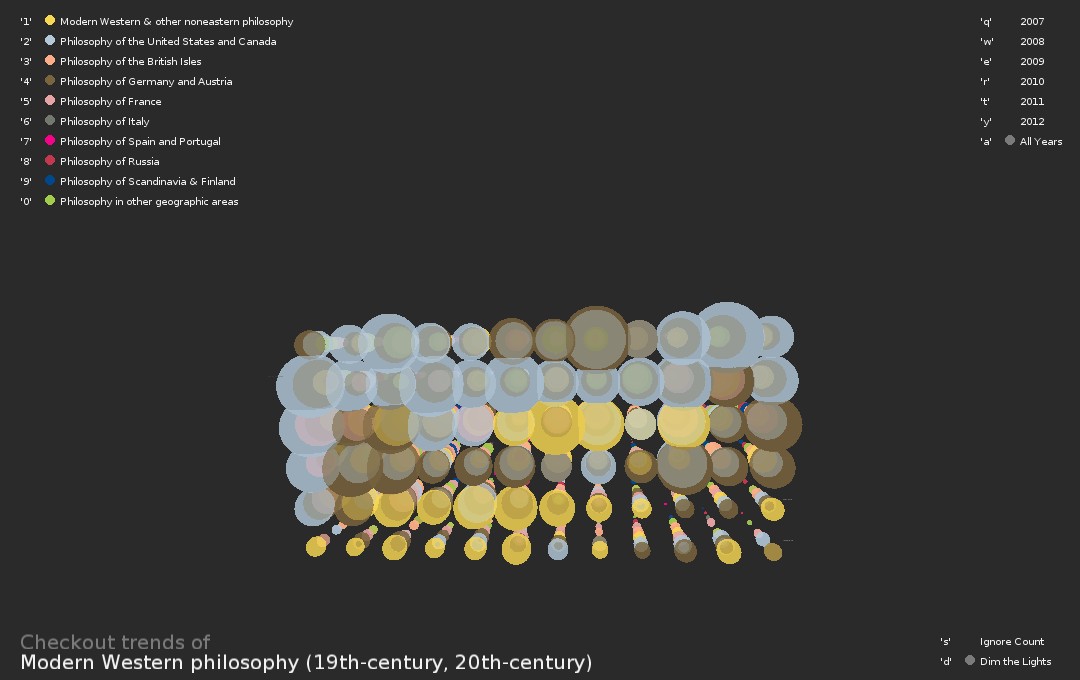
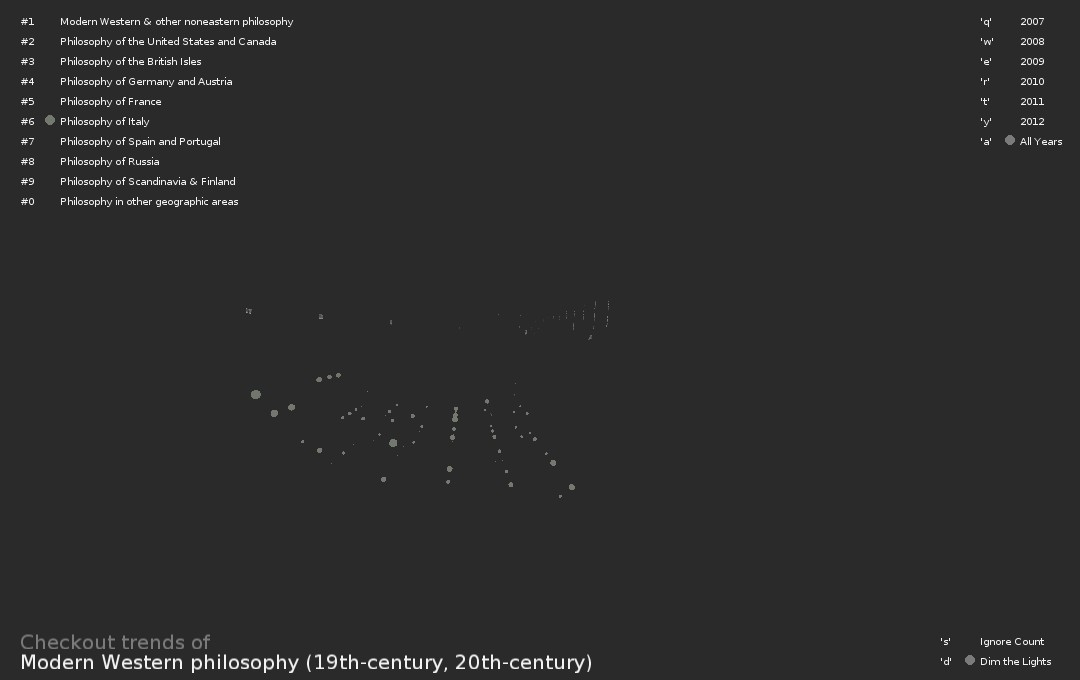
Final result
You can toggle the size of the sphere. The size is either related to the number of checkouts, or all sizes are equal (expect 0 checkouts). You can set all spheres to be the same to focus more on the change over time compared to others, not compared to the number of checkouts. You also have the option to view a particular year or all years at once.
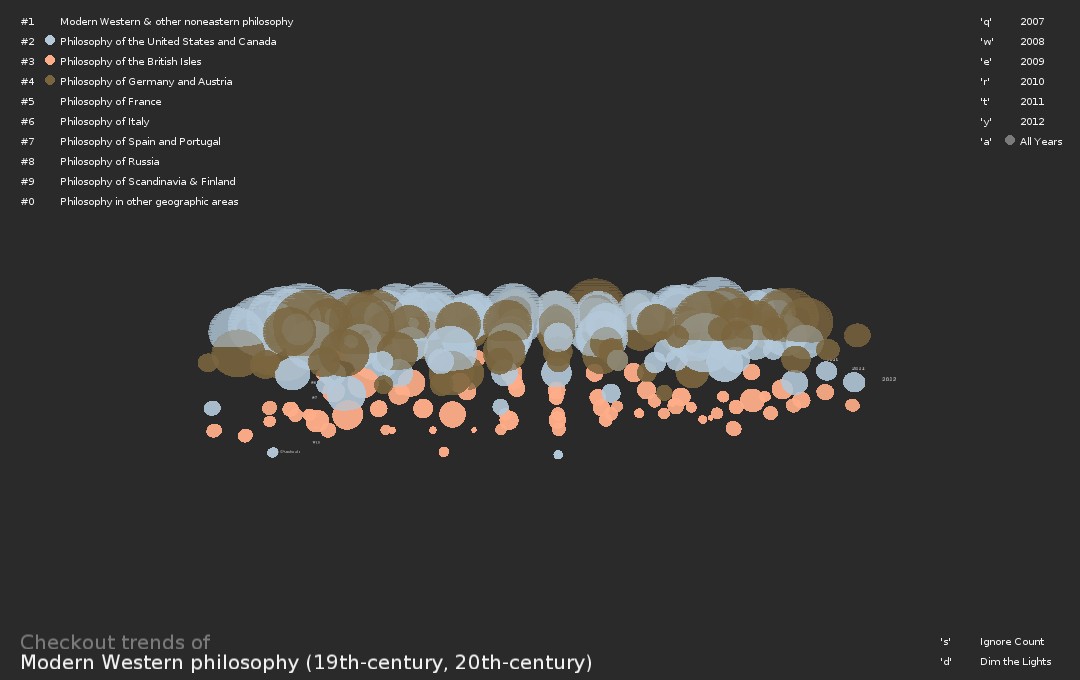
US & Canada VS Germany VS Britian all years
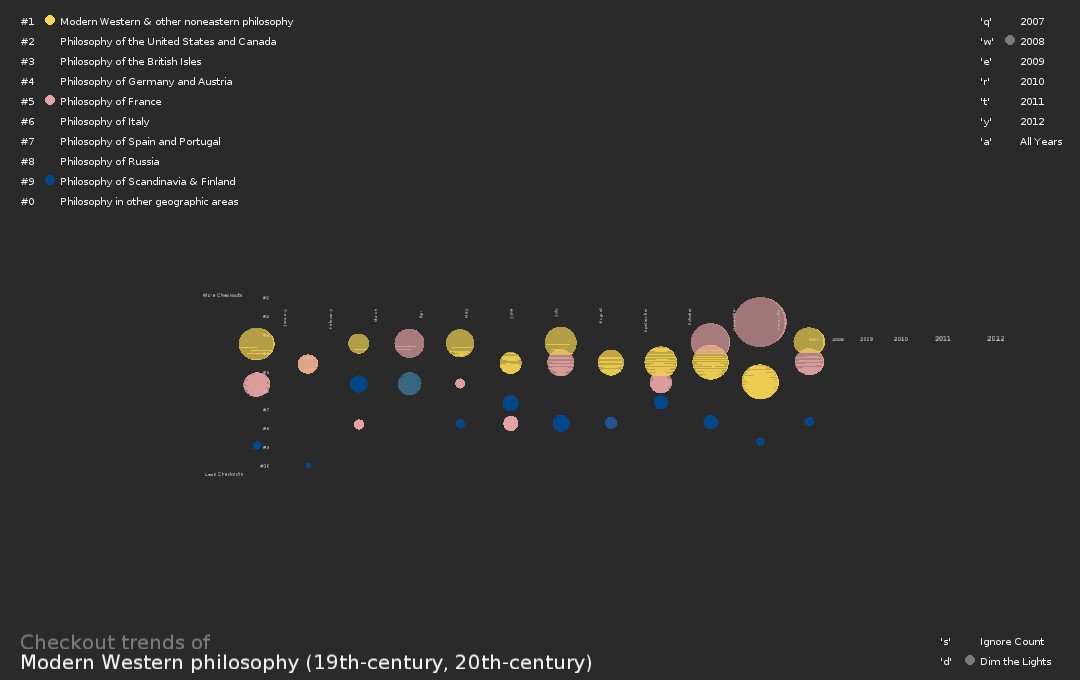
Italy All Years
US & Canada VS Germany VS Britian all years
Italy All Years
Code
I used Processing.
Control:
Numbers 1, 2, 3, 4, 5, 6, 7, 8, 9, 0 each represent a type of Philosophy
q, w, e, r, t, y to toggle individual years
a for all years
s to ignore the count and make all spheres same size
Source Code + Data
Control:
Numbers 1, 2, 3, 4, 5, 6, 7, 8, 9, 0 each represent a type of Philosophy
q, w, e, r, t, y to toggle individual years
a for all years
s to ignore the count and make all spheres same size
Source Code + Data