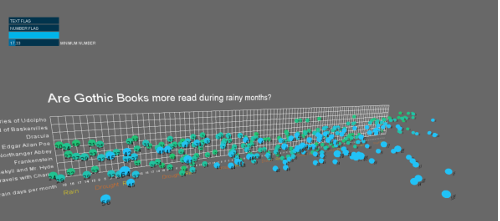
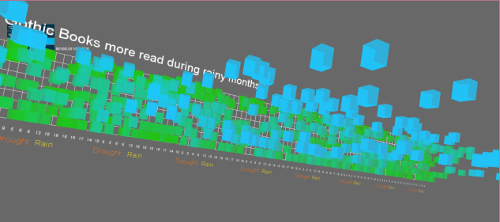
In this assignment I used the same data for the 2D matrix - gothic books checked out in the Seattle Public Library from January 2006 to December 2013. I question if gothic books are more read during rainy months.
Same as previous query:
SELECT
MONTH(cout),
YEAR(cout),
COUNT(IF(TITLE LIKE
'%Udolpho%', 1, NULL)) AS 'Mysteries of Udolpho',
COUNT(IF(TITLE LIKE '%Baskervilles%', 1, NULL)) AS 'The Hound of the
Baskervilles',
COUNT(IF(TITLE LIKE '%Dracula%', 1, NULL)) AS
'Dracula',
COUNT(IF(TITLE LIKE '%Edgar Allan Poe%',
1,
NULL)) AS 'Edgar Allan Poe',
COUNT(IF(TITLE LIKE
'%Northanger%', 1, NULL)) AS 'Northanger Abbey',
COUNT(IF(TITLE LIKE '%Frankenstein%', 1, NULL)) AS 'Frankenstein',
COUNT(IF(TITLE LIKE '%Jekyll%', 1, NULL)) AS 'Dr. Jekyll and Mr.
Hyde',
COUNT(IF(TITLE LIKE '%Into the Wild%',
1,
NULL)) AS 'Into the Wild'
FROM
spl2.inraw
WHERE
itemtype = 'acbk'
AND DATE(cout) >= '2006-01- 01'
AND DATE(cout) <= '2013-12-31'
GROUP BY MONTH(cout) ,
YEAR(cout)
ORDER BY YEAR(cout) , MONTH(cout)
I tried to use spheres as a way to make the data look like raindrops, but at the end the boxes were better for the visualization.
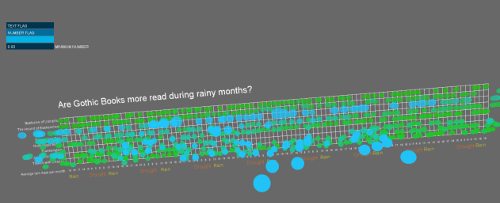
The project is based in the 3D demonstration by Mohit. As the number of rows is larger than the example, I adapted the size of the boxes to get a better visualization.
To resemble a cloud with raindrops, I opted to paint the background with gray and used blue in the boxes to indicate the highest values of the matrix.
I also built a scale to indicate the average days of rain during the month and to mark the beginning of the periods of Drought and Rain.
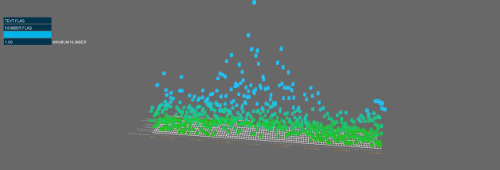
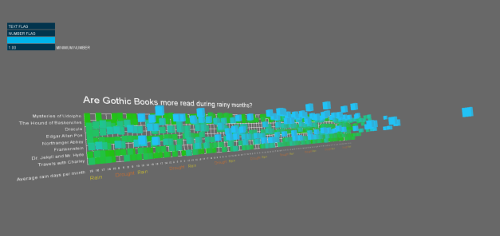
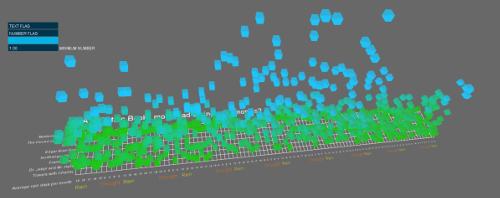
Among the features, I used Control P5 to create buttons showing and hiding the text and grid, and a button that controls the minimum values appearing on the graphic.
Source Code + Data