Data Science on GitHub
MAT 259, 2015
Anastasiya Lazareva
Concept
I decided to use the GitHub API for this project to collect data on repositories that are related to data visualization and machine learning.
Query
I used the following API https://developer.github.com/v3/ along with geo coordinate data from http://www.datasciencetoolkit.org/ API. I first collected the data and saved it in JSON files since there was a rate limit for the API.
Code used to collect data
Preliminary sketches
There were no premiminary sketches for this project.
Process
The following data was collected from the GitHub API
- repository name
- repository size
- number of watchers
- owner
- owner's profile picture
- language
- code frequency: Returns a weekly aggregate of the number of additions and deletions pushed to a repository.
- commit activity: Returns the last year of commit activity grouped by week. punch card: Each array contains the day number, hour number, and number of commits
Final result
The final visualization has the following features:
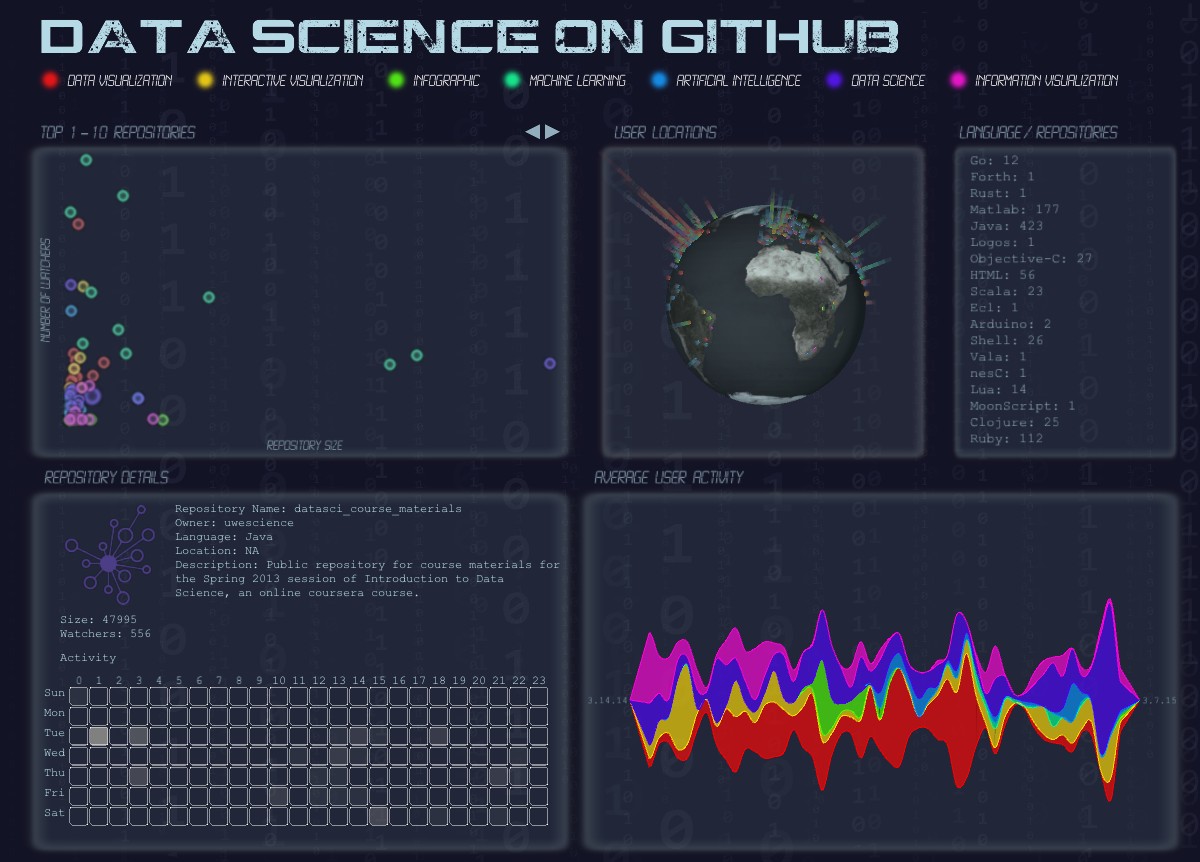
- legend with keywords let's users select the topics they are interested in
- repository scatter plot that shows size/watcher count information (can scroll through the entire dataset using arrows), if a repository is clicked, repository details appear which include the user picture, some info about the repository and a time card visualization showing when the user is most active.
- a rotating globe showing user locations, the bars coming out of the globe represent the number of repositories associated with the keyword.
- language window: shows how many repositories use a language for the selected set of topics
- average user activity: shows a stream graph of average commit activities over the last year.
Code
I used Processing.
Control: All user interaction is contained within the UI. The user can enable/disable keywords at the top and click on the repository graph to get more detailed information about individual repositories.
Source Code + Data
Control: All user interaction is contained within the UI. The user can enable/disable keywords at the top and click on the repository graph to get more detailed information about individual repositories.
Source Code + Data