Three-Dimensional Interactive Project
MAT 259, 2013
Saeed Mahani
Introduction
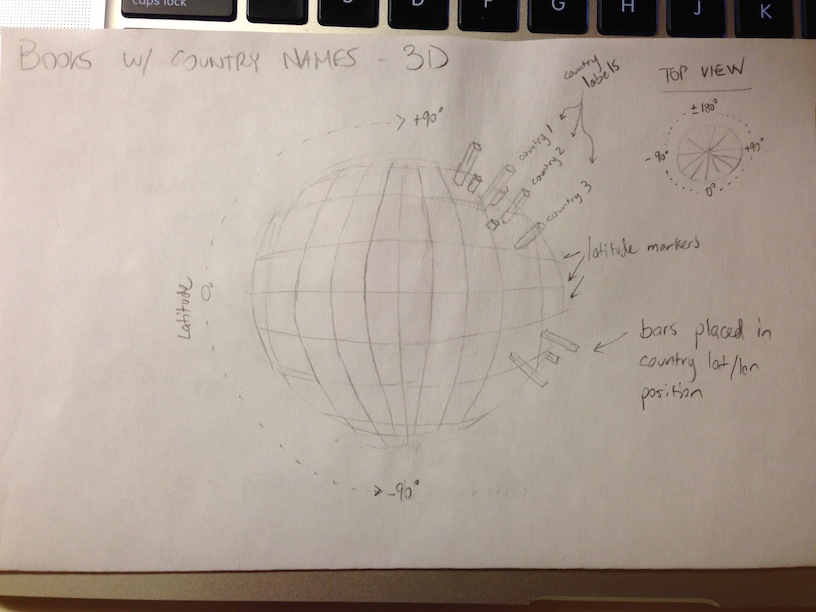
For this project, I was interested in visualizing the frequency of occurrence of country names in the subject of books over time. I thought that perhaps the many world events of the past few years may be discernible in the data fluctuations of book checkouts. And, since this project was in 3D, I thought why not visualize something geographical like this on an actual globe. The result is a sphere-based 3D bar graph showing popularity over time of all the major countries around the world based on book checkouts.
Before I could pursue this idea I needed to make sure there was a way of determining the latitude and longitude of every country. Luckily, this information is publicly available on several websites in the form of a CSV, organized by country code (a universal two character sequence unique to each country). Since some countries have special characters or symbols in their title, it was important to sanitize all strings before performing SQL queries, and use the country code wherever possible.
Before I could pursue this idea I needed to make sure there was a way of determining the latitude and longitude of every country. Luckily, this information is publicly available on several websites in the form of a CSV, organized by country code (a universal two character sequence unique to each country). Since some countries have special characters or symbols in their title, it was important to sanitize all strings before performing SQL queries, and use the country code wherever possible.
Sketch
Query
SELECT
sum(case when (subject = 'andorra' or subject like 'andorra %' or subject like '% andorra' or subject like '% andorra %') then 1 else 0 end) as 'andorra',
sum(case when (subject = 'united arab emirates' or subject like 'united arab emirates %' or subject like '% united arab emirates' or subject like '% united arab emirates %') then 1 else 0 end) as 'united arab emirates',
...
sum(case when (subject = 'south africa' or subject like 'south africa %' or subject like '% south africa' or subject like '% south africa %') then 1 else 0 end) as 'south africa',
sum(case when (subject = 'zambia' or subject like 'zambia %' or subject like '% zambia' or subject like '% zambia %') then 1 else 0 end) as 'zambia',
sum(case when (subject = 'montenegro' or subject like 'montenegro %' or subject like '% montenegro' or subject like '% montenegro %') then 1 else 0 end) as 'montenegro'
FROM subject, activity
WHERE subject.bib = activity.bib and year(activity.o) >= 2006 and year(activity.o) <= 2012
GROUP BY year(activity.o);
Query Explanation
The query above has been shortened for brevity, since it is nearly 240 lines long. Each country needs to be specified individually, and assigned to it's own column. The rows span the years from 2006 to 20012, and show a value indicating the frequency of occurrence of each country in book subjects. This query runs in approximately 16 hours on the newer spl1 database. It's not very complicated, but does perform a large amount of work and counting.
Process
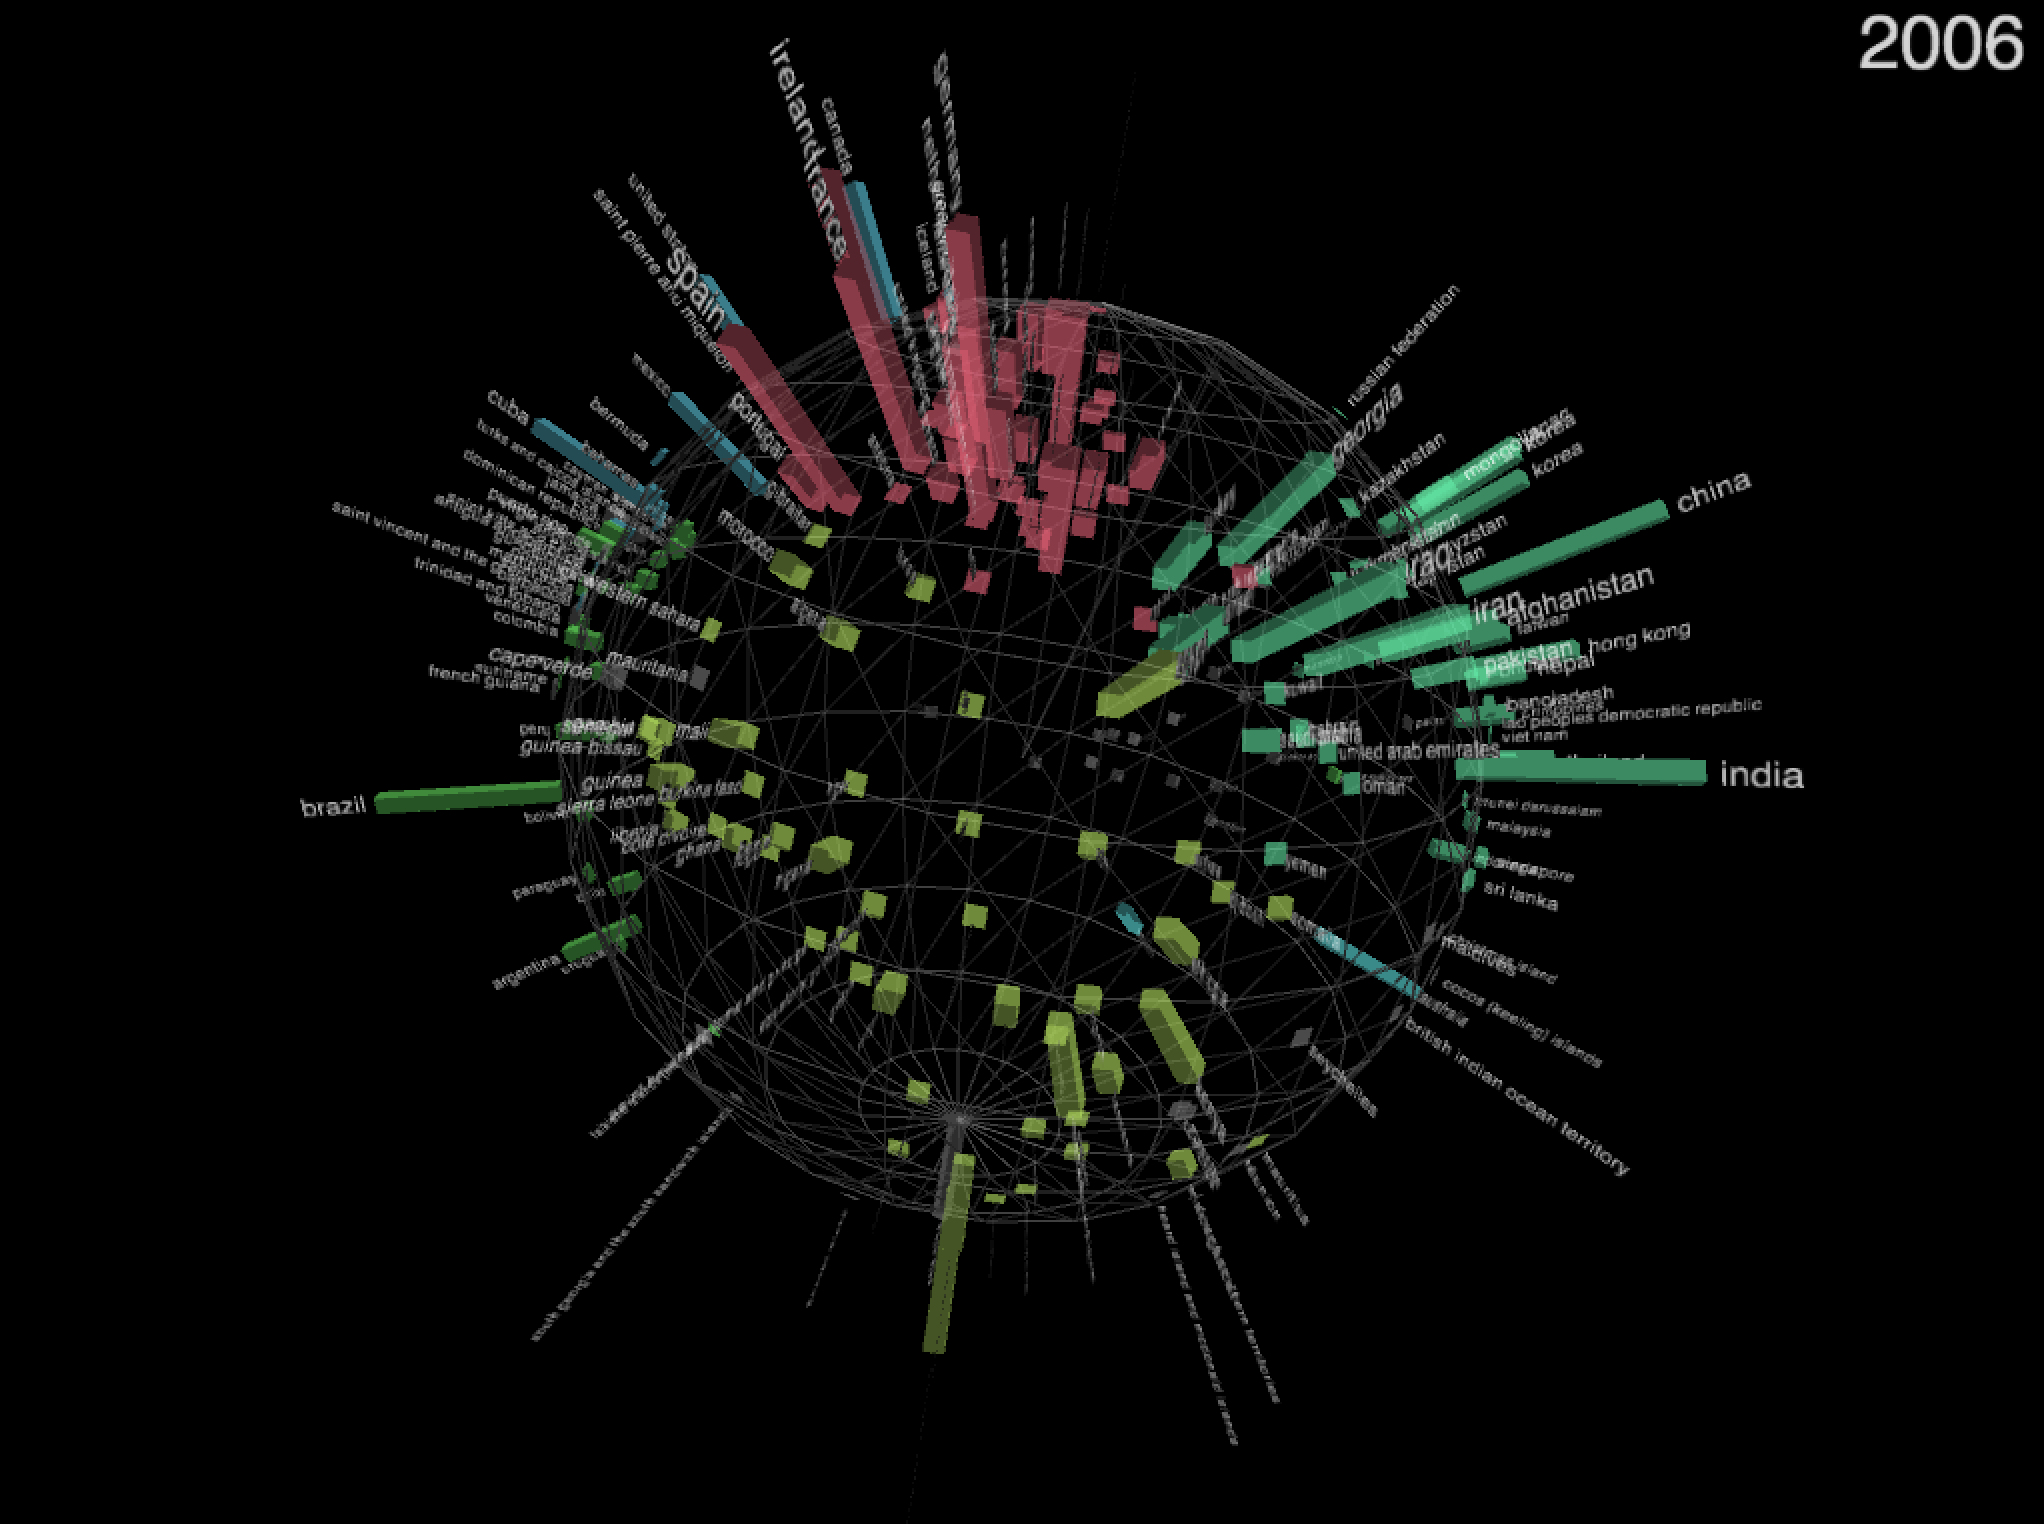
With the latitude and longitude of every country in hand, it was simply a matter of performing two rotations around the 3D globe to position the frequency bars of each country in the correct place. I colored these bars according to continent, and placed labels on the ends to display the country name in a way that minimized overlap.
A tricky problem I had to solve was how half the text labels on the screen were essentially backwards due to the curve of the globe surface. I had to make some calculations based on the location of the camera and flip the text labels at the appropriate time so that they were always facing the user.
A tricky problem I had to solve was how half the text labels on the screen were essentially backwards due to the curve of the globe surface. I had to make some calculations based on the location of the camera and flip the text labels at the appropriate time so that they were always facing the user.
Results and Analysis
After gathering all the data and visualizing it, I quickly found out some interesting facts. Firstly, the US is the most popular country by far in the SPL database based on book subject. It actually skews the size of many other country bars to be 0 length, so I needed to cap the maximum for a better overall presentation.
It's interesting to explore the globe, adjusting the year with the left and right arrow keys, and see significant grow and decline across countries - typically those with heavy news coverage in the observed time range.
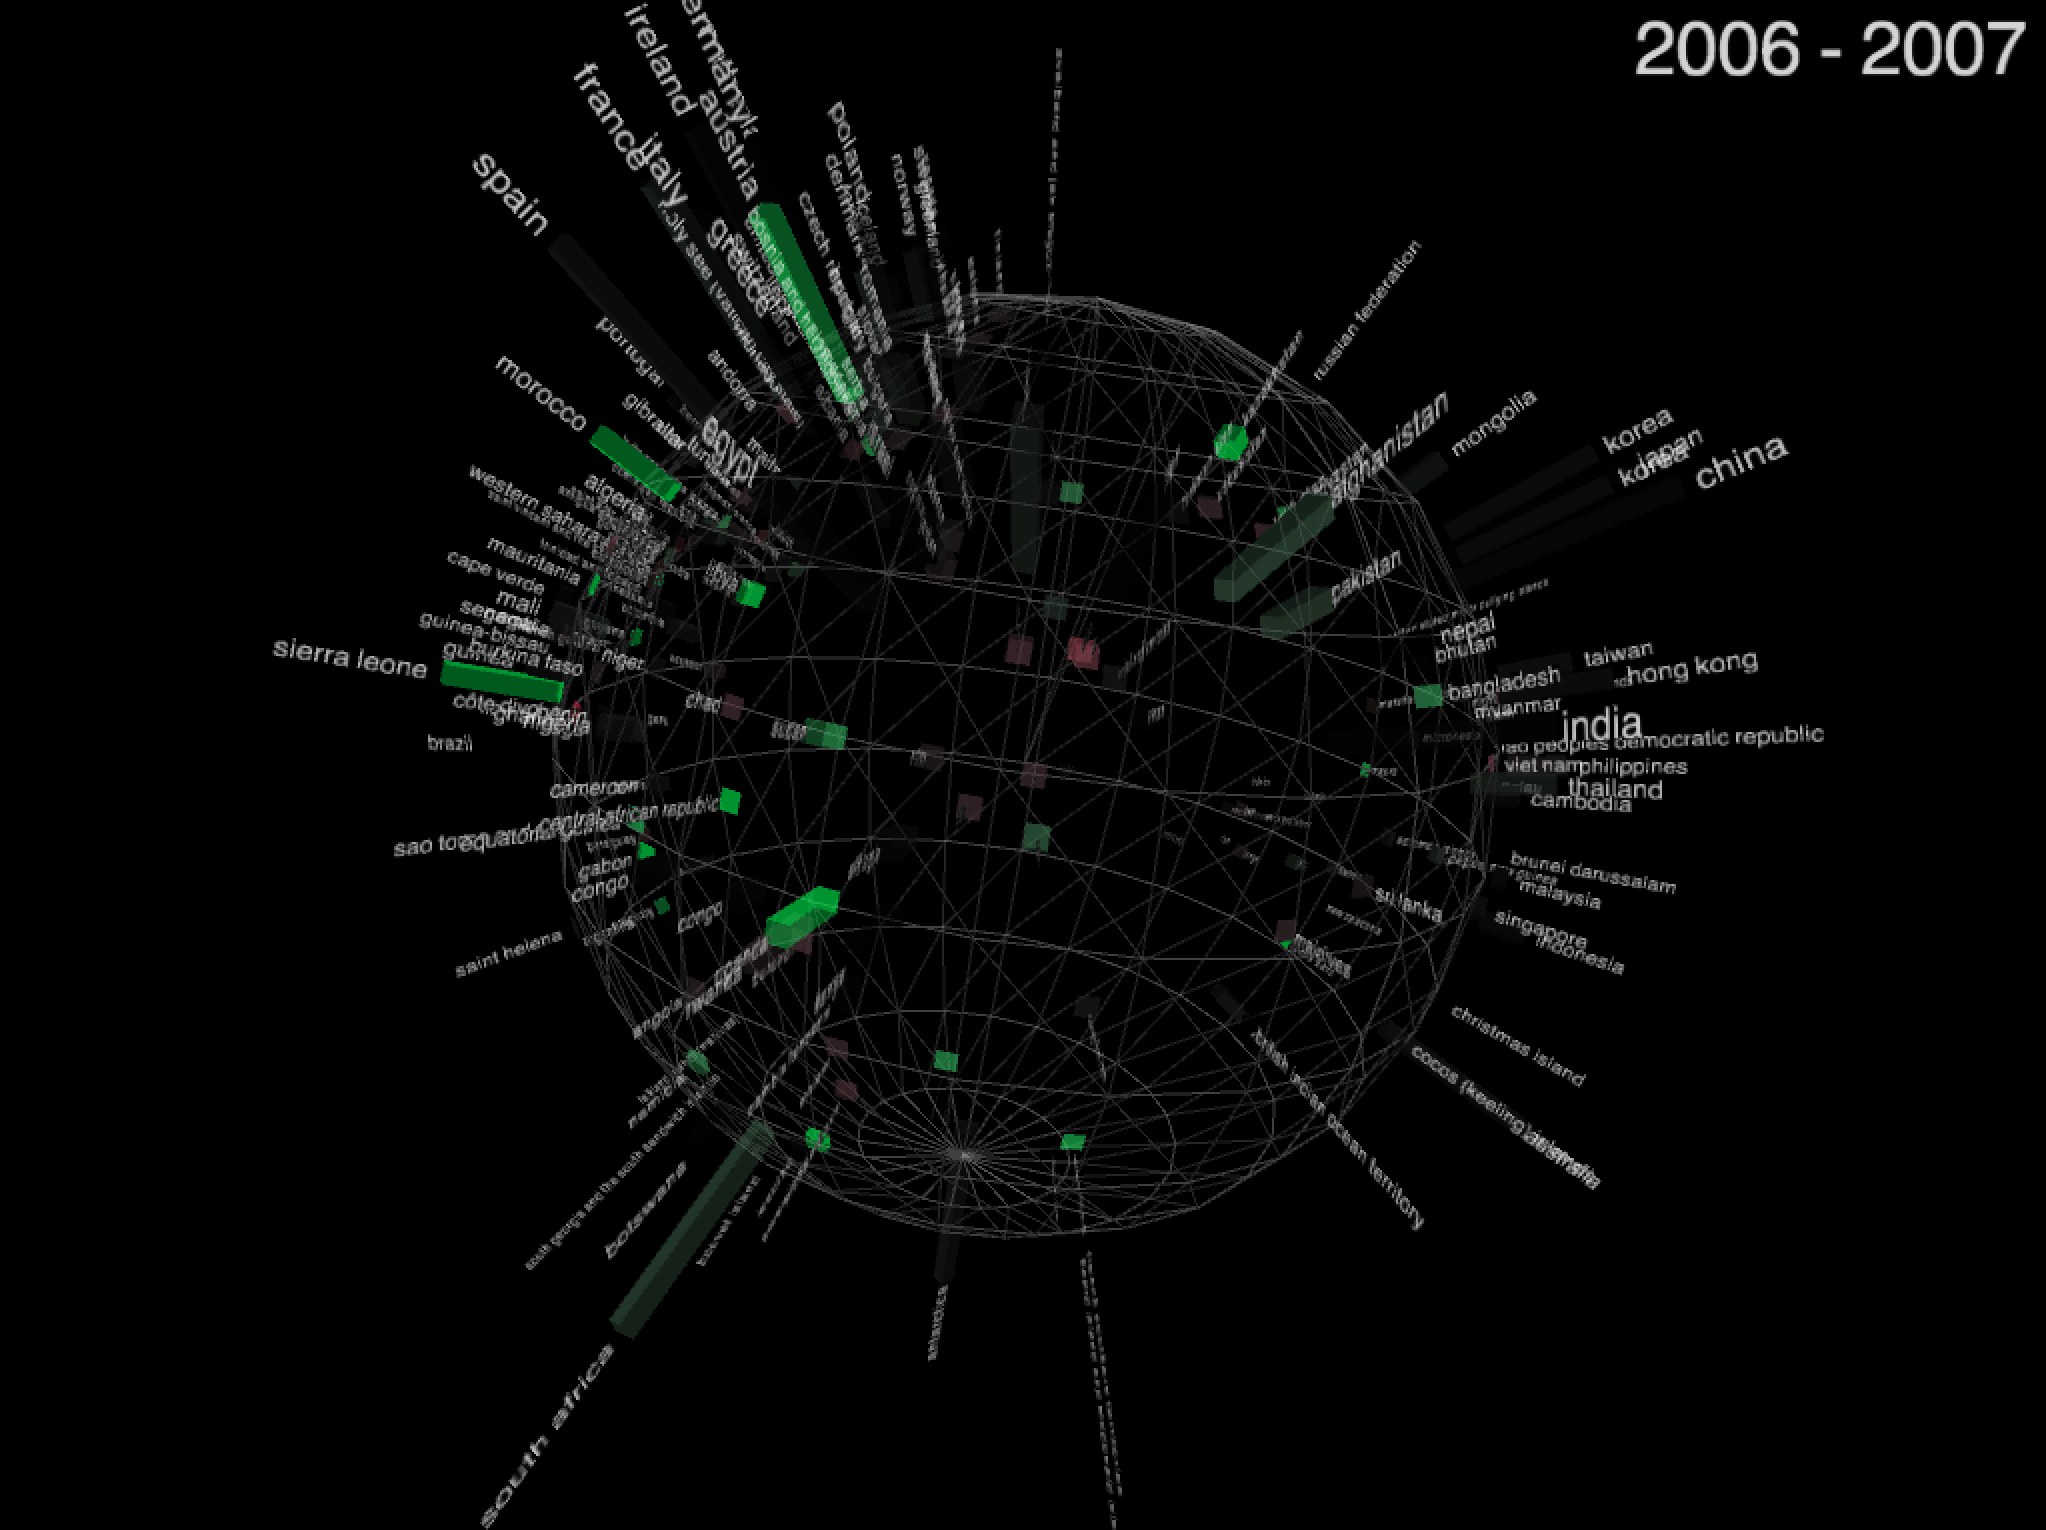
To visualize this change between years, I included an alternate view of the data. Pressing the 1 key toggles the difference mode, where positive change is visible as green bars, and negative change is red; the more drastic the change, the stronger the intensity of the color.
It's interesting to explore the globe, adjusting the year with the left and right arrow keys, and see significant grow and decline across countries - typically those with heavy news coverage in the observed time range.
To visualize this change between years, I included an alternate view of the data. Pressing the 1 key toggles the difference mode, where positive change is visible as green bars, and negative change is red; the more drastic the change, the stronger the intensity of the color.
Code
Control
1: Toggle normal view (colored by continent) / difference view
2: Show/hide country labels
2: Show/hide country labels