Three-Dimensional Interactive Project
MAT 259, 2013
Giovanni Sgambato
Introduction
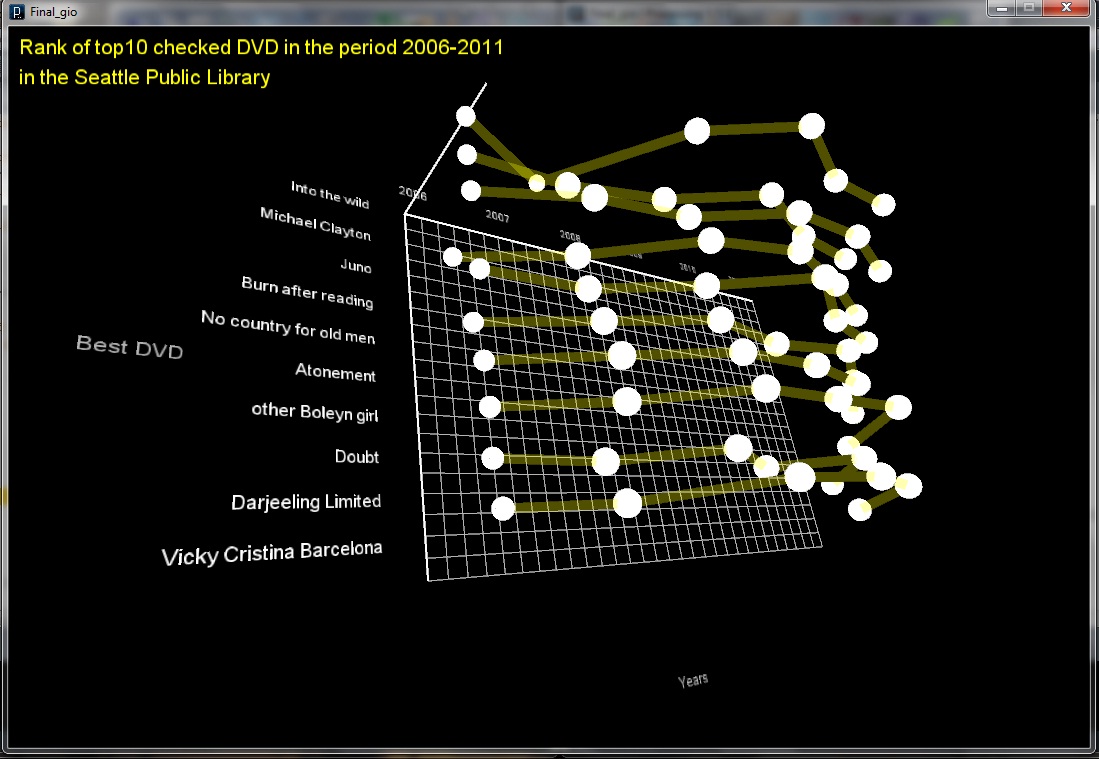
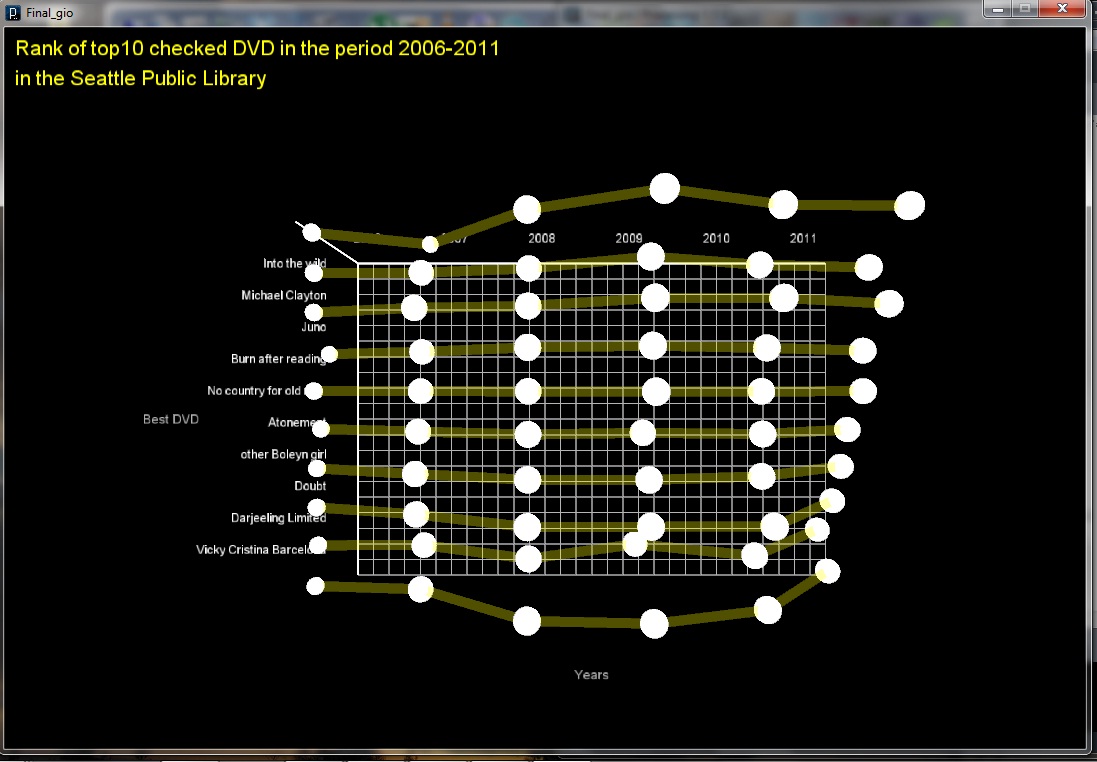
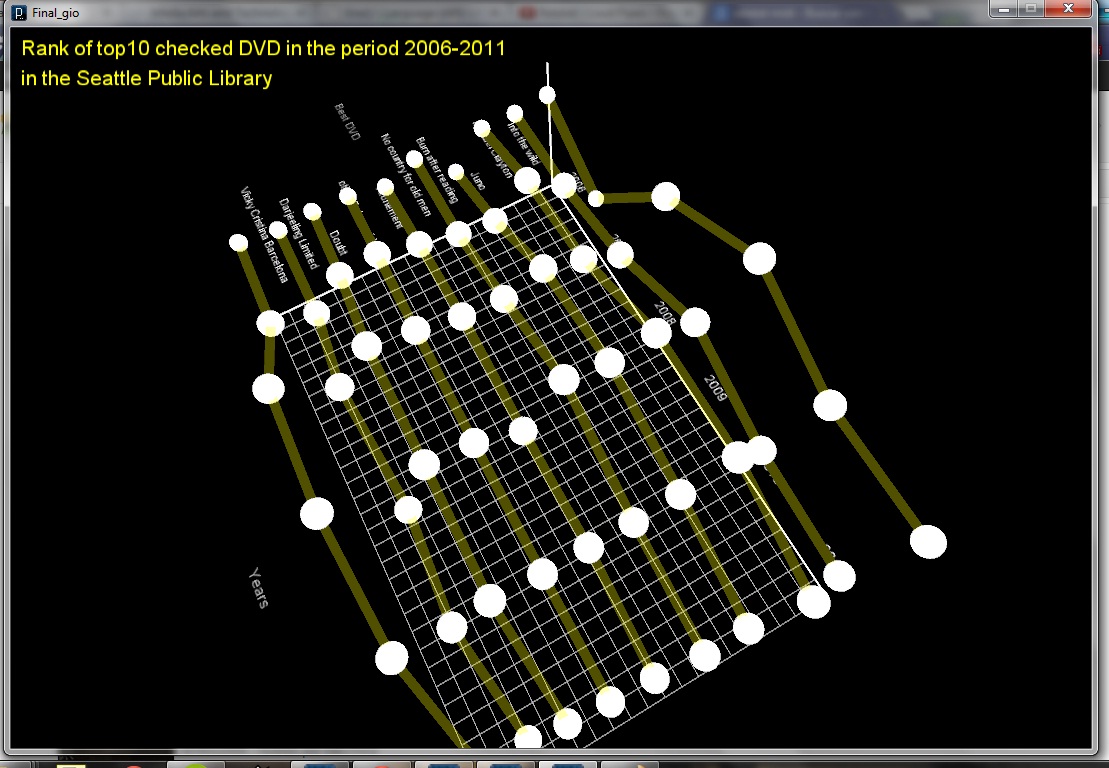
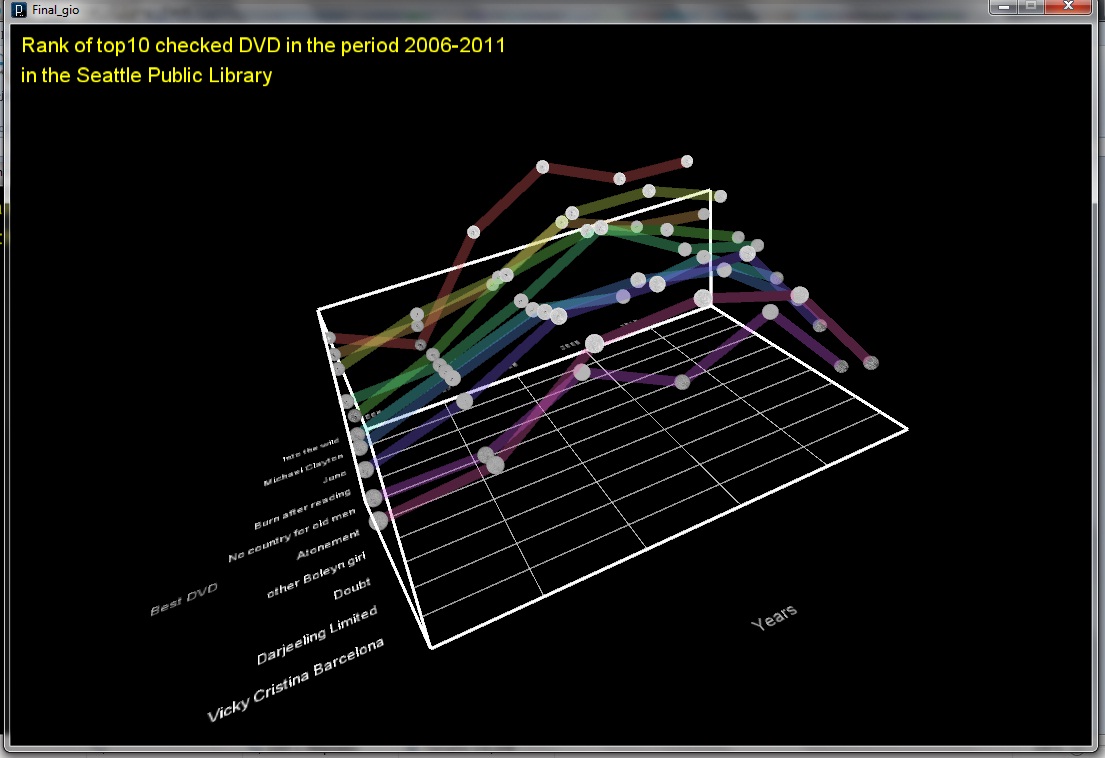
This is an upgraded version of my 3rd project where I wanted to visualize the trend of top 10 checked DVD in the period 2006-2011 in the Seattle Public Library.
Query
Query 1
SELECT title, count(*) FROM inraw WHERE year(ckoutDateTime) > '2005' and year(ckoutDateTime) < '2012' and itemtype like ‘%dvd%’ GROUP BY title ORDER BYcount(*) DESC LIMIT 10;
Query 2
SELECT title, count(*) FROM inraw WHERE year(ckoutDateTime) > '2005' and year(ckoutDateTime) < '2012' and title like ´#´ // title of the DVD GROUP BY month ORDER BY month;
Process
The process is splitted in 2 parts, in the first I’m querying what are the m10 ost checked DVD in the period 2006-2011, then i’m cheking per each title the amount of checks every year, to have both the total amount of checks and partial results.
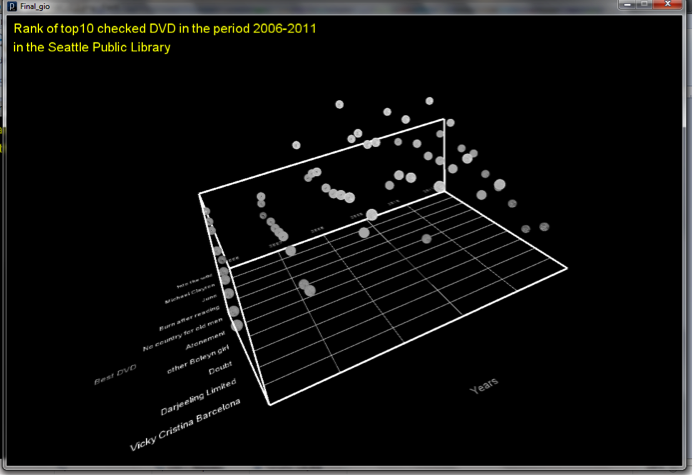
The transparency of the spheres representing the values is proportional to the value, pressing the button n.1 is possible to show or hide the track per each title.
Results and Analysis
Early version
Final version
Final version
Code
Control
1: visualize or hide the track of each DVD during time.