External Correlation
MAT 259, 2013
Giovanni Sgambato
Introduction
I would like to compare the trend between the number of checked items in the Seattle public library and the number of articles published in the New York Times containing the word “Europe”.
Process
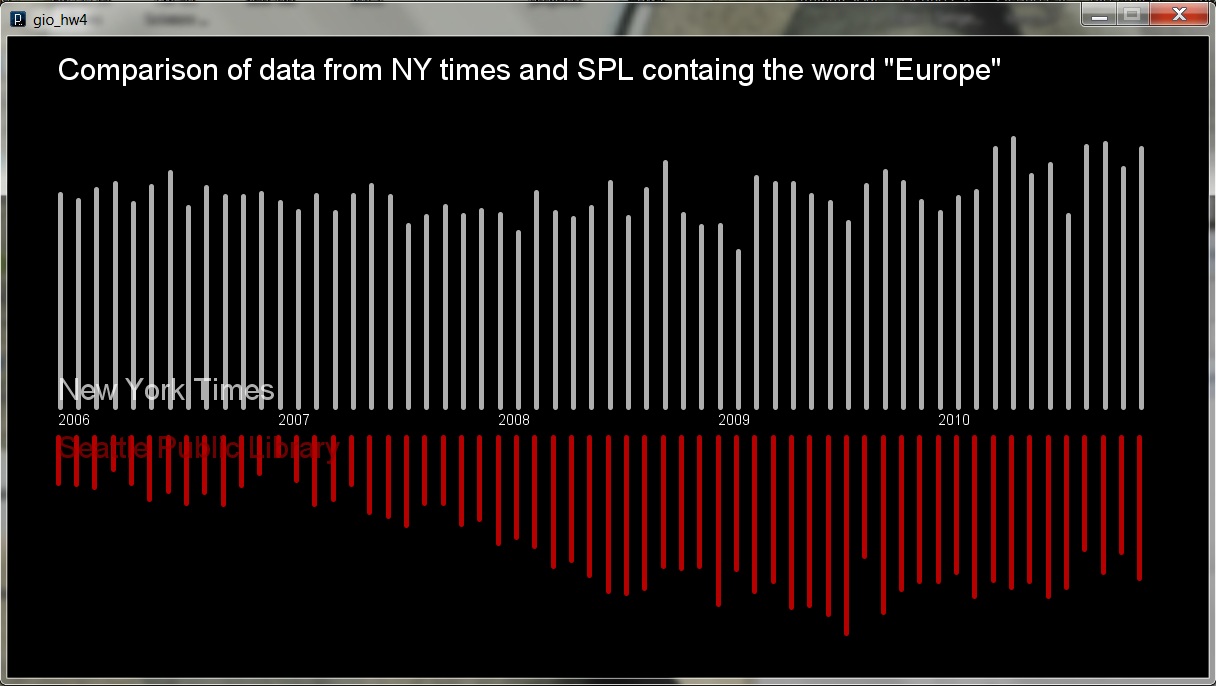
I produced a double bar-charts to visualize the SPL and NYT data comparing the trends during time.
Query
SELECT
year(cout), month(cout), count(*)
FROM
inraw
WHERE
title like '%europe%' and cout > '2006-01-01' and cout < '2012-01-01'
GROUP BY
year(cout), month(cout)
ORDER BY
year(cout), month(cout);
Results and Analysis
In this project I explored methods for compare and correlate data from different sources and show them in an effective way.
I also spent time in the data selection, filtering and sorting, producing 2 queries to fit the data to the aim of the project.
From the data I was able to get the number of items checked cotaining the word “Europe” and compare with the number of articles published o the New York Times.
Early Version
Early Version
Code
I used Processing and NYTimes - The Article Search API (http://developer.nytimes.com/docs/article_search_api/)
Run in Browser
Source Code
Run in Browser
Source Code
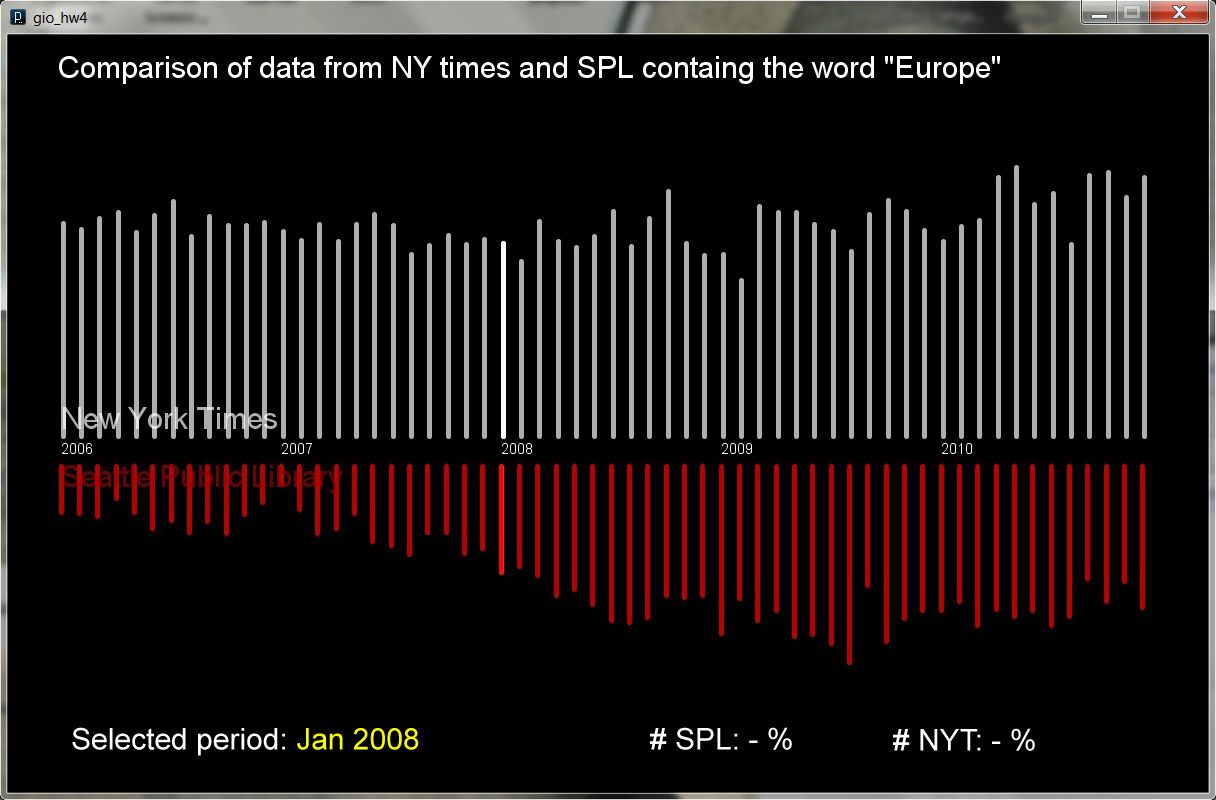
Control
Rolling with the mouse over the data is possible to select and underline a specific period and visualize the value of items checked and articles.