2D Spatial Map
MAT 259, 2013
Yeu-Shuan Tang
Introduction
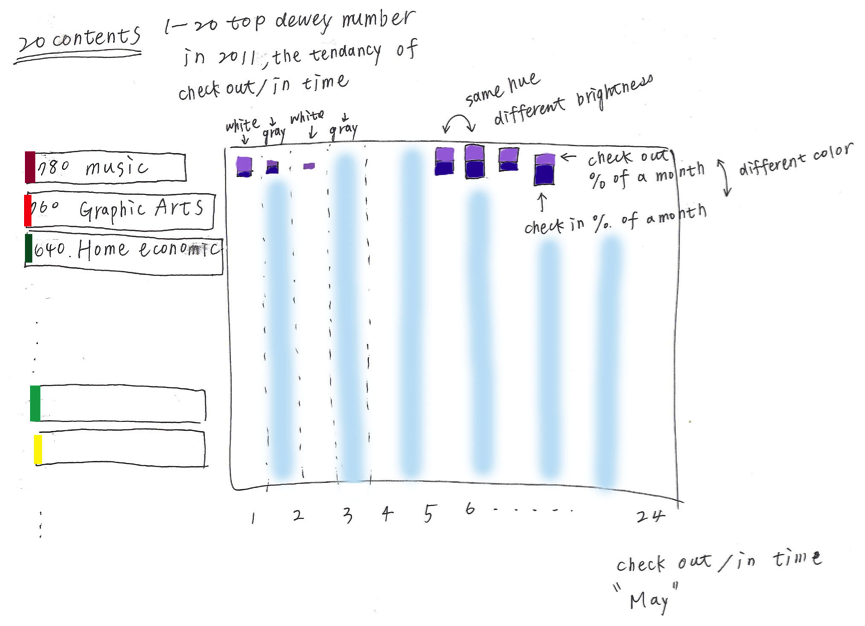
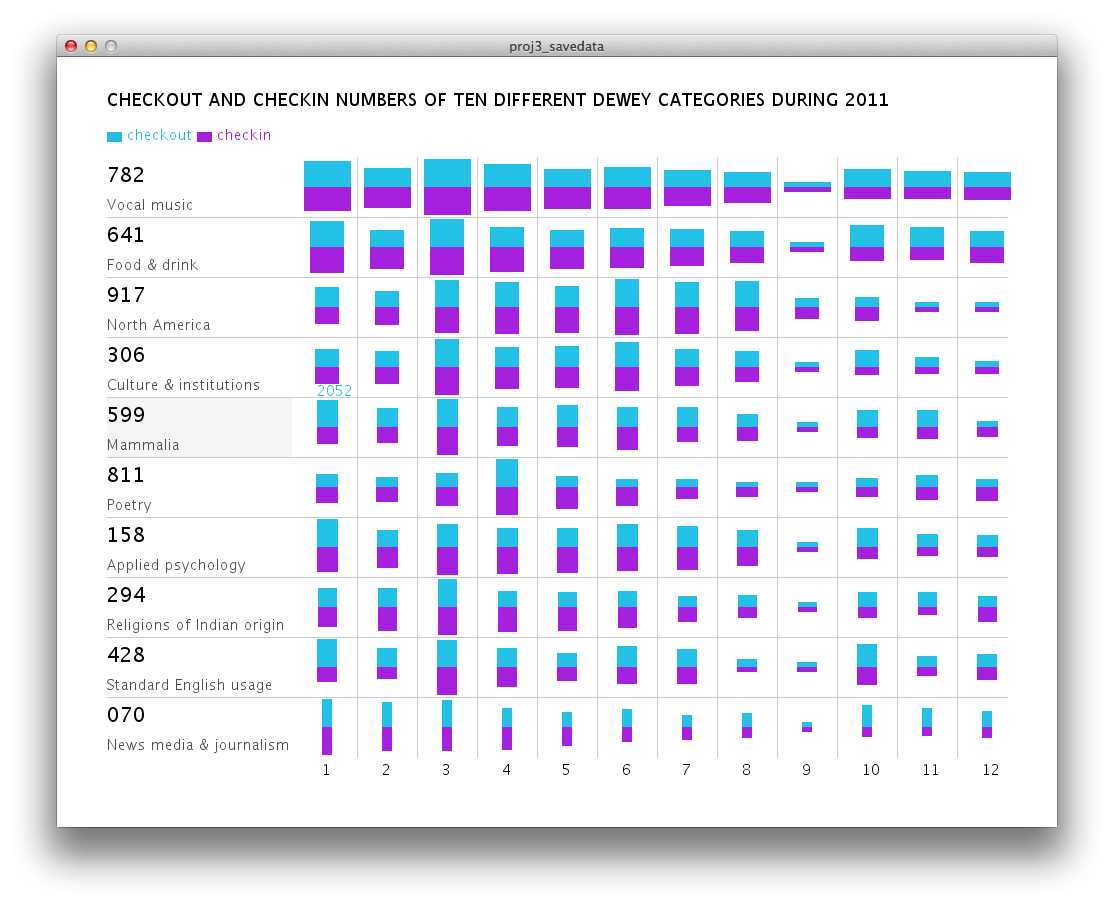
In this project, I tried query top ten dewey categories in 2011, and then compare their check-in and checkout number separately. I use blue rectangles checkout numbers, and purple ones as check-in numbers. Different height represents different amounts of check-in/checkout number in each dewey during a whole year, and different width represents different amounts of check-in/checkout number between ten dewey.
Background
and Sketches
and Sketches
Query
Part 1
select floor(dewey / 1) * 1, count(*) from dewey, activity where dewey.bib = activity.bib and year(o) < 2013 and year(o) > 2011 and floor(dewey / 10) * 10 > 0 group by floor(dewey / 1) order by count(*) desc;
part 2
select month(i), sum(case when floor(dewey / 1) * 1 = '782' then 1 else 0 end) as '782', sum(case when floor(dewey / 1) * 1 = '641' then 1 else 0 end) as '641', sum(case when floor(dewey / 1) * 1 = '917' then 1 else 0 end) as '917', sum(case when floor(dewey / 1) * 1 = '306' then 1 else 0 end) as '306', sum(case when floor(dewey / 1) * 1 = '599' then 1 else 0 end) as '599', sum(case when floor(dewey / 1) * 1 = '811' then 1 else 0 end) as '811', sum(case when floor(dewey / 1) * 1 = '158' then 1 else 0 end) as '158', sum(case when floor(dewey / 1) * 1 = '294' then 1 else 0 end) as '294', sum(case when floor(dewey / 1) * 1 = '428' then 1 else 0 end) as '428', sum(case when floor(dewey / 1) * 1 = '70' then 1 else 0 end) as '70', from activity, dewey where year(i) > 2010 and year(o) < 2012 and activity.bib = dewey.bib group by month(i);
Query Explanation
In part one, I tried to find out what is the most popular dewey number in each category like ”100”, “200”, and then picked up most popular ten dewey numbers as parameters in part two. It takes 100 seconds to query all the data in MySQL Workbench, and I also use MySQL functions in Processing to query data. After running the program, it will query data first, and then plot the main visualization.
Results and Analysis
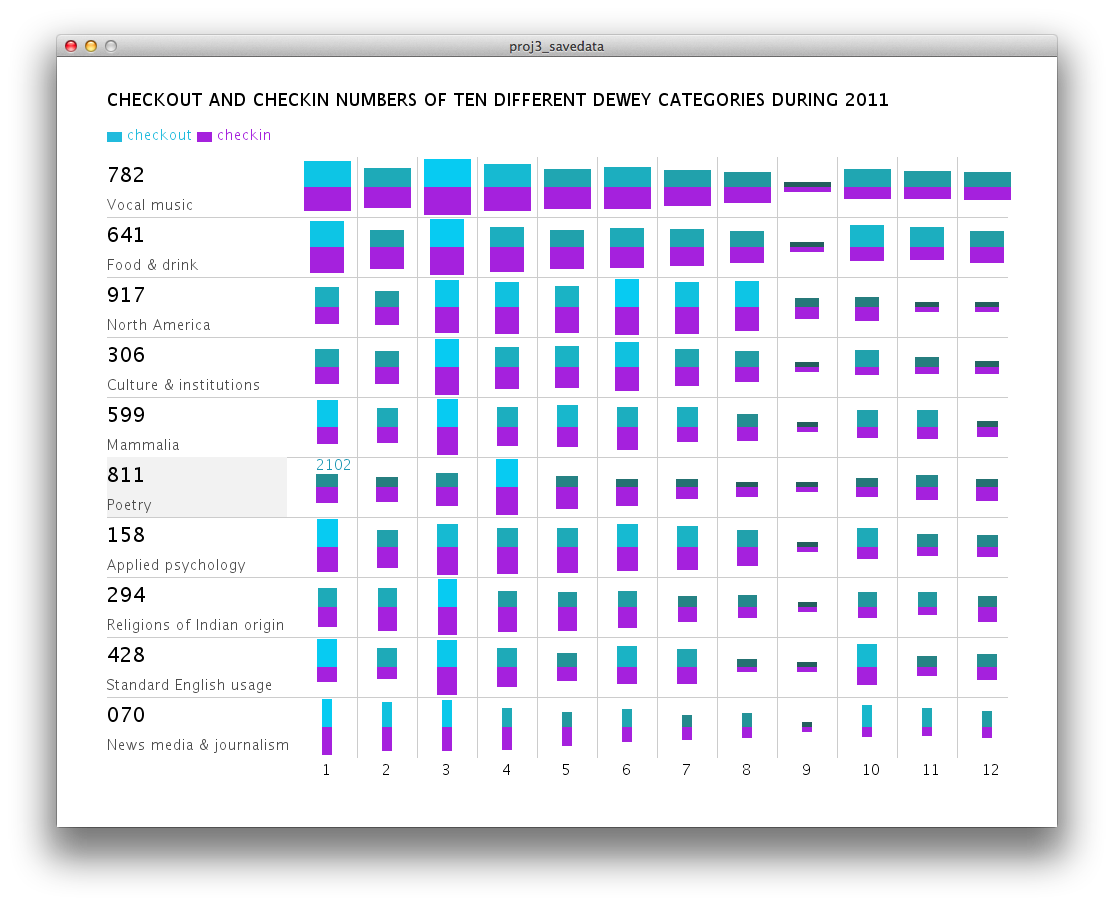
The result shows that there are the largest amounts of check-in and checkout number in March and April. In September, there are fewer amounts. When moving mouse on different months and dewey, the real amount is shown and the dewey category is highlighted.


Code