2D Spatial Map
MAT 259, 2013
Giovanni Sgambato
Introduction
I would like to visualize the trend of top 10 checked DVD in the period 2006-2011 in the Seattle Public Library.
Process
The process is splitted in 2 parts, in the first I’m querying what are the m10 ost checked DVD in the period 2006-2011, then i’m cheking per each title the amount of checks every year, to have both the total amount of checks and partial results.
Query
Query 1
SELECT title, count(*) FROM inraw WHERE year(ckoutDateTime) > '2005' and year(ckoutDateTime) < '2012' and itemtype like ‘%dvd%’ GROUP BY title ORDER BYcount(*) DESC LIMIT 10;
Query 2
SELECT title, count(*) FROM inraw WHERE year(ckoutDateTime) > '2005' and year(ckoutDateTime) < '2012' and title like ´#´ GROUP BY month ORDER BY month;
Results and Analysis
In this project I explored methods for coloring data and representing layers of meaning within a 2D space through an interesting data set.
I also spent time in the data selection, filtering and sorting, producing 2 queries to fit the data to the aim of the project.
From the data I was able to track the number of checkout for the top 10 dvd and compare them during time.
Early Version
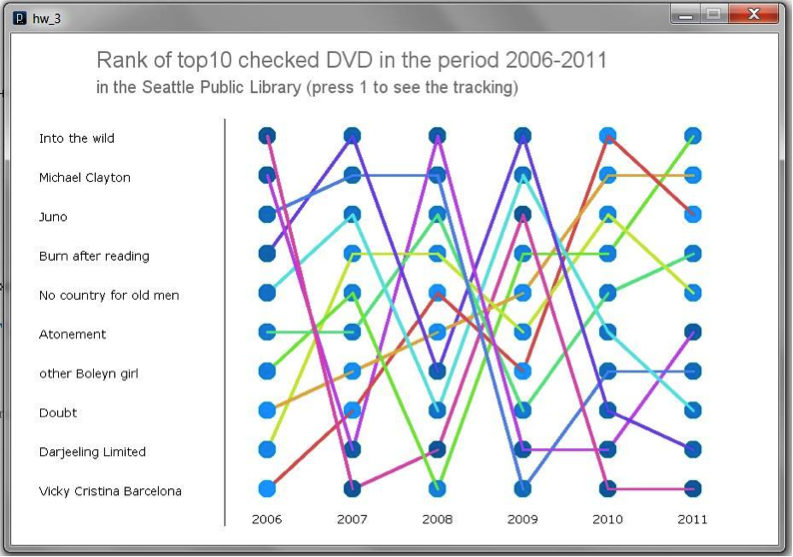
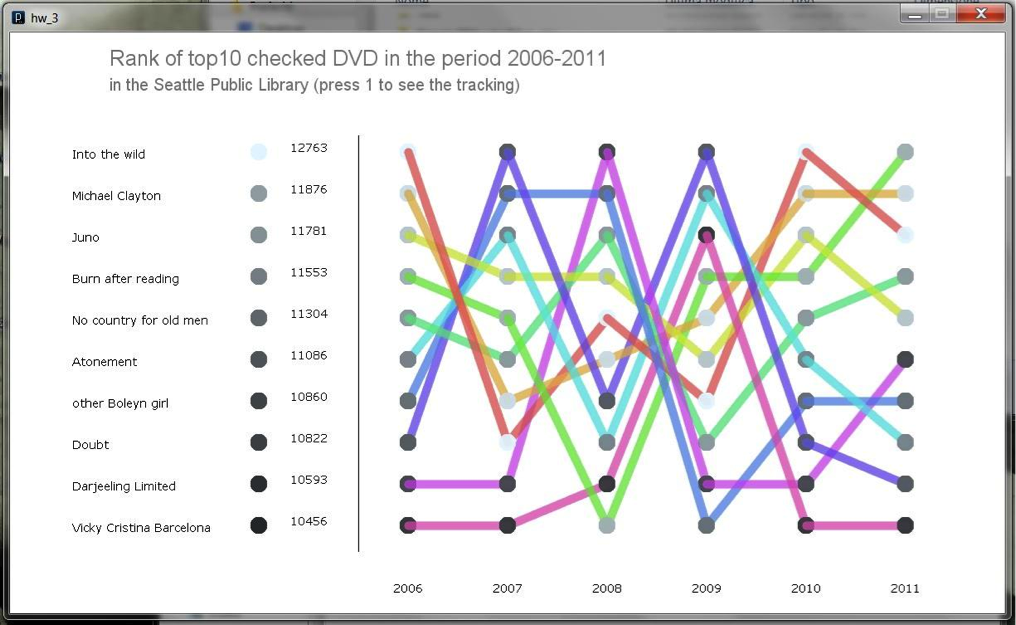
Final Version
Early Version
Final Version
Interactivity
By pressing “1” is possible to visualize or hide the track of each DVD during time.
Code