Crochet and Macrame Check-out Check-in Records Timeline Weave
MAT 259, 2023
Yanchen Lu
Concept
This project analyzes the check-out and check-in data for books related to fiber and textile crafts.
I looked into 4 keywords primarily, "Crochet", one of its sub-form "Amigurumi", "Macrame", and its sub-form "Friendship Bracelet". Then, I queried for book records with titles containing these keywords, and measured the length of time each book spent outside the Seattle Public Library. Additionally, I aggregated the number of check-outs and check-ins that occurred for each of the four categories of books on each day to produce frequency datasets.
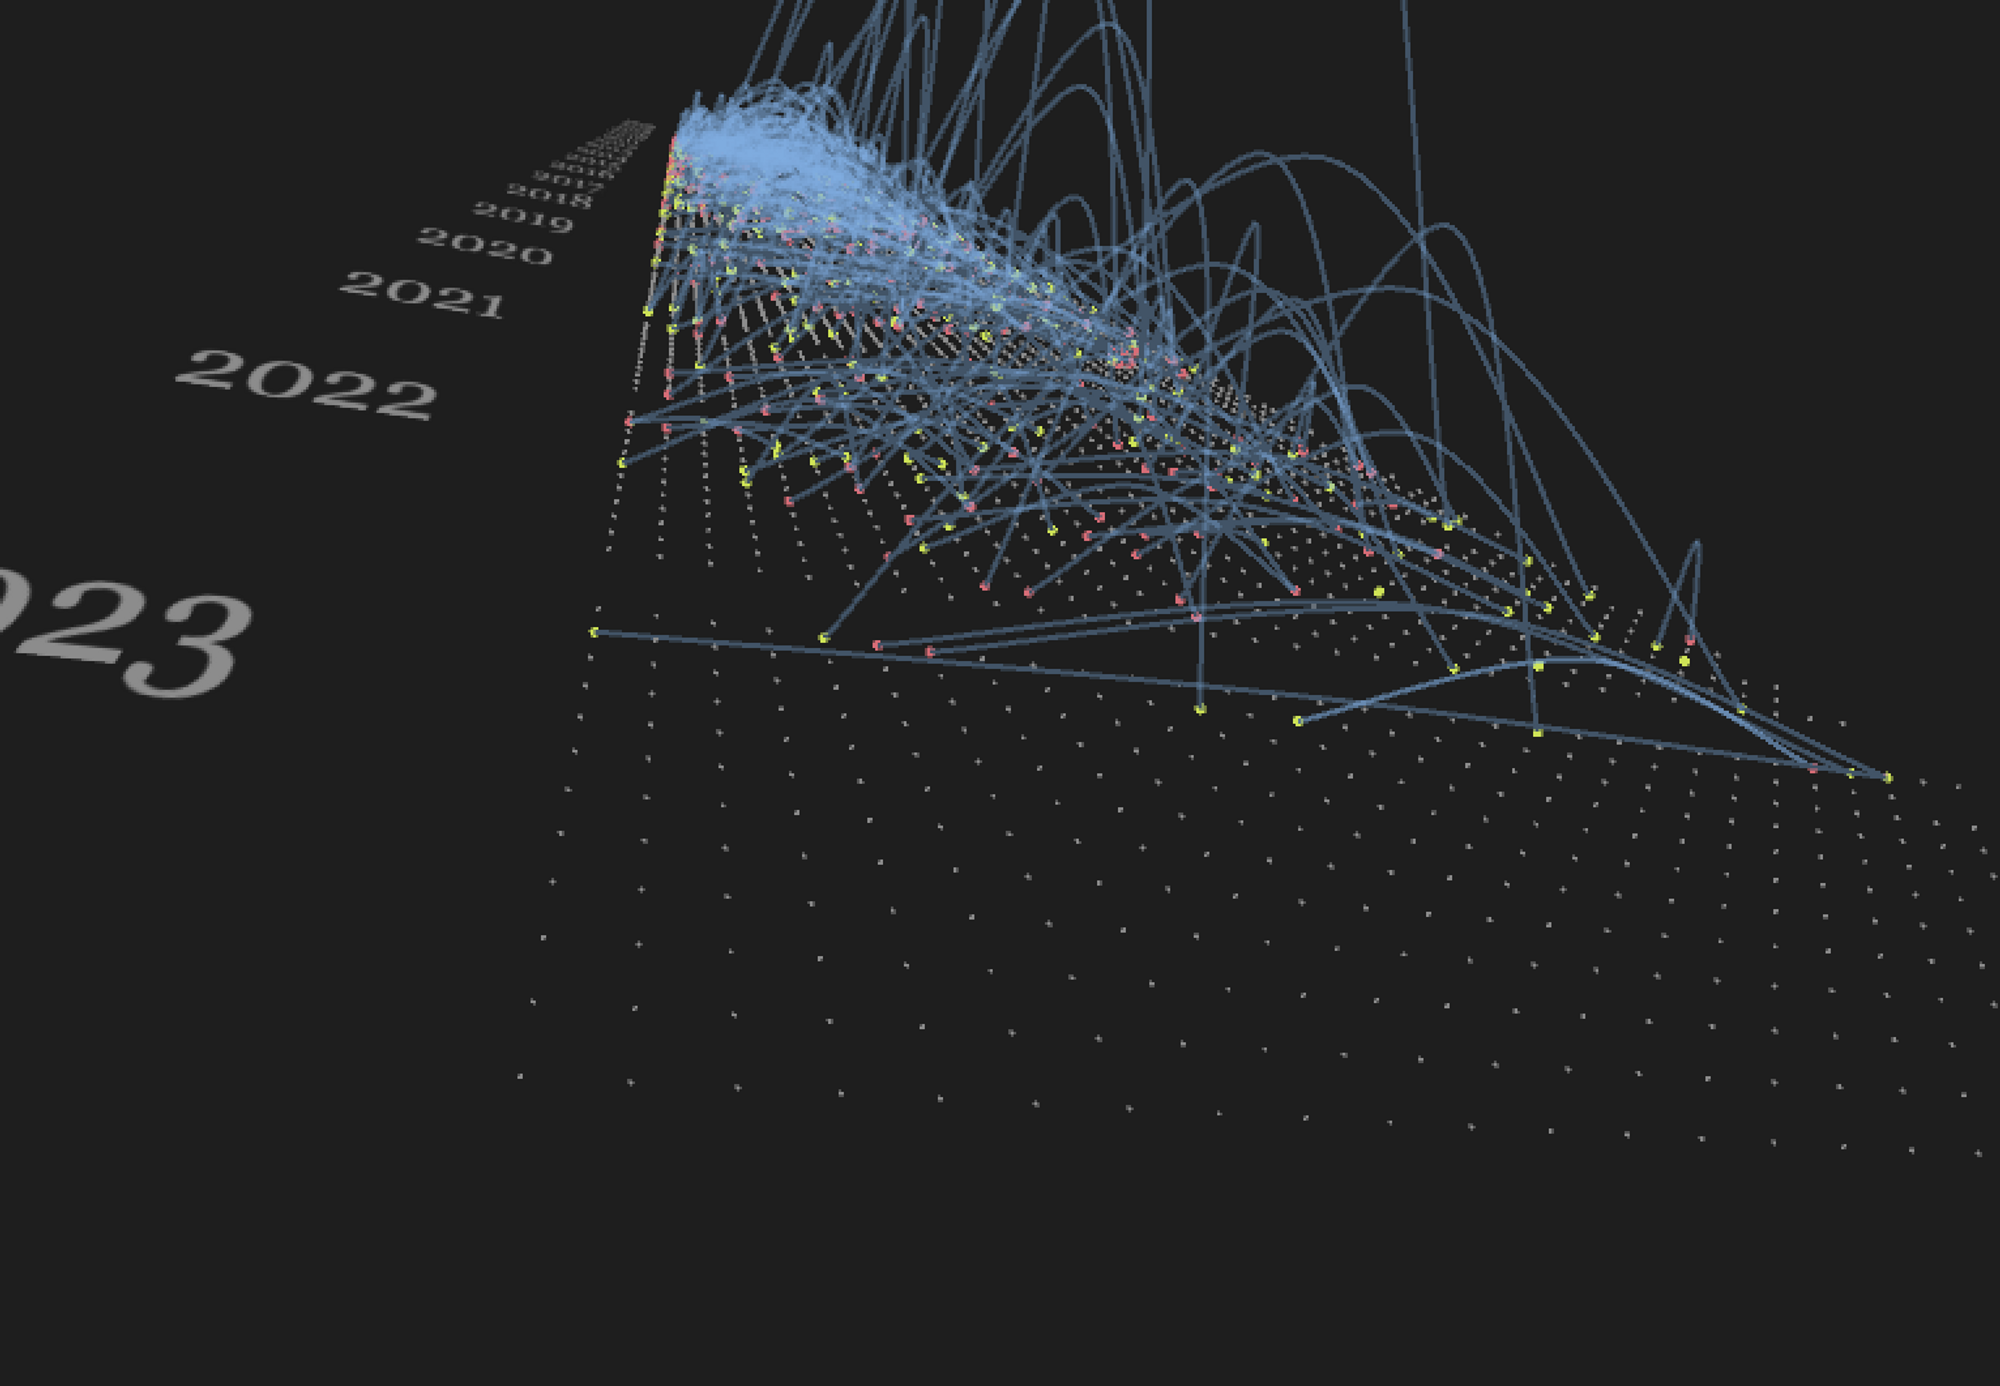
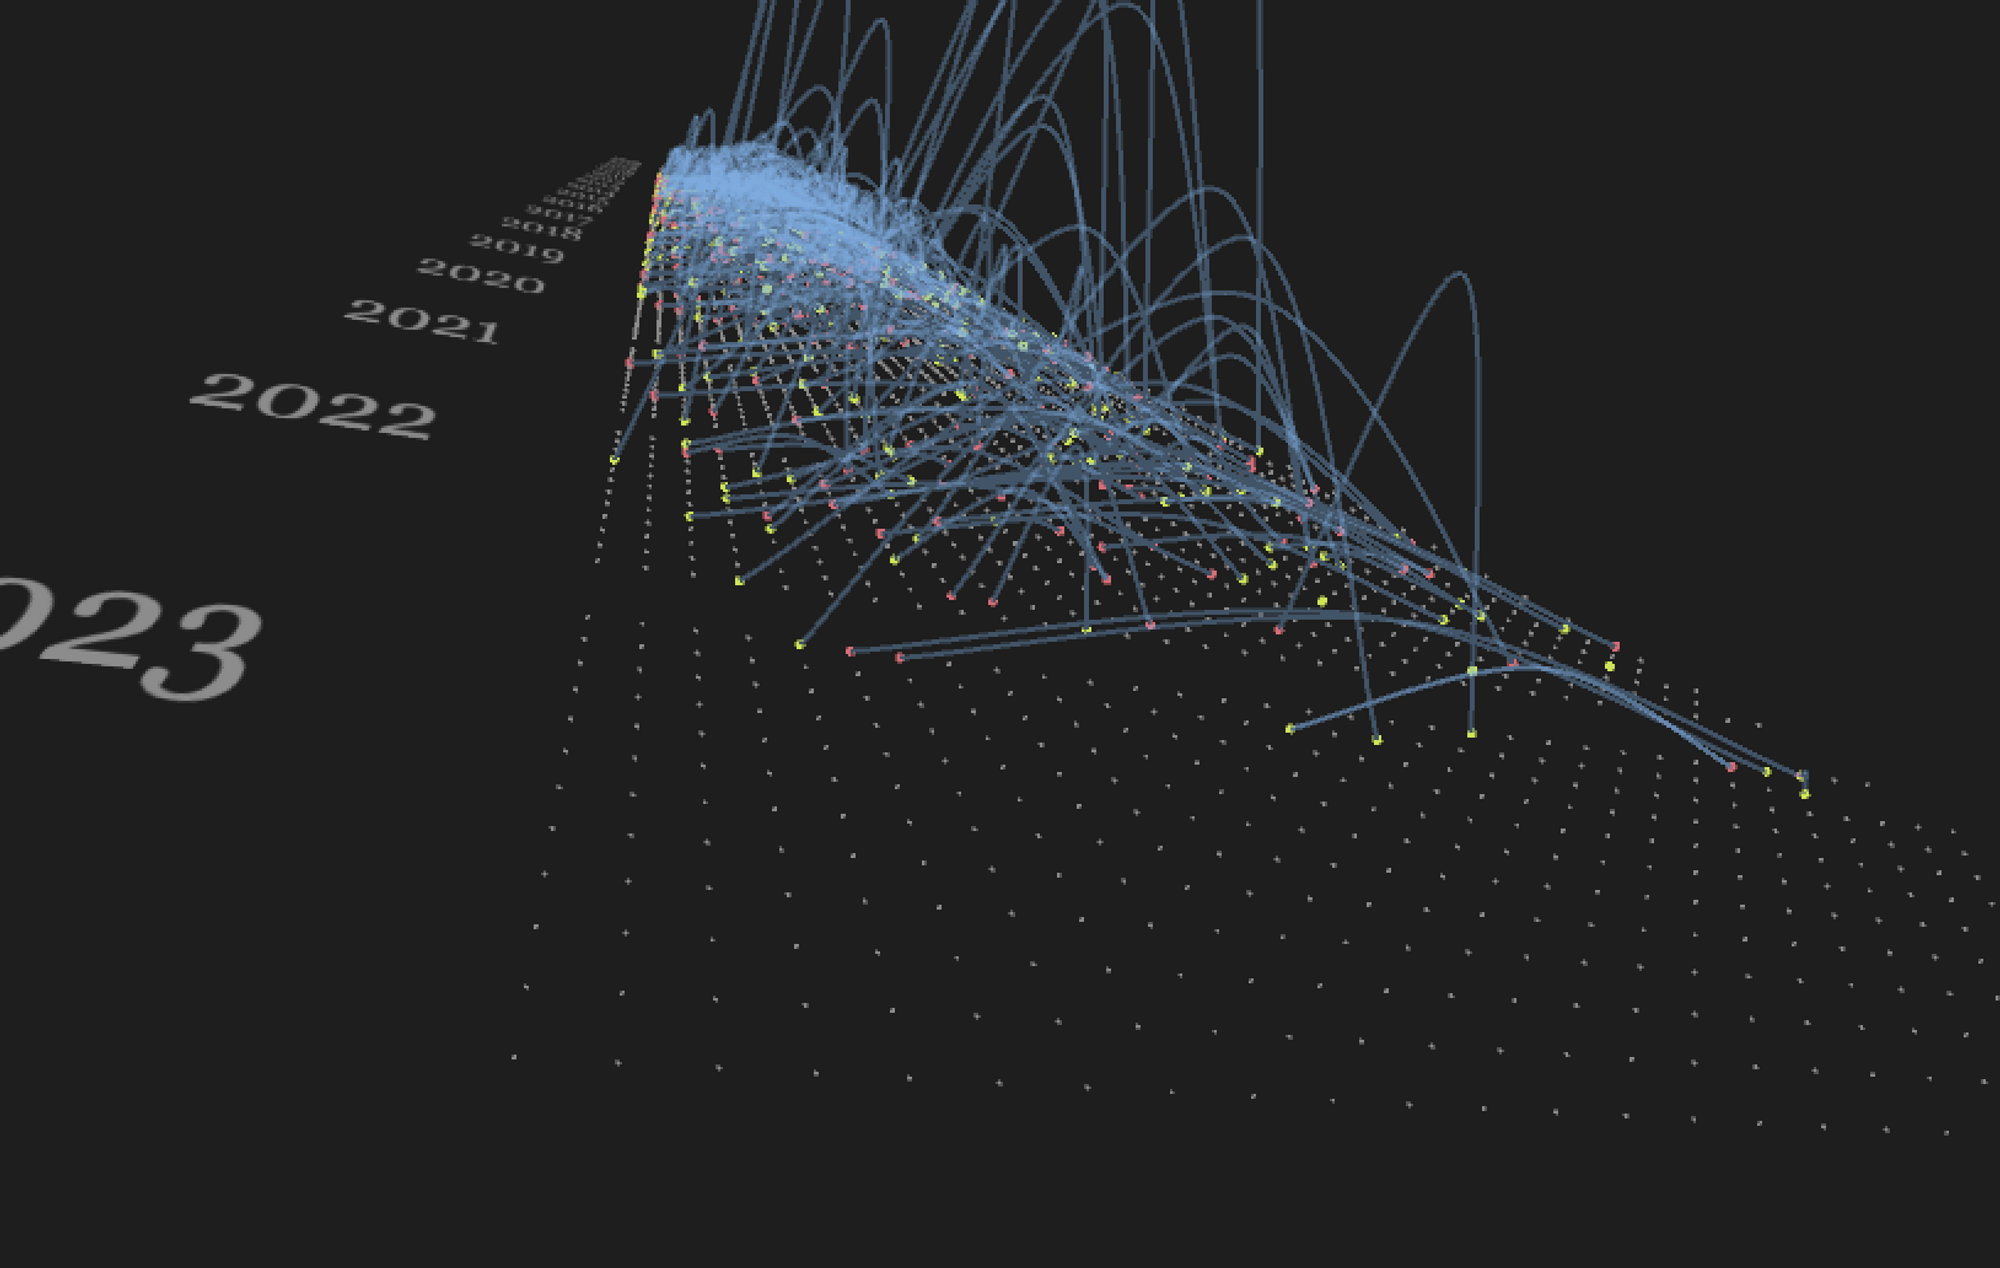
The queried data contains records from 2005 until the first two weeks of February 2023. The year-month-day timestamp data maps each record to a point in the 3D space, with days of a month organized along the x-axis, and months and years organized along the z-axis, with the height of each curve (along -y) determined by the number of days each book spent outside the SPL. For the aggregated frequency data, I visualized the number of check-outs and check-ins on each day as spheres, with the size of each sphere corresponding to check-out and check-in counts.
The GUI allows the user to navigate the 3D space and includes toggles to show or hide components of the visualization, revealing patterns in the dataset.
I looked into 4 keywords primarily, "Crochet", one of its sub-form "Amigurumi", "Macrame", and its sub-form "Friendship Bracelet". Then, I queried for book records with titles containing these keywords, and measured the length of time each book spent outside the Seattle Public Library. Additionally, I aggregated the number of check-outs and check-ins that occurred for each of the four categories of books on each day to produce frequency datasets.
The queried data contains records from 2005 until the first two weeks of February 2023. The year-month-day timestamp data maps each record to a point in the 3D space, with days of a month organized along the x-axis, and months and years organized along the z-axis, with the height of each curve (along -y) determined by the number of days each book spent outside the SPL. For the aggregated frequency data, I visualized the number of check-outs and check-ins on each day as spheres, with the size of each sphere corresponding to check-out and check-in counts.
The GUI allows the user to navigate the 3D space and includes toggles to show or hide components of the visualization, revealing patterns in the dataset.
Query
I queried for check-out and check-in records of books with keywords “Crochet”, “Amigurumi”, “Macrame”, and “Friendship Bracelet”.
I also counted the number of days between check-out and check-in dates for each record, as “time spent outside the SPL”, and added a column to denote the artform category.
I noticed that there are a lot of duplicate check-out dates that match to different check-in dates, even if it’s the same copy of a book. It might be due to readers renewing books repeatedly before finishing and returning the book to the library. Therefore, I decided to keep the last check-in date for each check-out record of each book copy.
I also counted the number of days between check-out and check-in dates for each record, as “time spent outside the SPL”, and added a column to denote the artform category.
SELECT *
FROM
	(SELECT
		itemNumber, title, cout, cin, deweyClass,
		DATEDIFF(cin, cout) AS time_outside_lib,
		(CASE
			WHEN (title LIKE '%macrame%') THEN 'macrame'
			WHEN (title LIKE '%friendship bracelet%') THEN 'friendship bracelet'
			WHEN (title LIKE '%crochet%') THEN 'crochet'
			WHEN (title LIKE '%amigurumi%') THEN 'amigurumi'
		END) AS artform
	FROM
		spl_2016.inraw
	WHERE
		title LIKE '%macrame%'
		OR title LIKE '%friendship bracelet%'
		OR title LIKE '%crochet%'
		OR title LIKE '%amigurumi%') AS textile_art
ORDER BY artform, itemNumber, cout;
I noticed that there are a lot of duplicate check-out dates that match to different check-in dates, even if it’s the same copy of a book. It might be due to readers renewing books repeatedly before finishing and returning the book to the library. Therefore, I decided to keep the last check-in date for each check-out record of each book copy.
Preliminary sketches
I started out with the idea of a calendar page representing each month's records.
The design evolved to a cylinder consisted of 12 planes, then to a flat disc that represents each year.
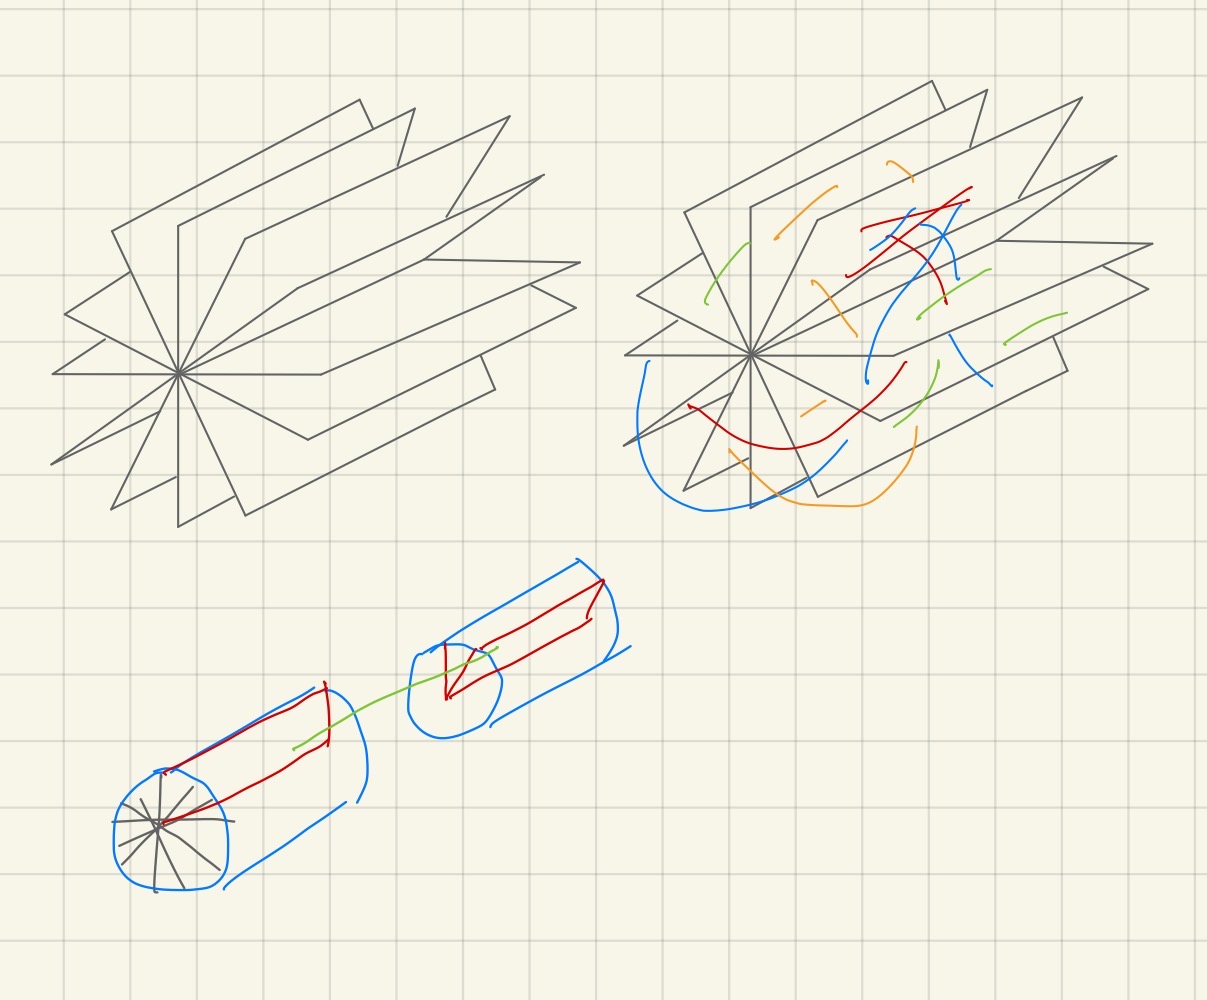
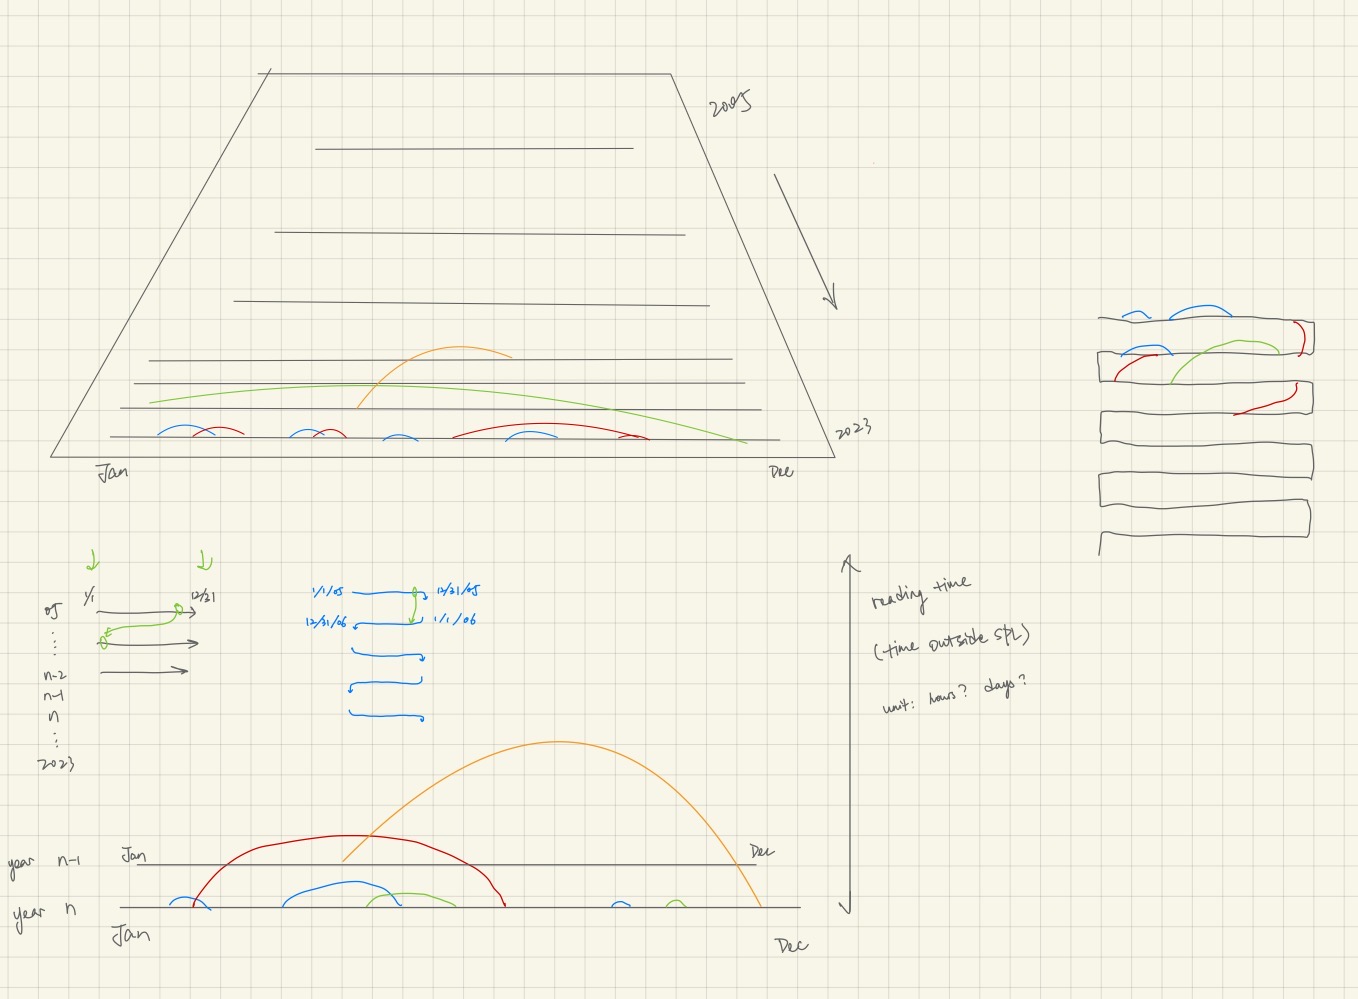
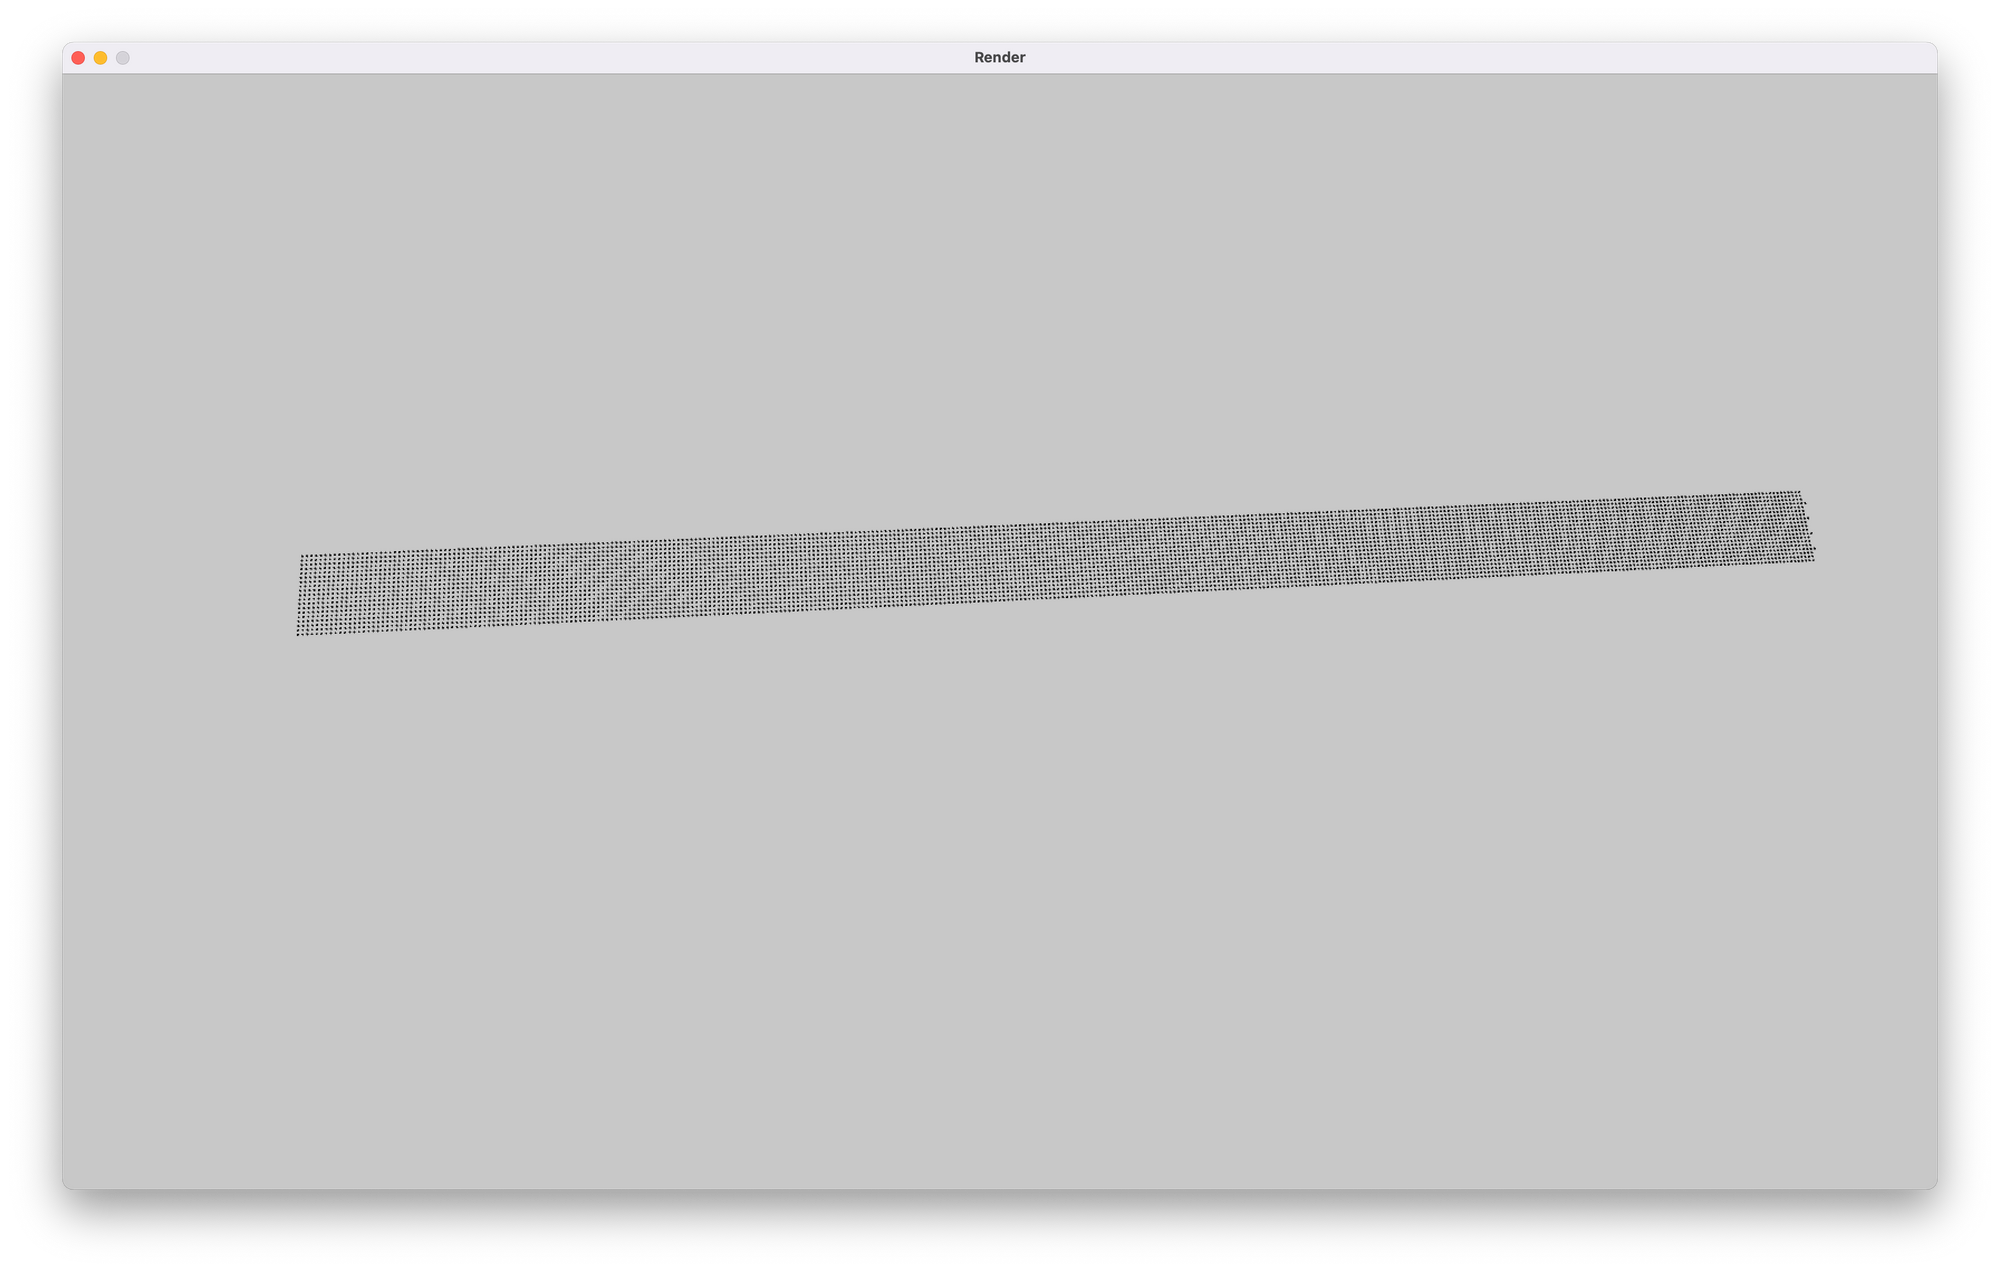
I sketched out the geometry in processing. It formed a spindle like structure. However, I didn’t really like the shape.
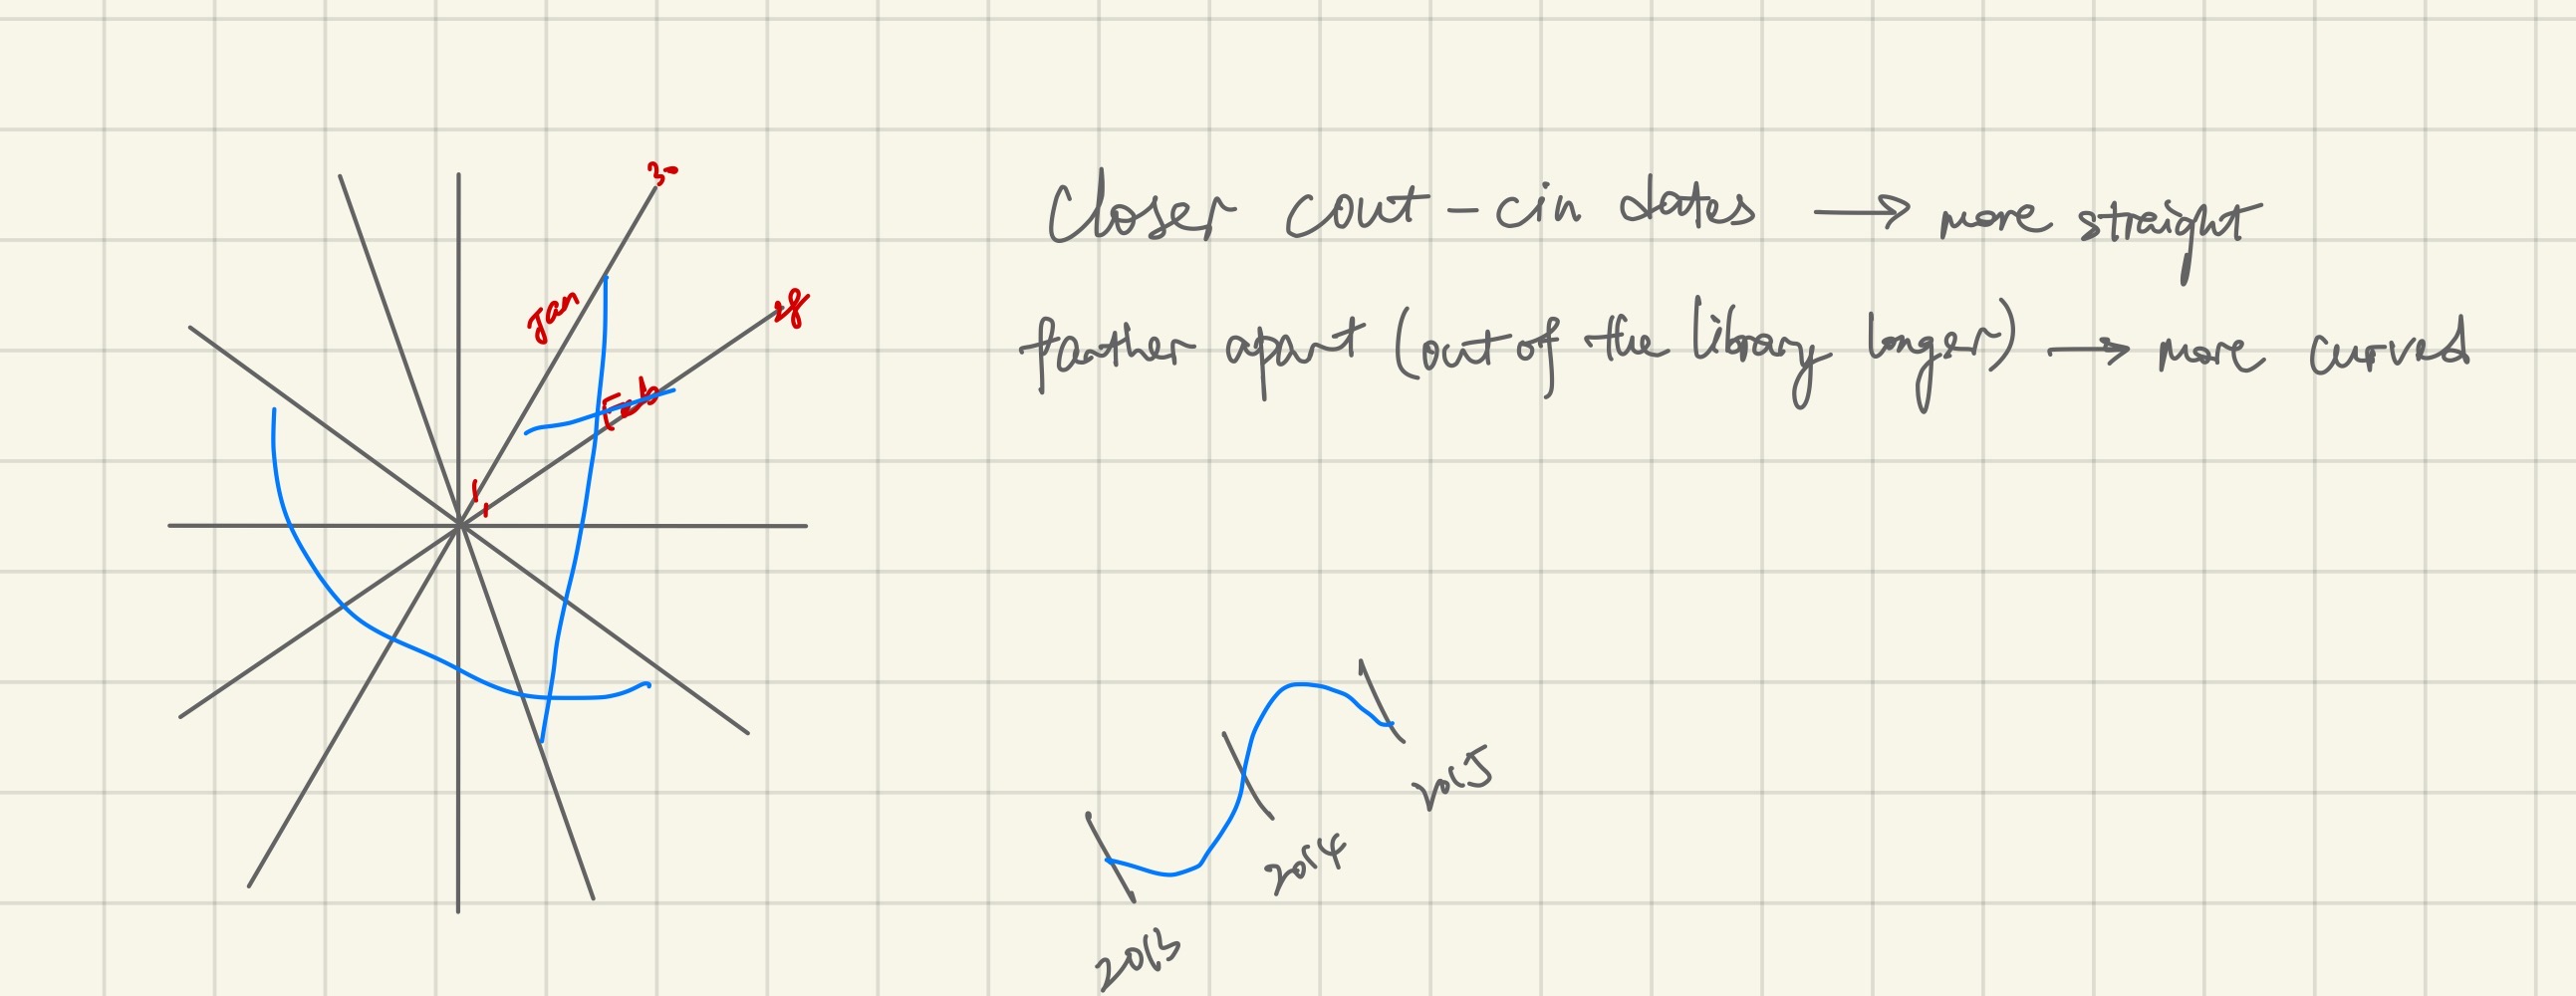
So, I decided to go back to my initial calendar idea. With each line presenting a year and the progression through the decades, it forms a 2D plane that maps each day from 2005/1/1 to 2023/2/14. The duration of a check-out → check-in record would determine the height of its curve.
Since each horizontal line represents dates increasing to the right, though the right most dates may actually be closer in time with the left most dates on the neighboring line, the length the of the curve connecting those dates would be disproportionately long. Therefore, I thought using a “snake grid”, altering the direction or order of the dates on horizontal lines might facilitate a more accurate visual representation.
Each year as a line, from 2005 to 2023
The geometry I ended up going with, each year as a rectangle
The design evolved to a cylinder consisted of 12 planes, then to a flat disc that represents each year.
I sketched out the geometry in processing. It formed a spindle like structure. However, I didn’t really like the shape.
So, I decided to go back to my initial calendar idea. With each line presenting a year and the progression through the decades, it forms a 2D plane that maps each day from 2005/1/1 to 2023/2/14. The duration of a check-out → check-in record would determine the height of its curve.
Since each horizontal line represents dates increasing to the right, though the right most dates may actually be closer in time with the left most dates on the neighboring line, the length the of the curve connecting those dates would be disproportionately long. Therefore, I thought using a “snake grid”, altering the direction or order of the dates on horizontal lines might facilitate a more accurate visual representation.
Each year as a line, from 2005 to 2023
The geometry I ended up going with, each year as a rectangle
Process
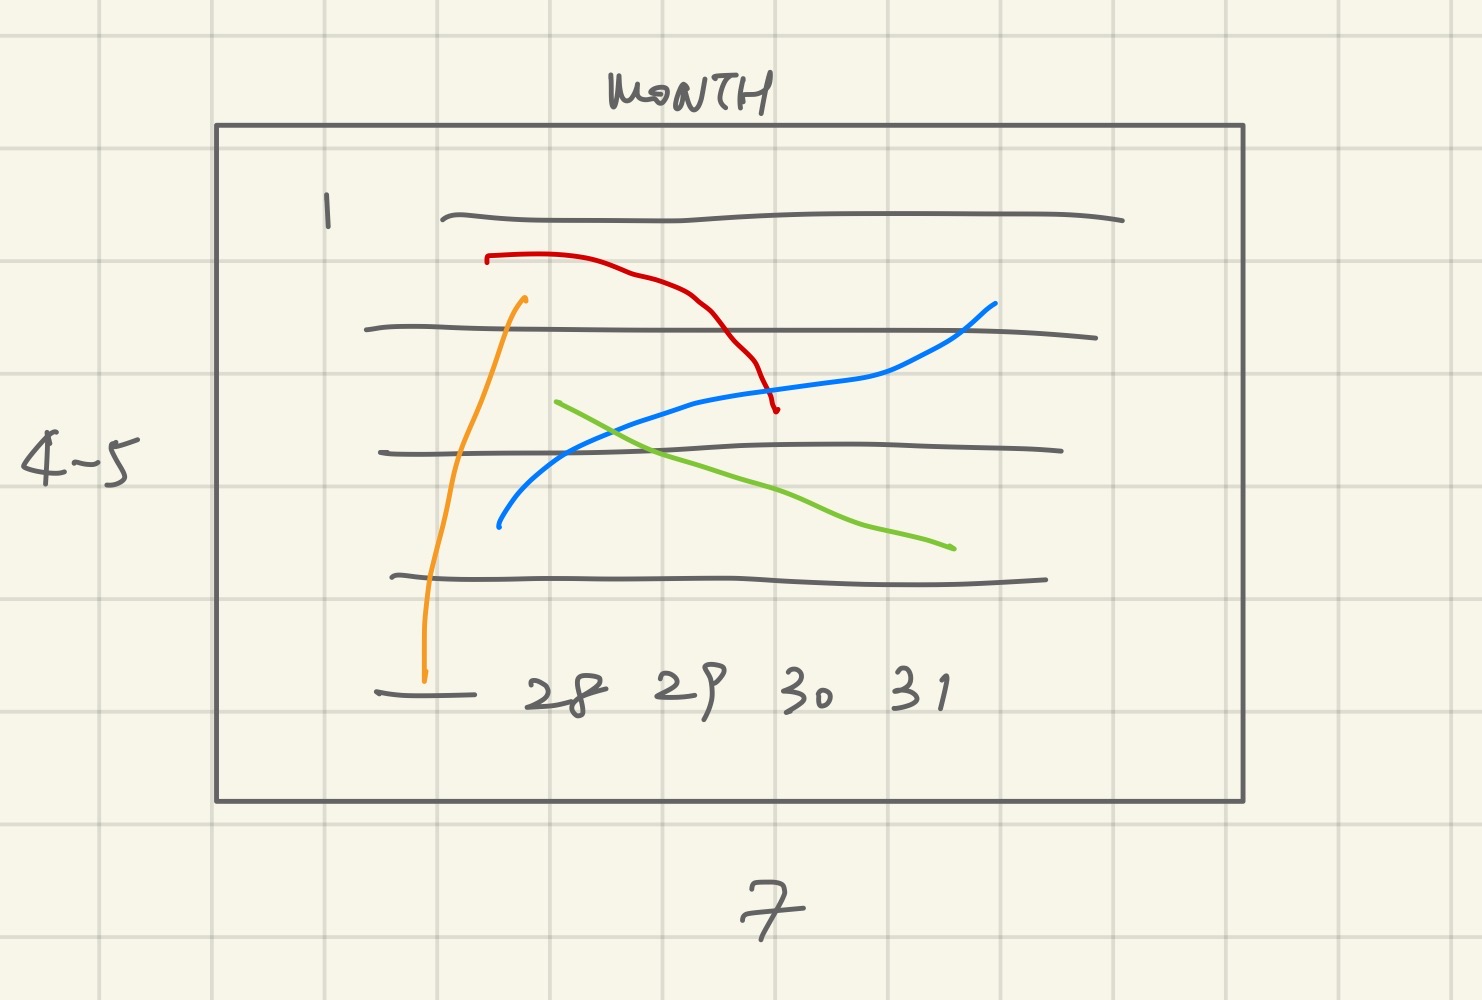
The dates are mapped as the following:
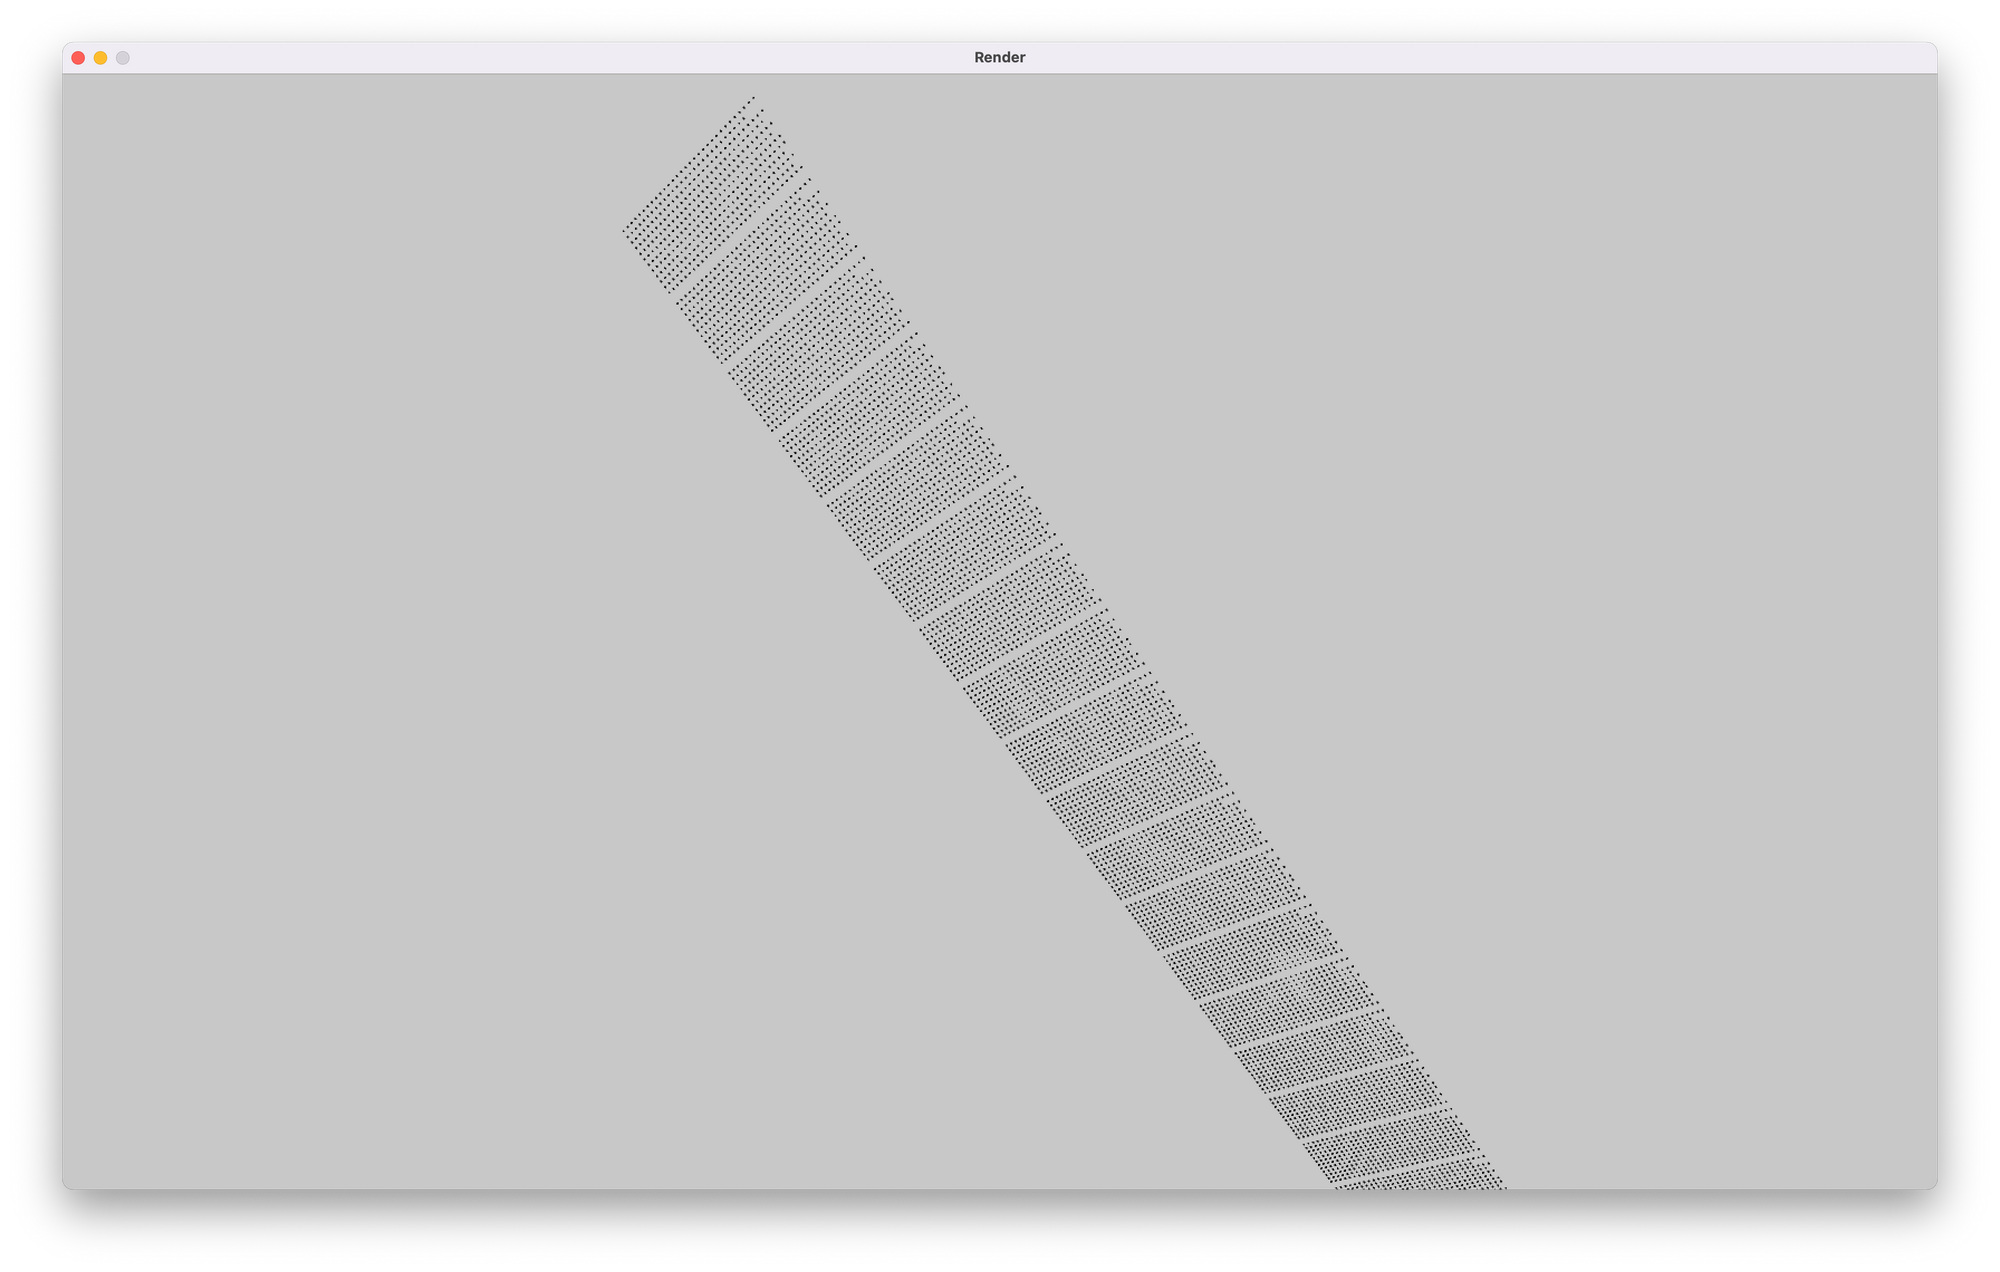
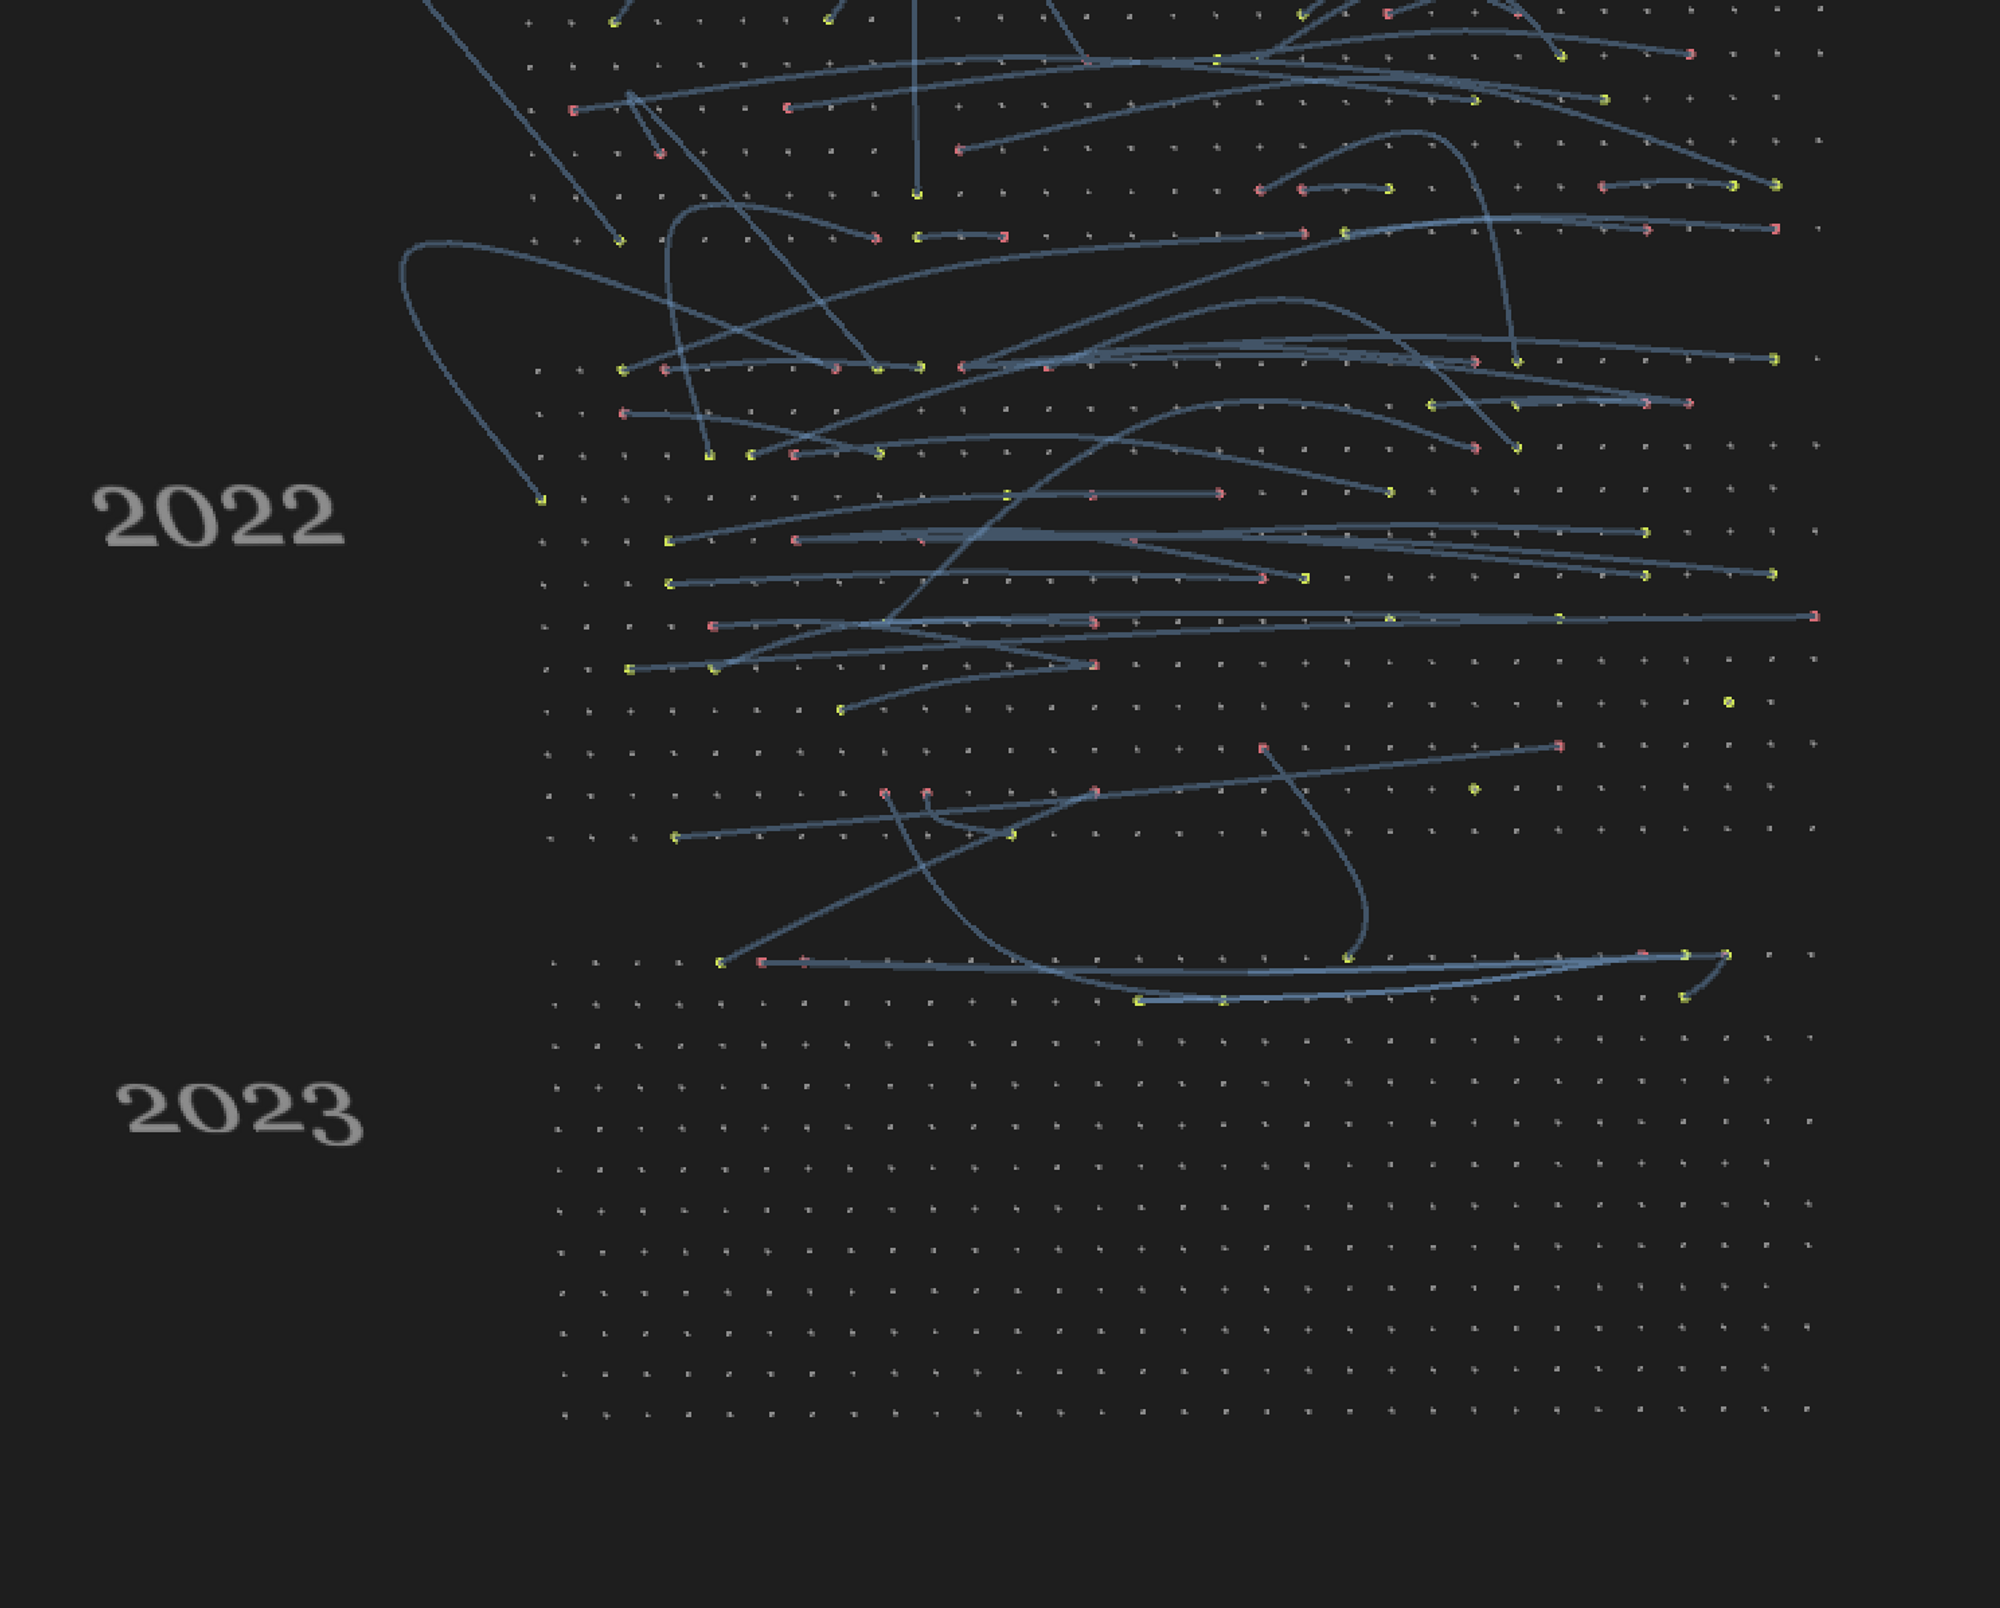
Each point drawn in the space represents a day. Each horizontal line along the positive x-axis represents an entire month. It shows the different number of days in each month and leap years.
The months, aka horizontal lines, are organized along the positive z-axis. The larger the z-value, the closer the line is to initial camera view position, closer in time (to current day).
Thus, each year is represented by a rectangle, also placed along the positive z-axis.
Check-outs are drawn as red points, and check-ins are drawn as yellow points. A curve is drawn from the check-out day to the check-in day. The taller the curve is, the longer the copy of the book is outside the SPL.
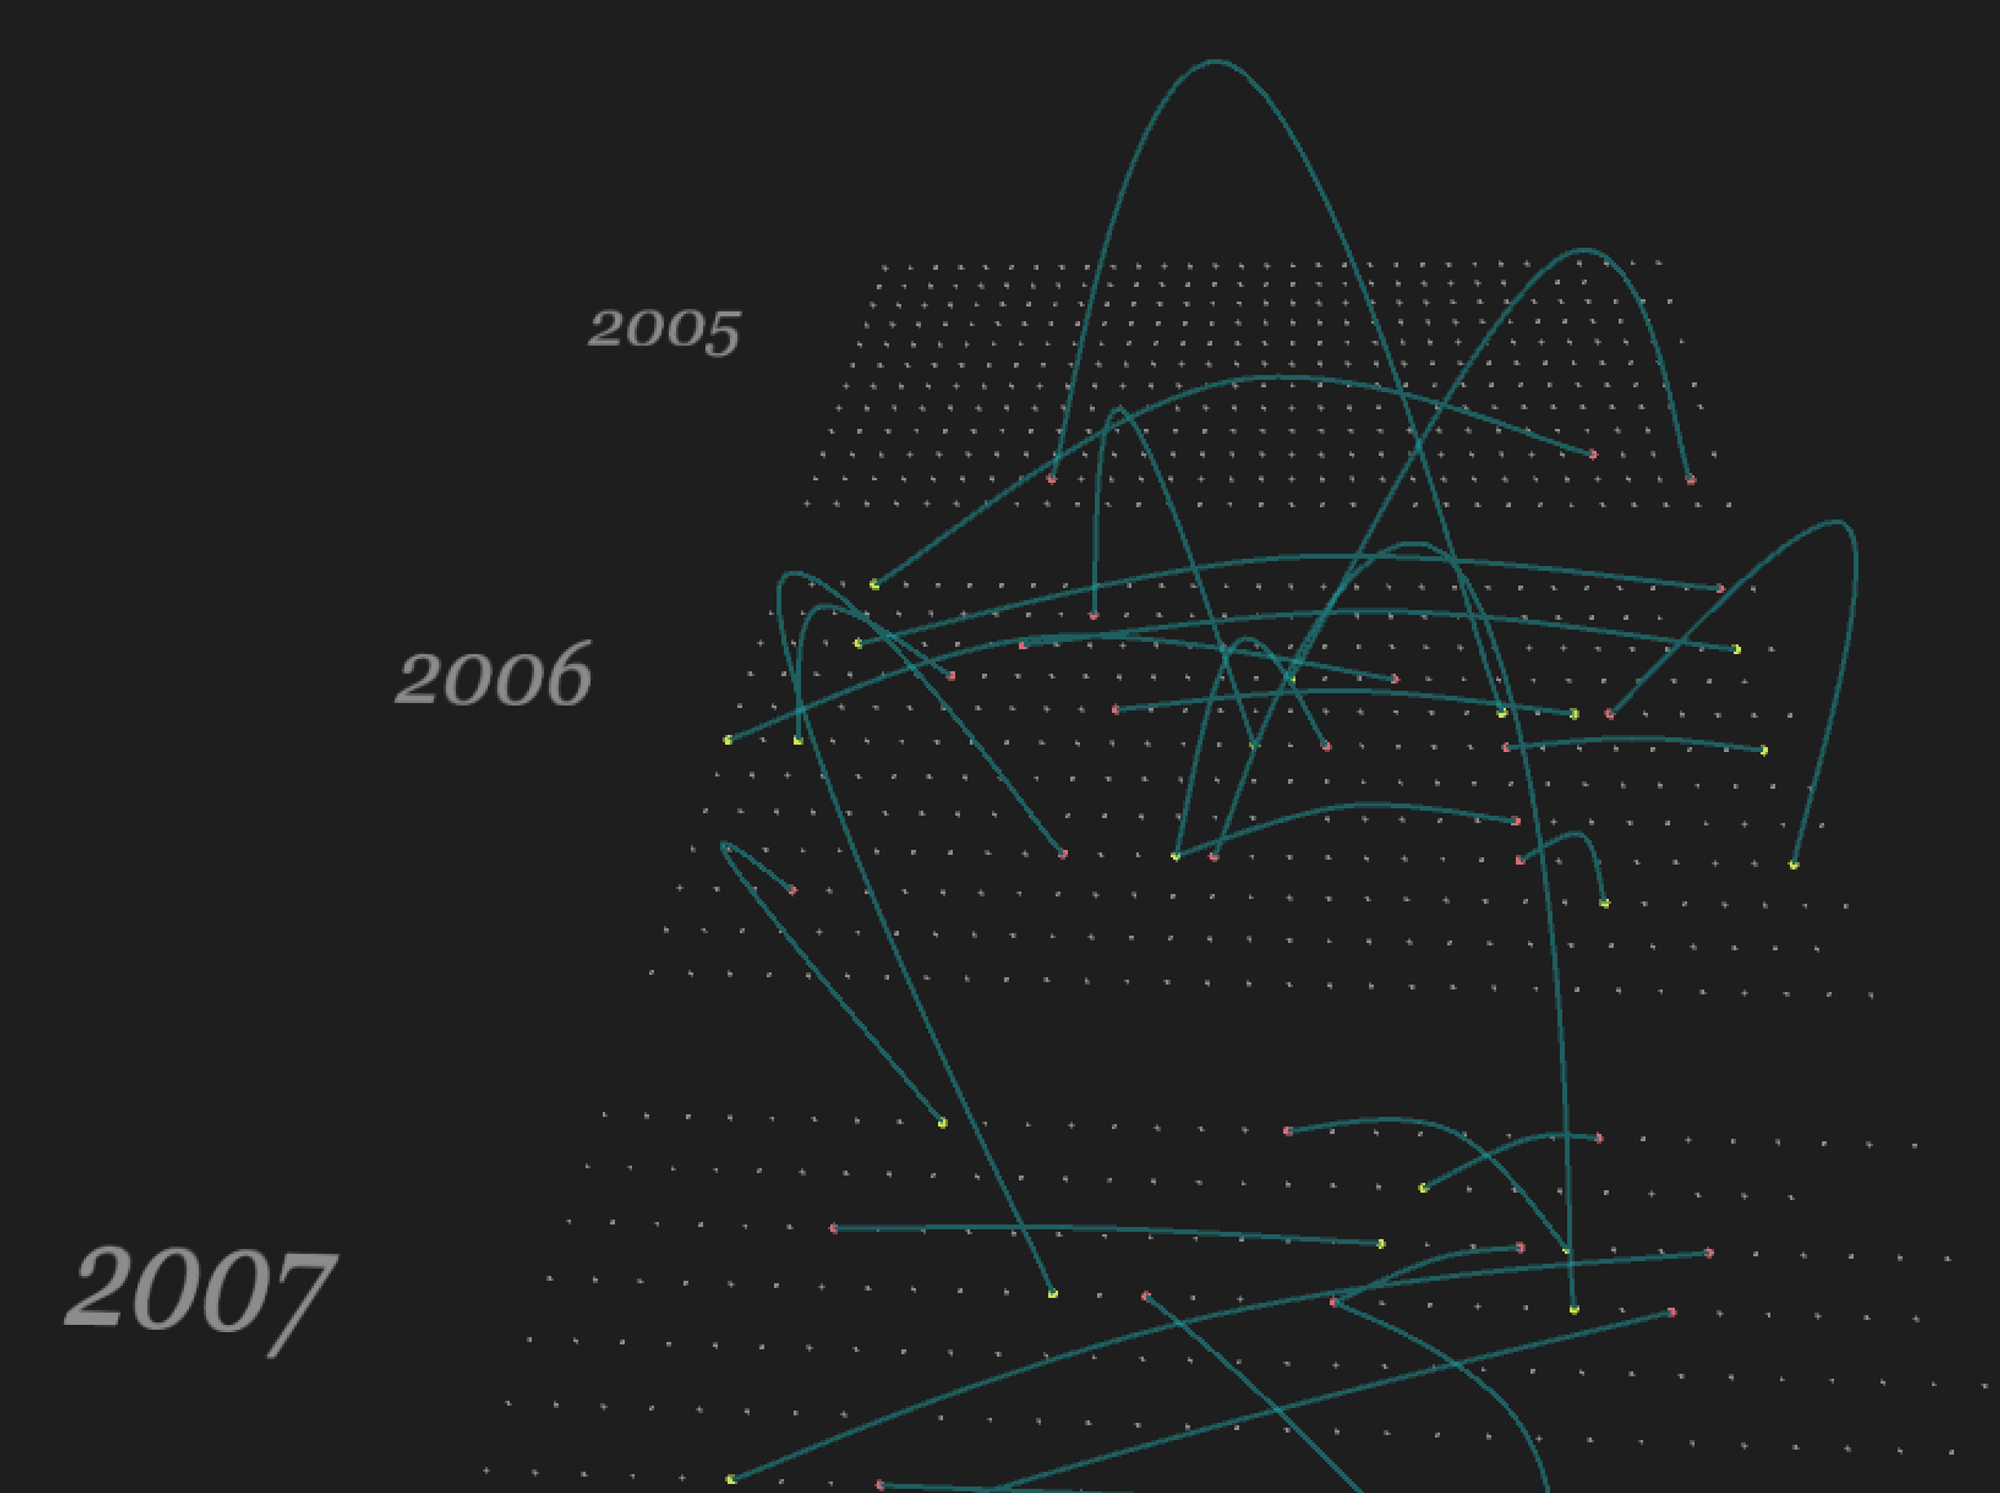
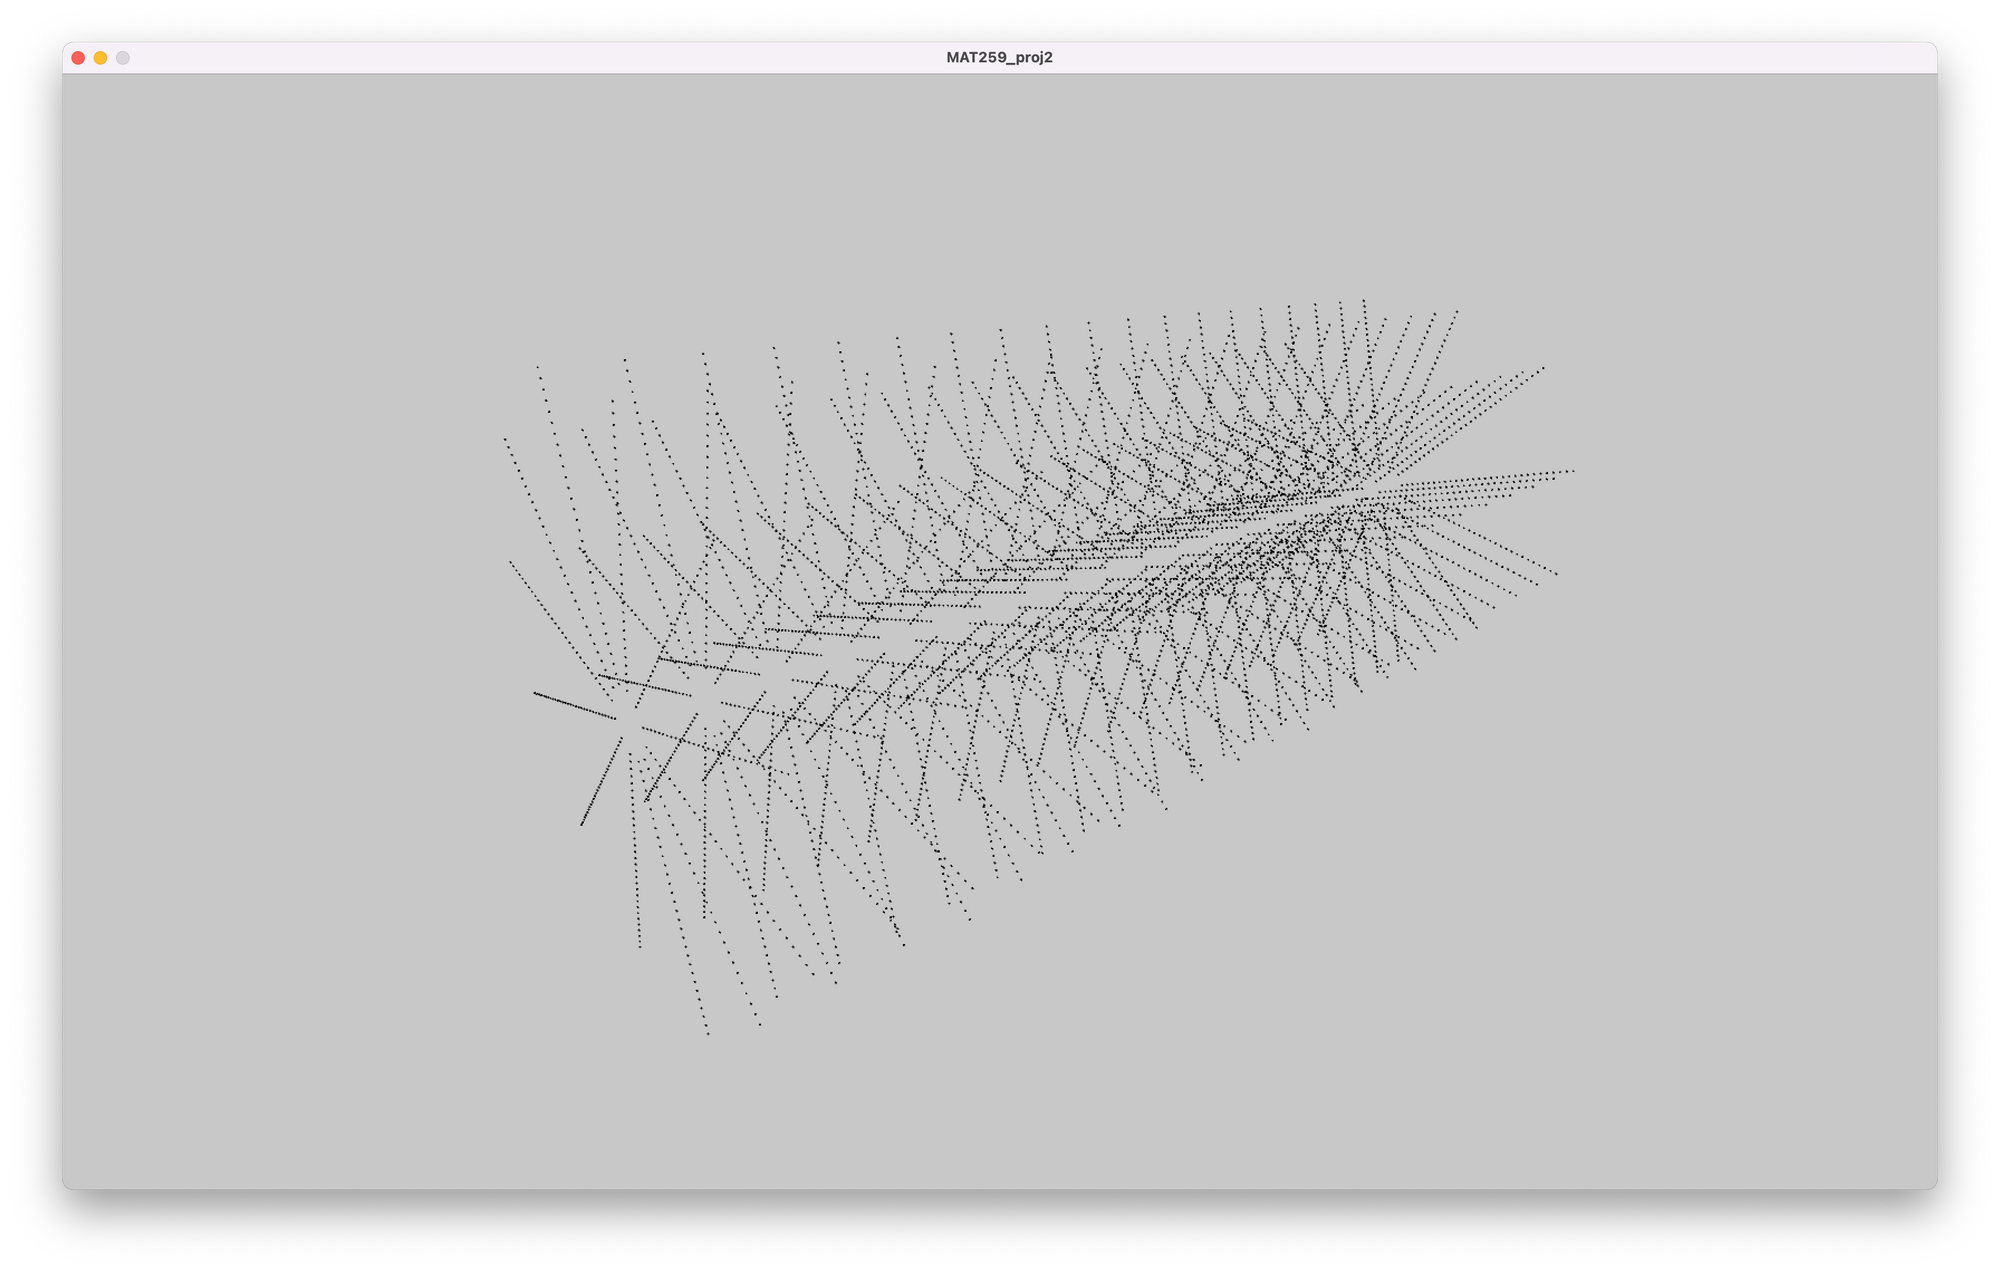
Final result
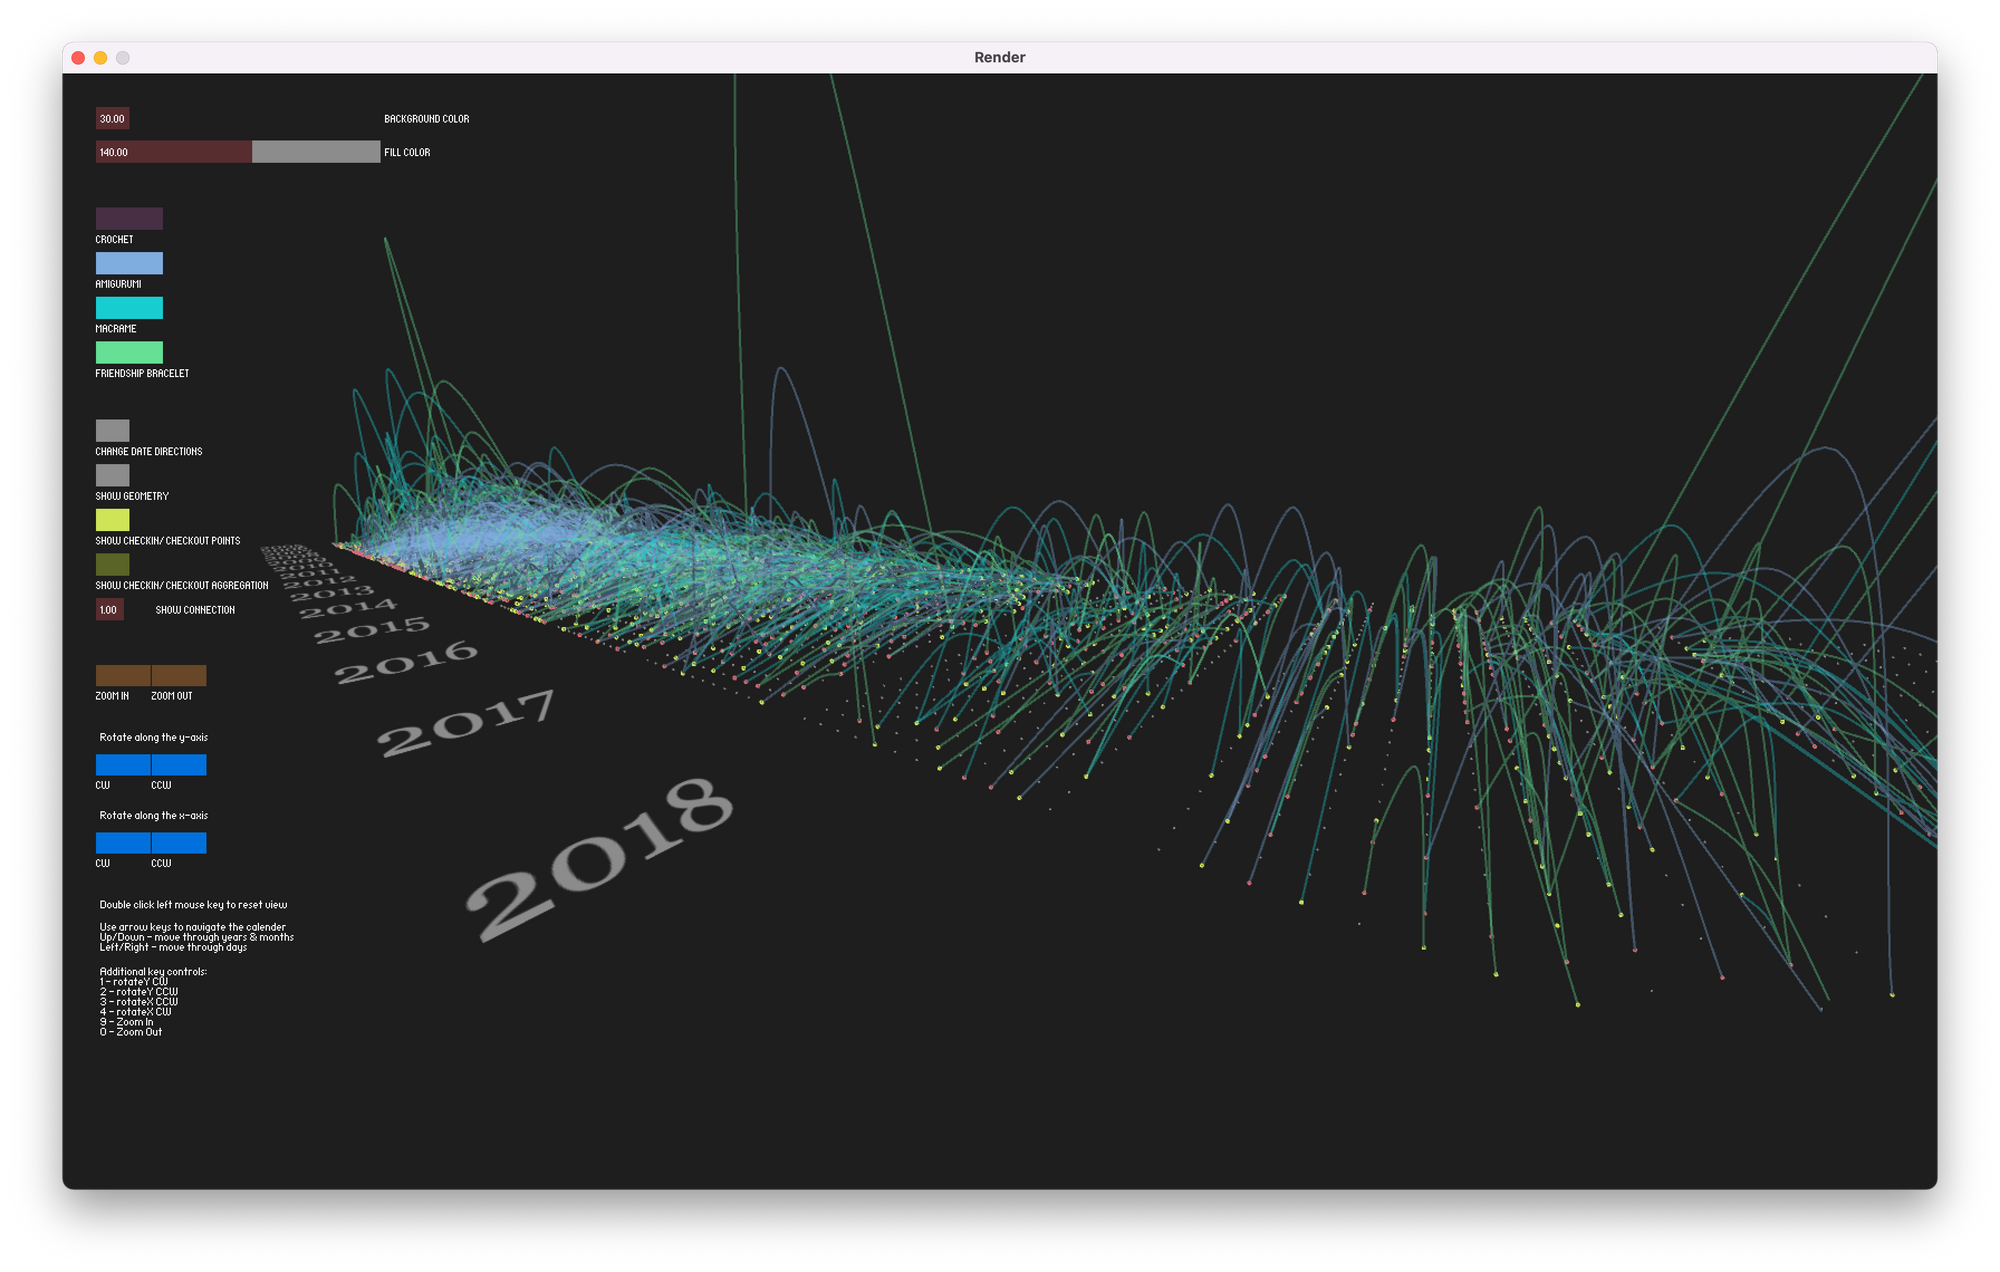
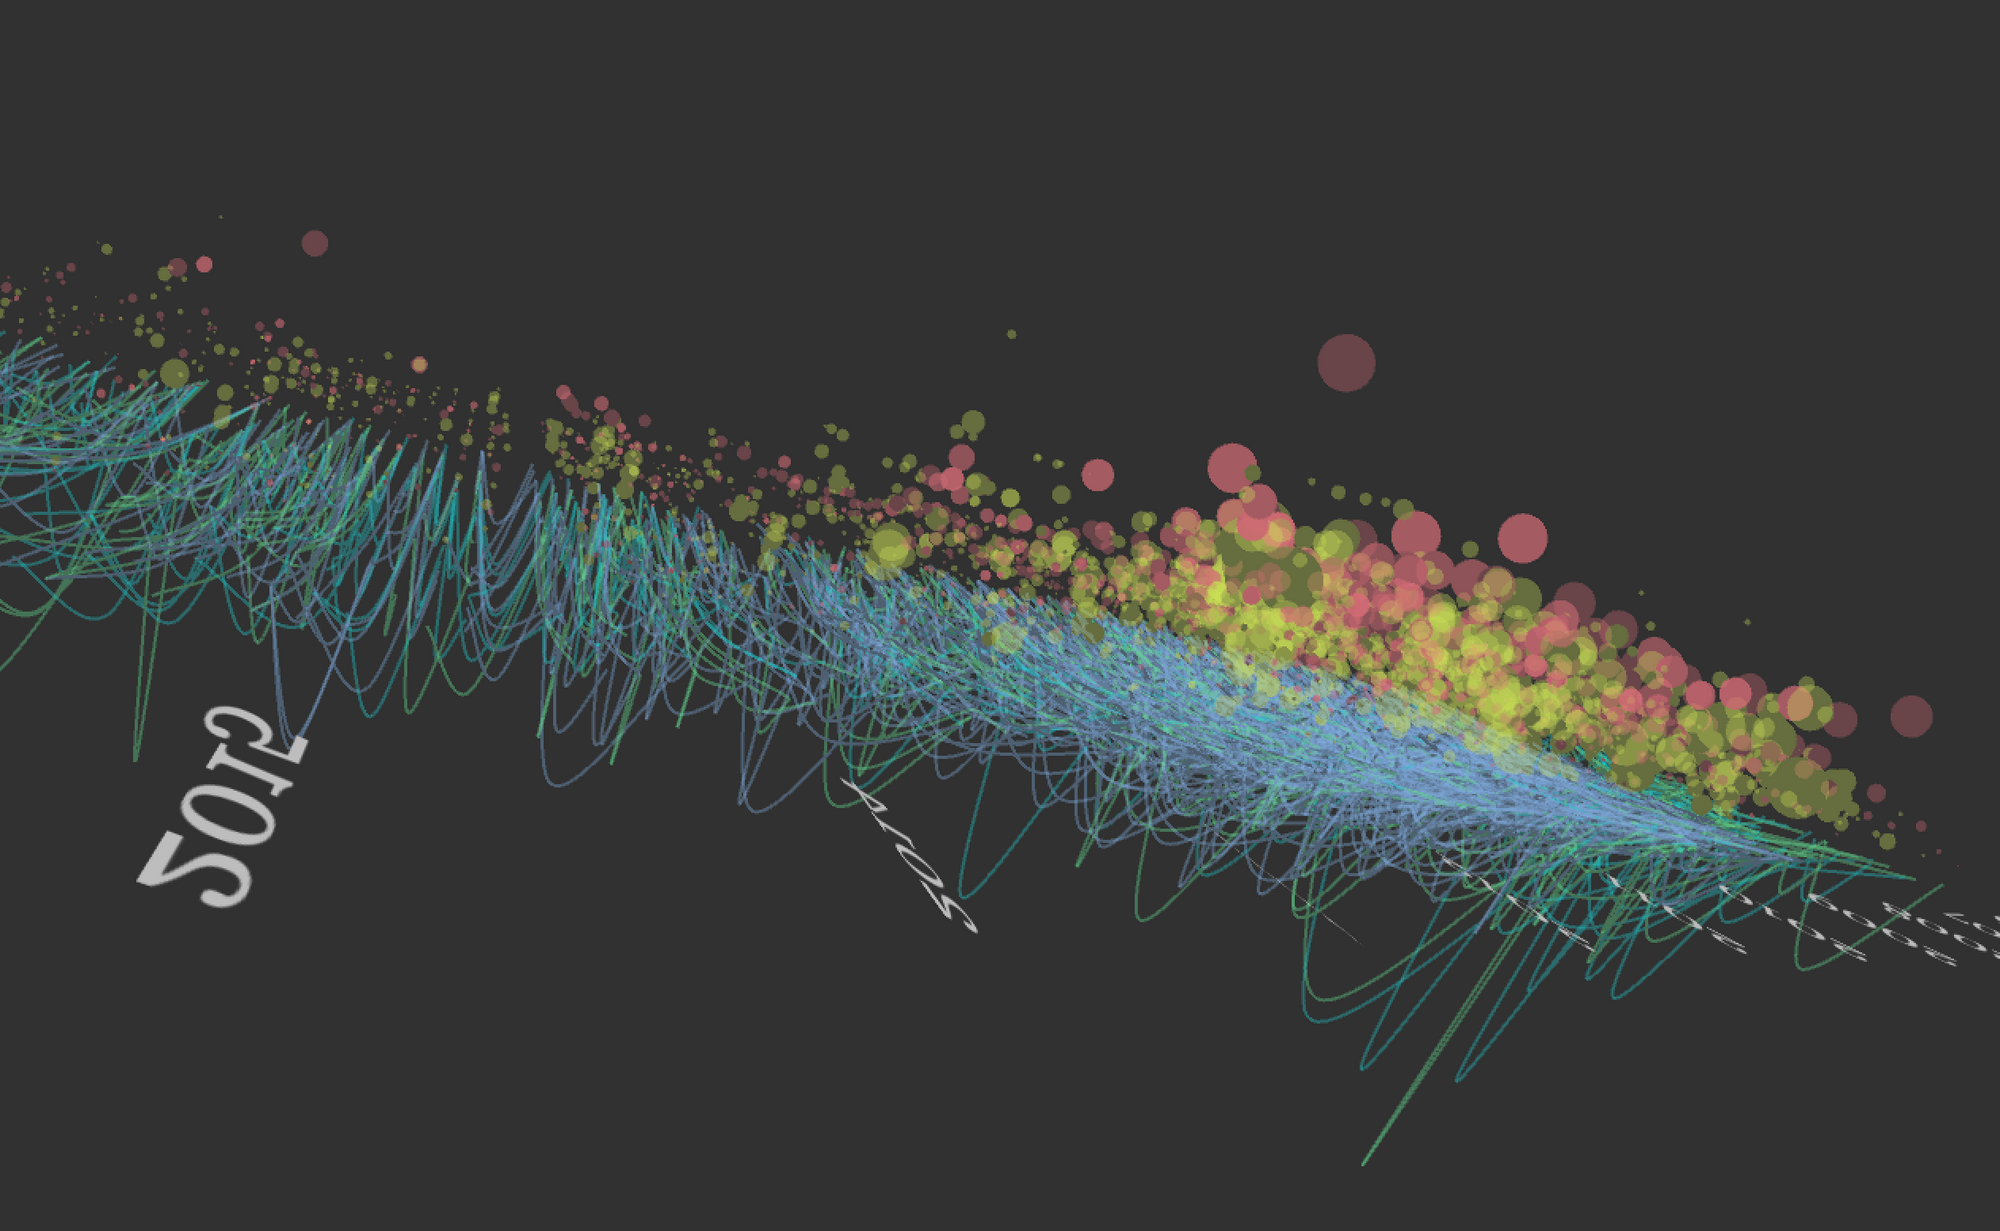
The aggregated counts of check-outs and check-ins records of each day are represented by spheres, with the diameters of the spheres increasing with the number of records. To prevent overlaps, the spheres’ y-positions also scale with the number of records.
On a single day, more check-outs and check-ins records means a larger sphere connected to that date in the 3D space, and the sphere is placed lower along the y-axis (larger y-value).
I thought it’d be interesting to show not only the density of check-outs and check-ins, but also the scale of the number of check-out and check-in records.

I added a toggle to alternate the date-direction to coordinate mapping. As mentioned in the sketches, the alternating “snake grid” may show a more accurate visual representation, by placing closer dates in time closer in space.
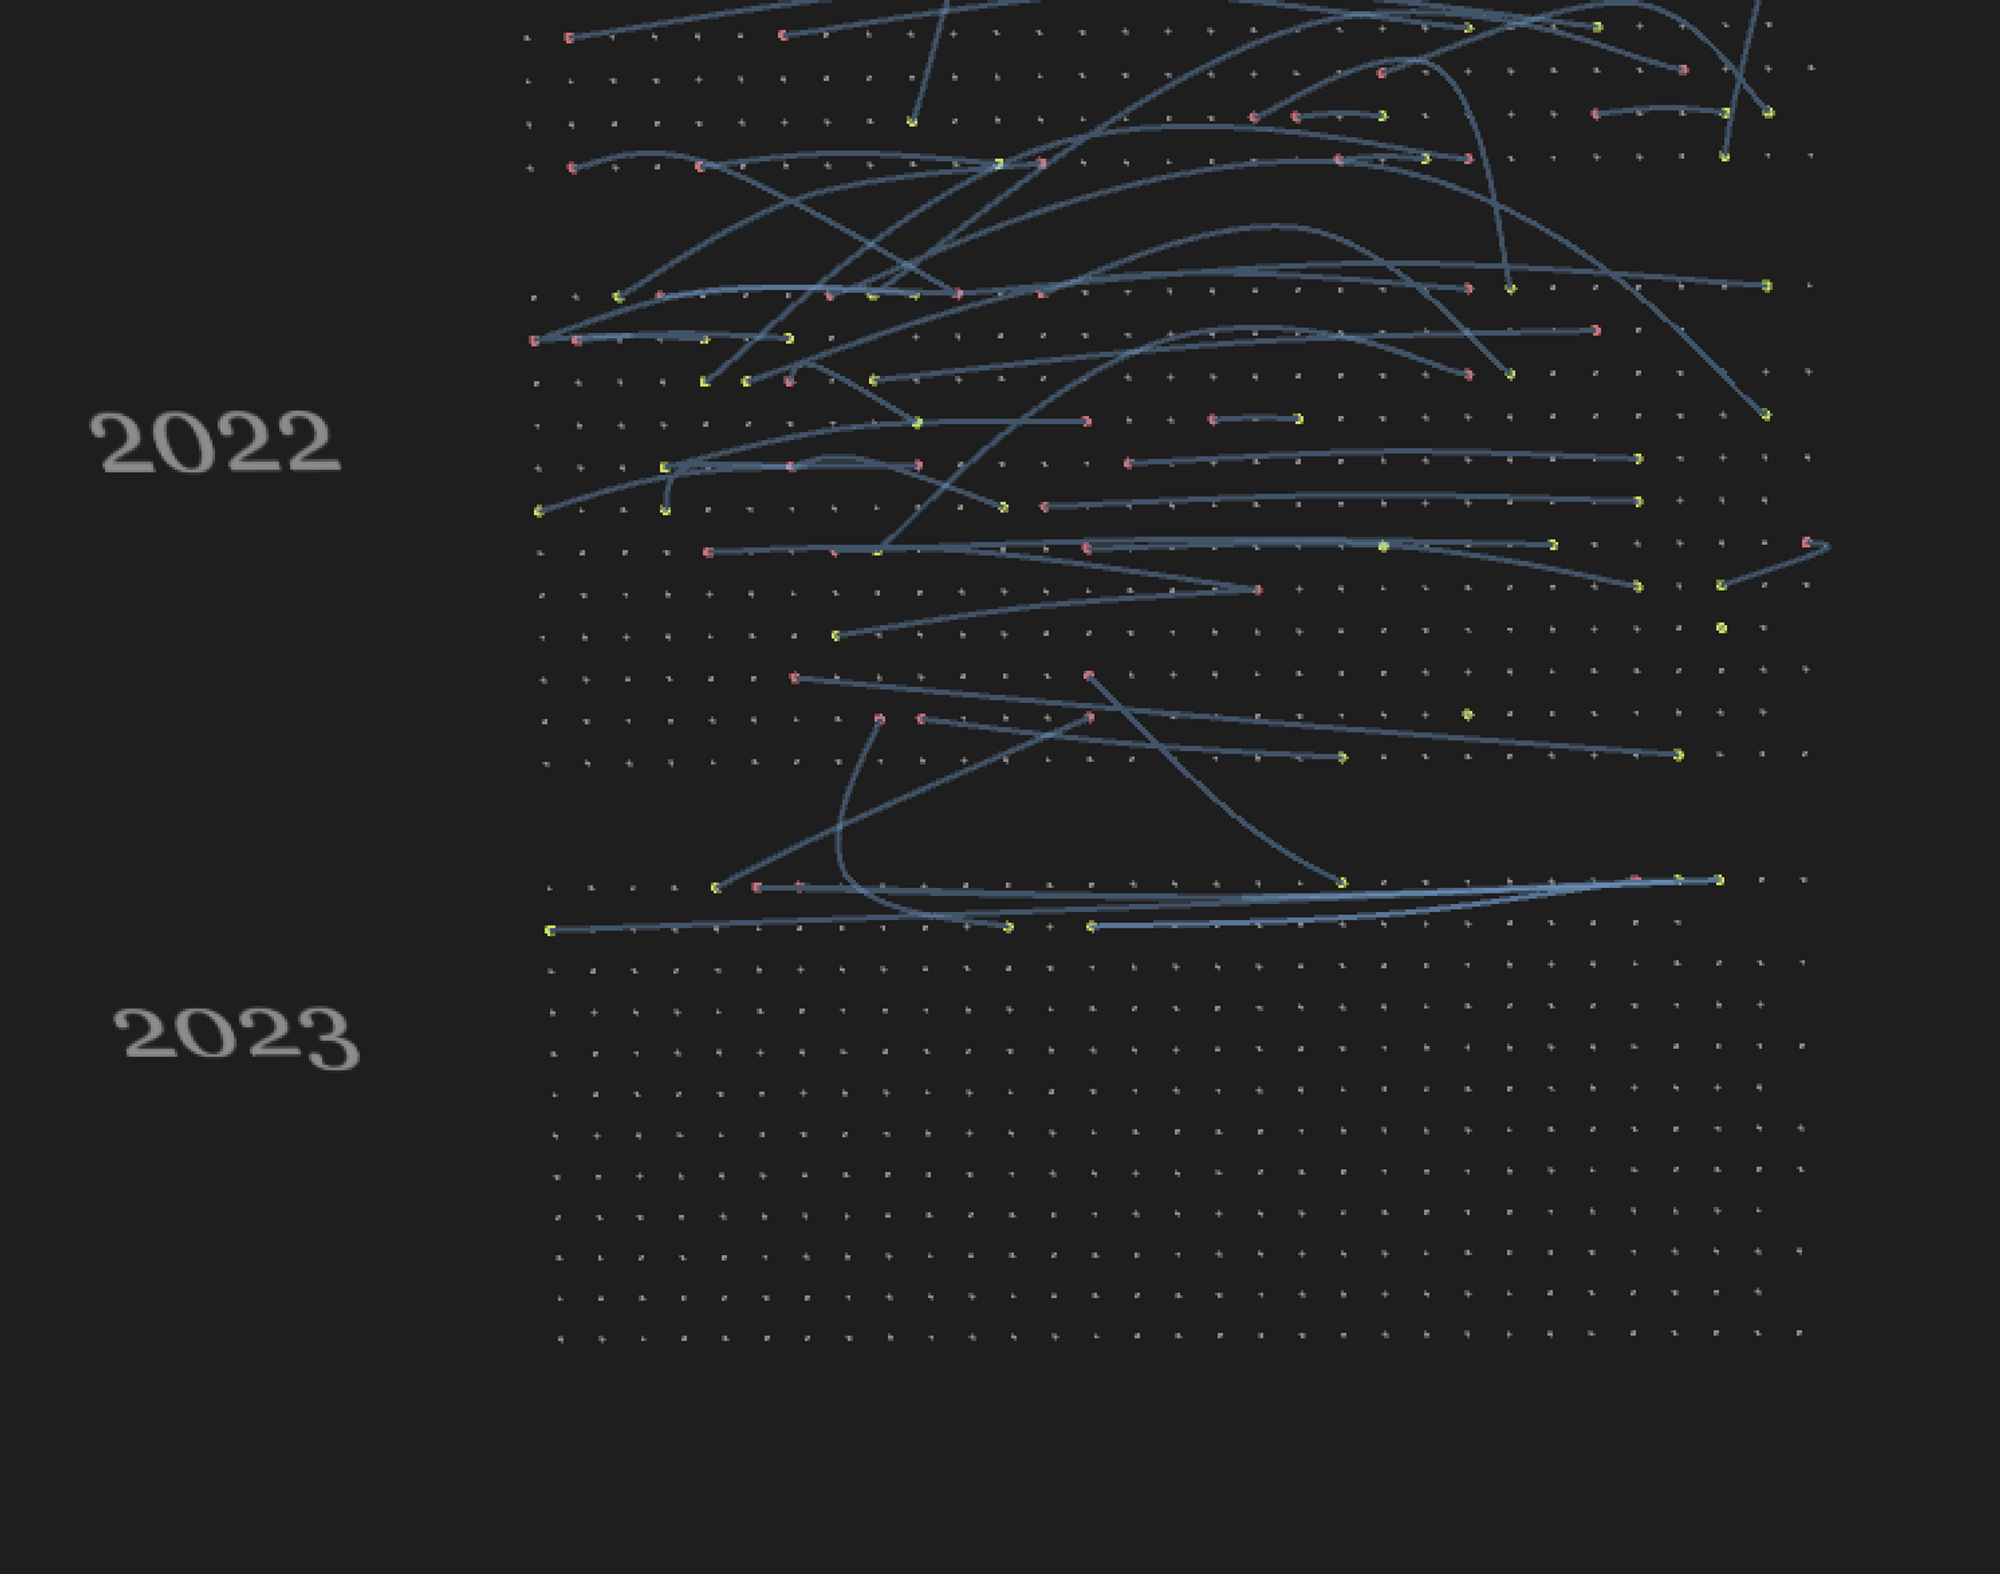
zigzag, calender grid
alternating date directions, "snake grid"
zigzag, notice how “short” one of the curve is, even though it’s very wide, very long along the x-axis
alternating date-directions, the curves’ height and width correlate better
Code