Carbon Footprint
MAT 259, 2021
Lara Floegel-Shetty
Concept
I want to visualize the amount of CO2 that is generated by each state over the years and
the sources that it comes from.
Query
The data source I used is from the EPA on Greenhouse Gases generated in the US.
It contains the metric tons of CO2 generated by each state, the location of its source,
and a breakdown of the type of source it is i.e. pulp and paper, metals and pulp and paper.
The dataset can be found here.
The dataset can be found here.
Preliminary sketches
For the initial idea, I wanted to represent each factory producing CO2 as a block whose size is
determined by the amount of CO2 they produce. I then wanted to segment them into yearly blocks going
from the years 2010 to 2019. Each of the blocks would be connected to the other blocks based off if they
were in the same state as a way to see where most of the CO2 produced was coming from.

Process
I first looked through the data collected from the EPA website and cleaned it up so I only had the data
I wanted, which consisted of the year, latitude, longtitude, factory id, state, parent company, and metric
tons of CO2 produced.
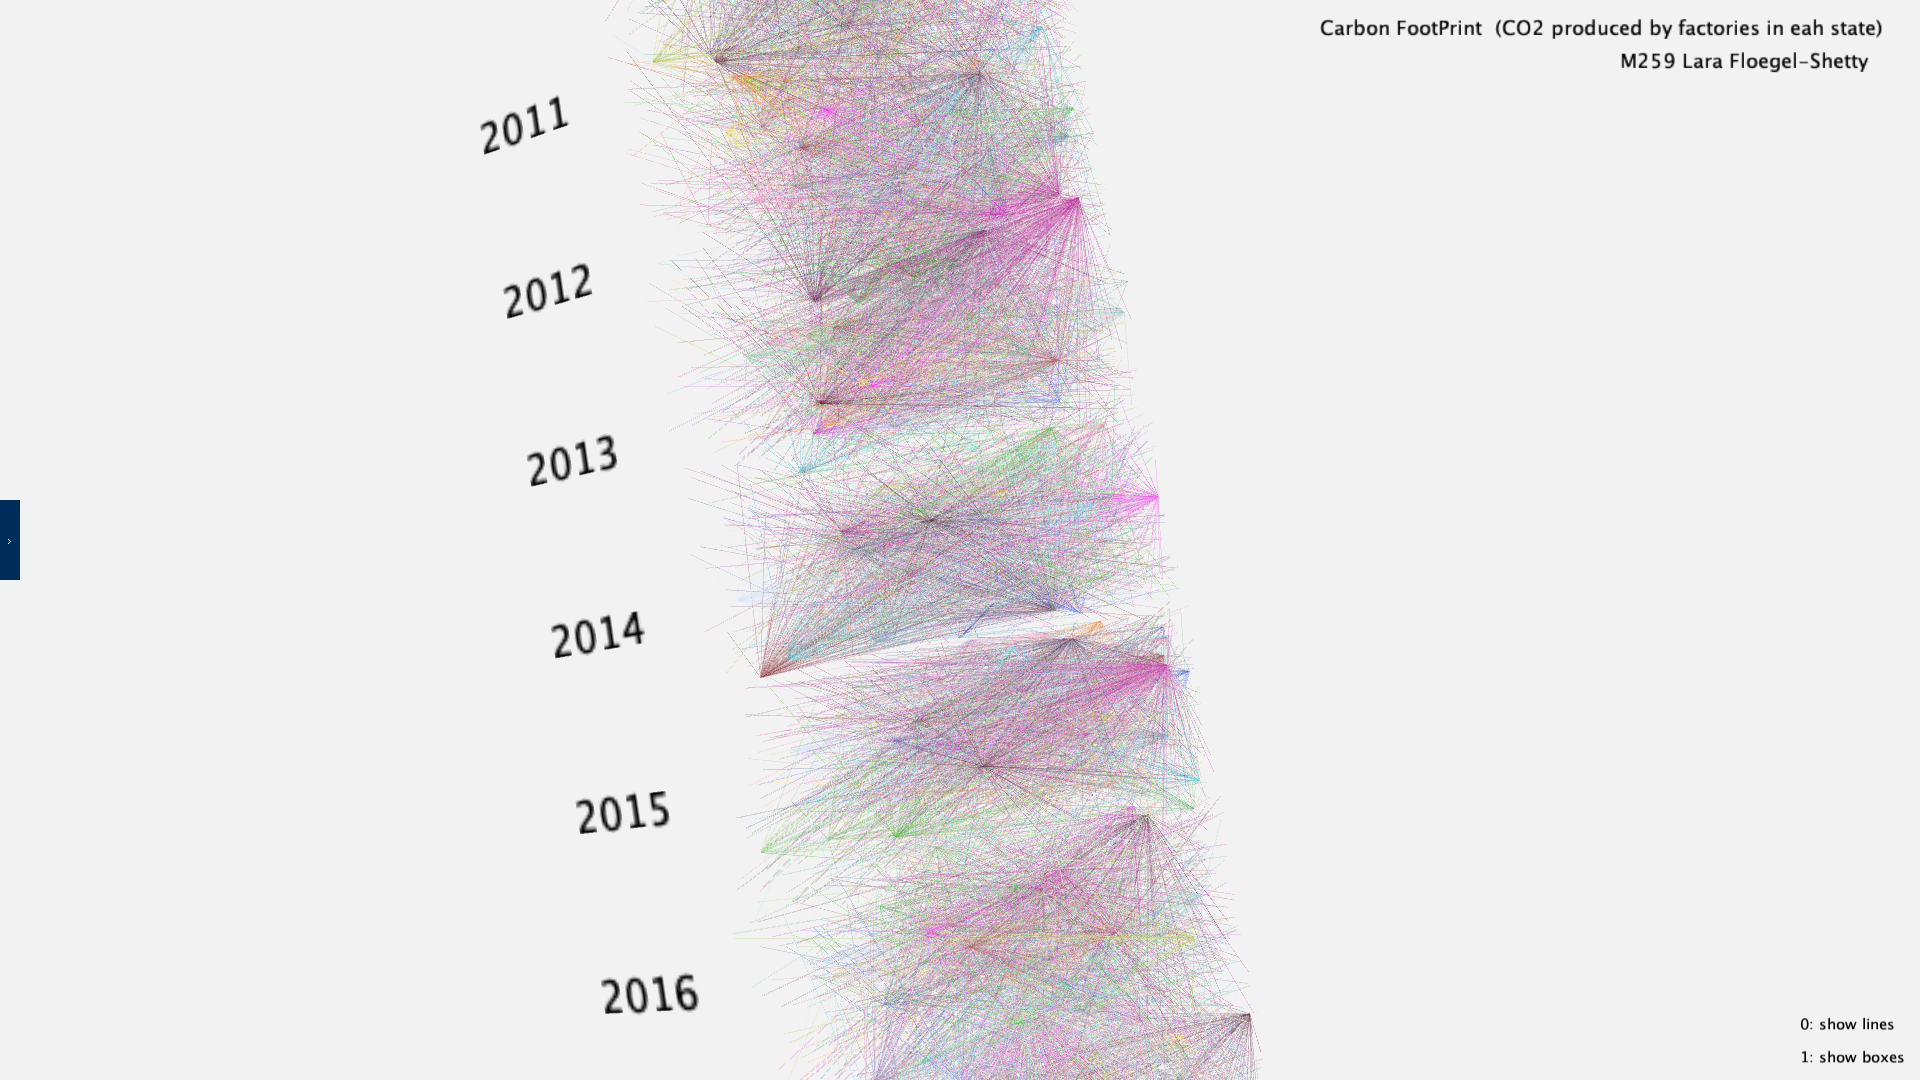
I then split the data based off the years that they belonged so I would essentially have ten blocks of data stacked on top of each other. Each block of data would be made up of all the factories that produced CO2 that year, with each block averaging around 7,000 data points.
For the blocks themselves, their random placement was based off of the factory's longtitude and latitude to ensure none of the blocks would spawn right on top of each other. The width and height of the blocks were determined by the remappingof the longitutde and latitude, but the length was set by the metric tons of CO2 produced, remapped to be within the values 0 to 500 to keep the data points within the visual limits.
The colors for each block is based on the amount of CO2 they produced incremented by 500000. The most common blocks were given a lighter color while the less common blocks were given darker colors so that they would not be obscured by the abundant smaller blocks. I made the blocks less opaque so that every block would be visible and none would be overshadowed by the blocks around them.
The connections for the blocks was initially based off on the parent companies but I encountered some difficulty in that as it was not comparing each factory's parent company correctly which would lead to connections being made that should not have been made in the first place. I then decided to make the connections based off if the factories were in the same state. I made the lines connect points from all years, but the computational power it took to make those calculations resulted in a drop in performance that made it difficult to manuveur around the data, so I kept the connections contained to each yearly segnment only.
The coloring of the lines is randomized but based on each state. I made it random as there are fifty states and it would take a lot of time putting in custom colors for each state so I decided to randomize the colors as to make the work a bit faster.
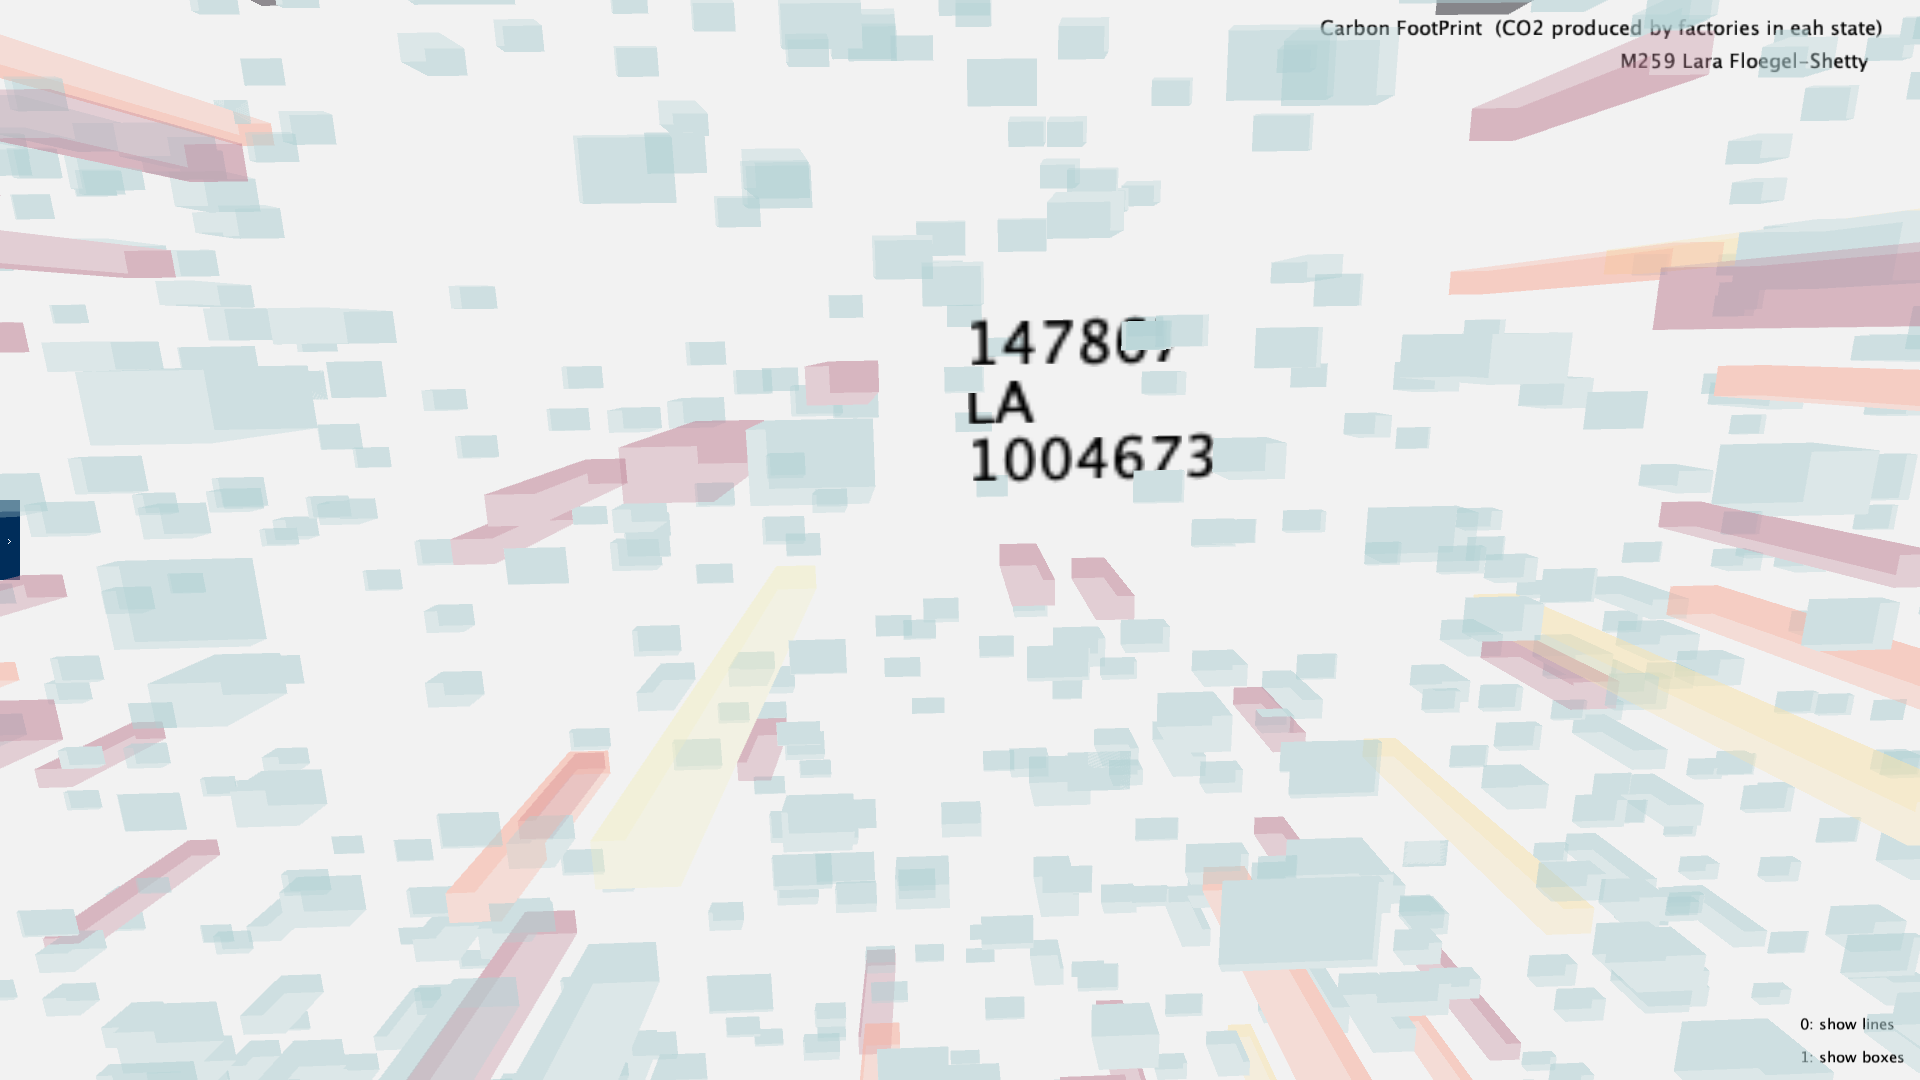
For the UI aspect, I intially had a table describing the meaning of each color, but as that took up space that could be used by the data, I decided to put the table describing the meaning of each color in a tab that the user can hide or make visible when they want to view it. For the interactive aspect, the user can press 0 if they want to make the blocks invisible or visible and 1 if they want to make the lines invisible or visible. The user can also hover over each data point to see the amount of CO2 produced by that factory, the factory ID and the state where it is.
I then split the data based off the years that they belonged so I would essentially have ten blocks of data stacked on top of each other. Each block of data would be made up of all the factories that produced CO2 that year, with each block averaging around 7,000 data points.
For the blocks themselves, their random placement was based off of the factory's longtitude and latitude to ensure none of the blocks would spawn right on top of each other. The width and height of the blocks were determined by the remappingof the longitutde and latitude, but the length was set by the metric tons of CO2 produced, remapped to be within the values 0 to 500 to keep the data points within the visual limits.
The colors for each block is based on the amount of CO2 they produced incremented by 500000. The most common blocks were given a lighter color while the less common blocks were given darker colors so that they would not be obscured by the abundant smaller blocks. I made the blocks less opaque so that every block would be visible and none would be overshadowed by the blocks around them.
The connections for the blocks was initially based off on the parent companies but I encountered some difficulty in that as it was not comparing each factory's parent company correctly which would lead to connections being made that should not have been made in the first place. I then decided to make the connections based off if the factories were in the same state. I made the lines connect points from all years, but the computational power it took to make those calculations resulted in a drop in performance that made it difficult to manuveur around the data, so I kept the connections contained to each yearly segnment only.
The coloring of the lines is randomized but based on each state. I made it random as there are fifty states and it would take a lot of time putting in custom colors for each state so I decided to randomize the colors as to make the work a bit faster.
For the UI aspect, I intially had a table describing the meaning of each color, but as that took up space that could be used by the data, I decided to put the table describing the meaning of each color in a tab that the user can hide or make visible when they want to view it. For the interactive aspect, the user can press 0 if they want to make the blocks invisible or visible and 1 if they want to make the lines invisible or visible. The user can also hover over each data point to see the amount of CO2 produced by that factory, the factory ID and the state where it is.
Final result
The resulting visual based on all of the data.

Code