Twitter Language About Capitalism
MAT 259, 2021
Colette Lee
Concept
I often find myself spending a lot of time scrolling on Twitter, and one of the topics I frequently see on my own Twitter feed is capitalism, especially within the last two years. My feed is personalized by accounts that I am following, so I wanted to see what all of Twitter says about capitalism and analyze the language people use in these tweets.
Data
I used a Twitter scraping tool Twint in Python to fetch all Tweets that contain the word ‘capitalism’ from January 1, 2010 to February 25, 2021 with at least 1,000 likes. I scraped a total of 5,903 Tweets from Twitter.
Here is a sample of the data. For each tweet it includes the ID number of the tweet, the username of the Tweet’s author, the text of the Tweet, the number of retweets and the number of likes.
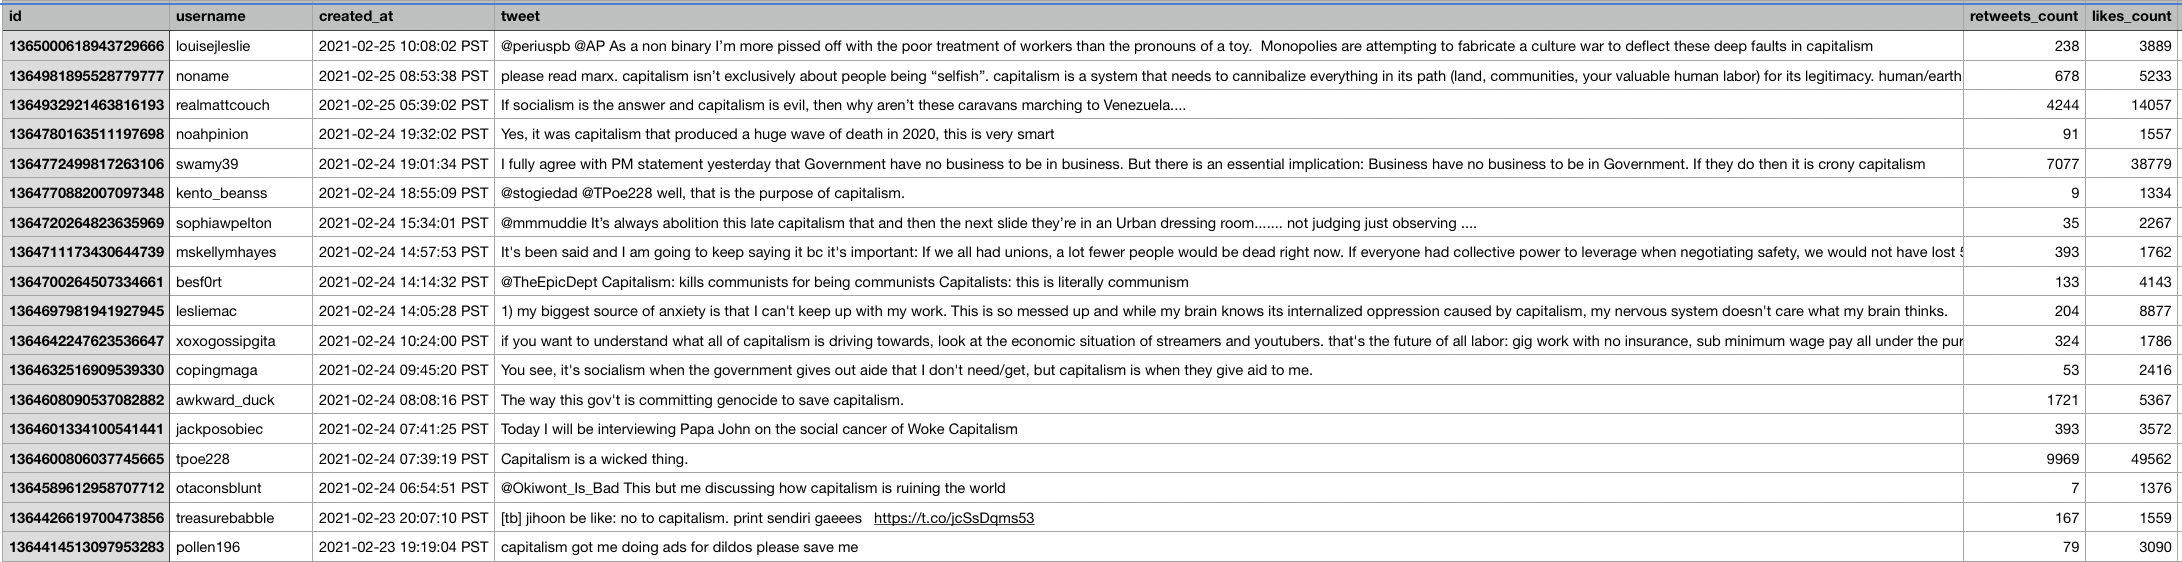
Here is a sample of the data. For each tweet it includes the ID number of the tweet, the username of the Tweet’s author, the text of the Tweet, the number of retweets and the number of likes.
Inspiration
Visually, I was inspired by abstract depictions of cityscapes. I wanted to represent each Tweet as a box, so that all together it would look somewhat like an abstract floating city.


Process
Natural Language Processing
Sentiment Analysis
I used TextBlob, a Python library for processing textual data to perform sentiment analysis on each Tweet. The sentiment analysis provided by TextBlob uses rule-based sentiment analysis to determine polarity and subjectivity. Polarity is mapped to a real value from -1.0 to 1.0 with -1.0 being the most negative and 1.0 being the most positive. Subjectivity is mapped from 0 to 1.0 with 0 being the least subjective and 1.0 being the most subjective.I found that the sentiment analysis was not very accurate. I believe one of the reasons for this is that it cannot detect sarcasm, which is frequently used in Tweets.
I used the sentiment analysis of each Tweet to determine color. The polarity determines hue with most negative corresponding to a blue-green color and most positive corresponding to red. The subjectivity determines brightness.
N-gram and Noun Phrase Extraction
I used TextBlob to extract frequencies of n-grams in the text from all of the Tweets. N-grams are defined as a contiguous sequence of n items from a given sample of text or speech. Below are the most common unigrams (1-grams) and bigrams (2-grams) and their frequencies.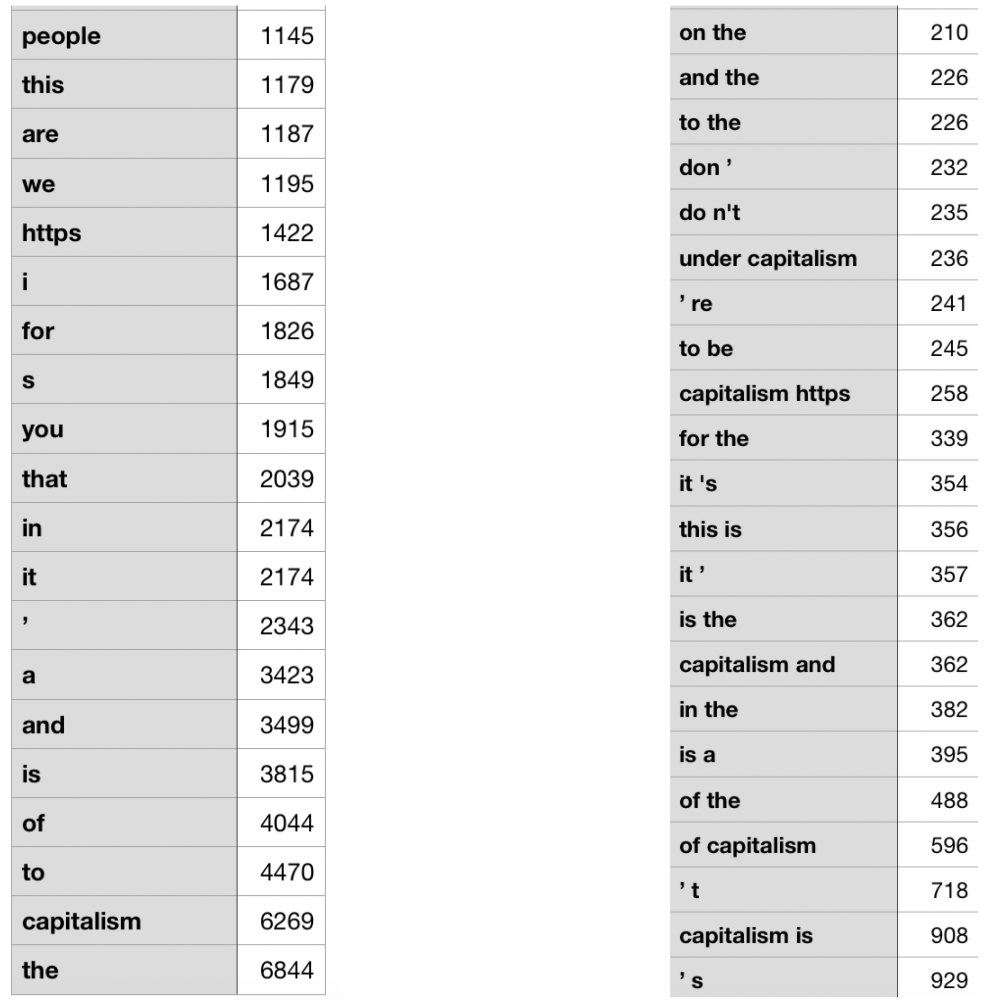
Similarly, I used TextBlob to extract frequencies of noun phrases in the text from all of the Tweets. A noun phrases is defined as a word or group of words that functions in a sentence as subject, object, or prepositional object. These are the most common noun phrases and their frequencies.

Semantic Text Similarity
I chose the following noun phrases and unigrams to use in my visualization:- Late capitalism
- American capitalism
- Free market
- Economic system
- Poor people
- Workers
- Rich
- Socialism
- White people
- White supremacy
- Black people
- Black capitalism
- Racial capitalism
I used another Python library, semantic-text-similarity, which uses a BERT-based semantic text similarity model to map the similarity of each phrase and the text of each tweet to real values from 0.0 to 5.0. (BERT stands for Bidirectional Encoder Representations from Transformers)
I used these values to determine the position of each box along the y and z axes. Position along the x-axis is determined by the date the Tweet was posted. For each phrase pi, I calculate a position
(zi, yi) where zi = ri * cos(ai) and yi = ri * sin(ai) and ri = the similarity value for pi and all ai are evenly distributed between 0 and 2*π. I then calculate a final position as the average of all the (zi, yi).
Final result
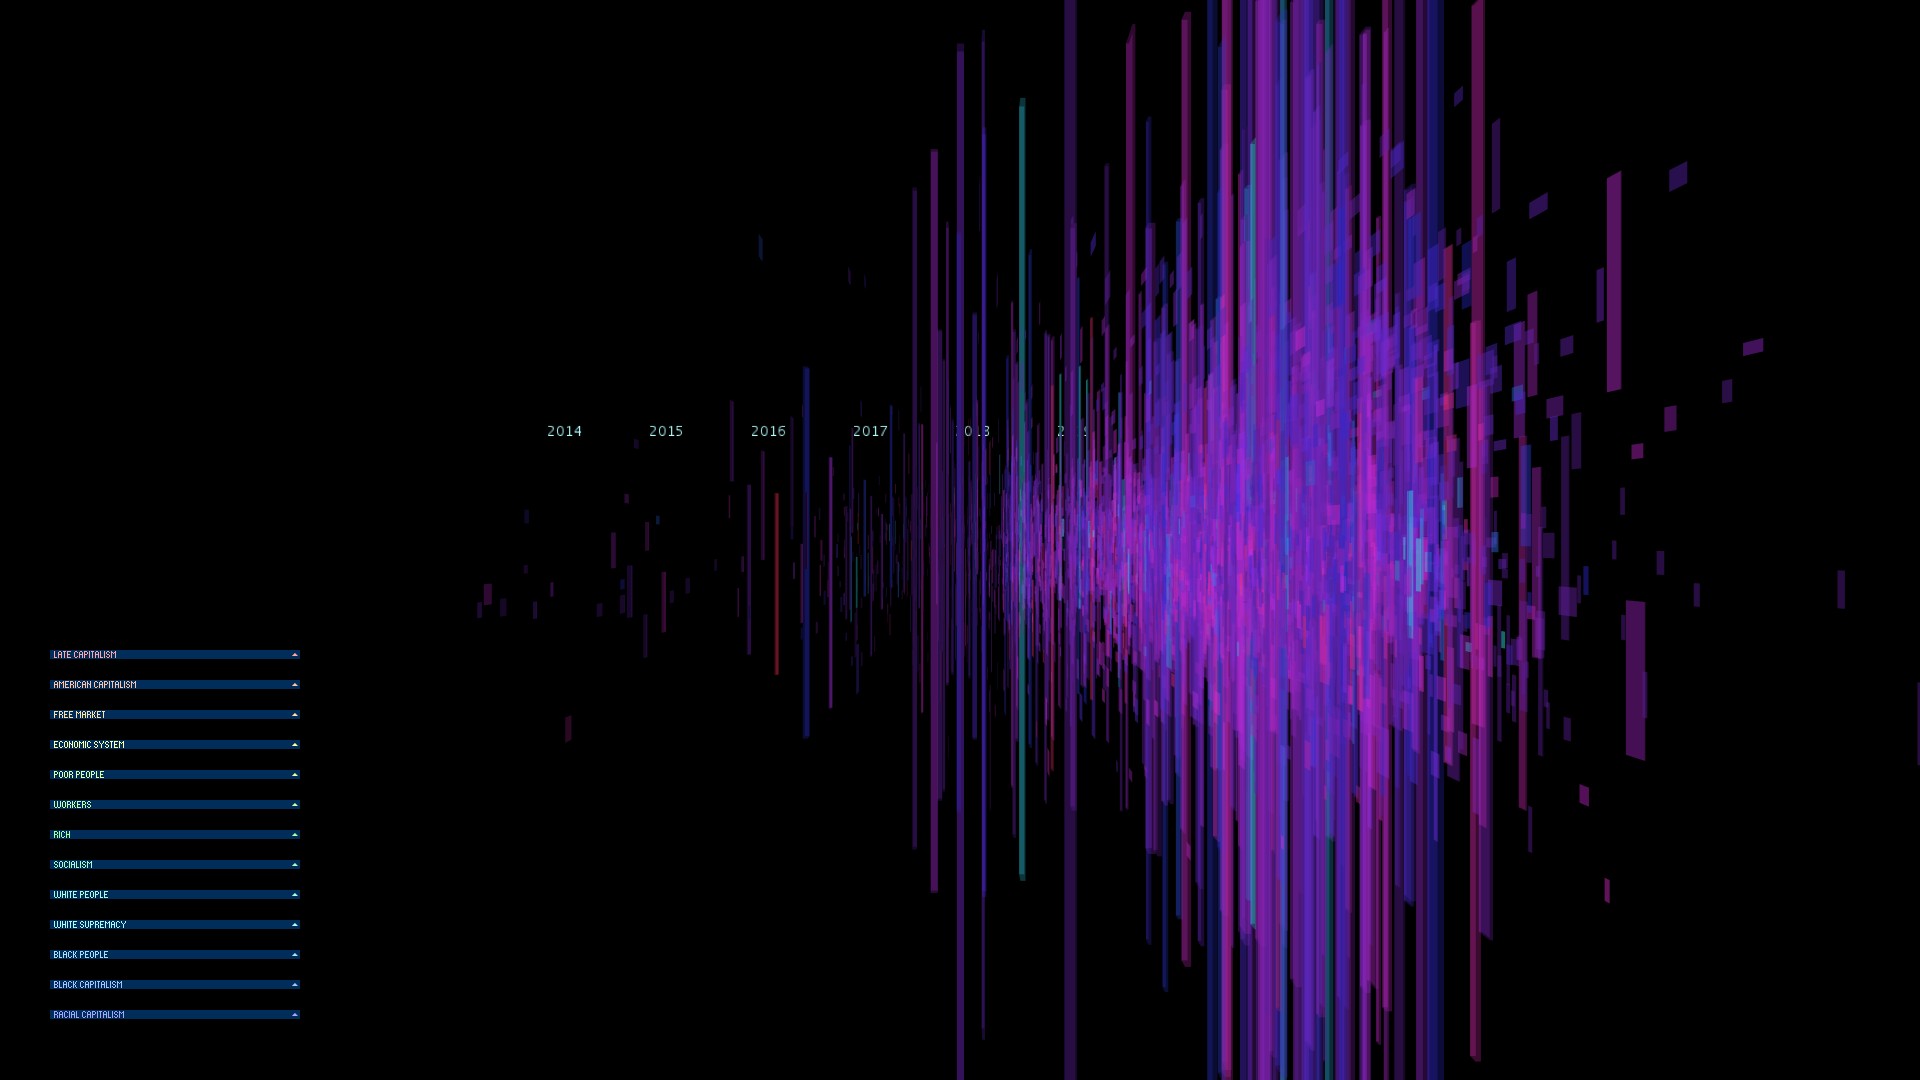
This is my final visualization. Each Tweet is represented by a box where the height corresponds to the number of likes, the width corresponds to the number of retweets, and the depth corresponds to the length of the Tweet.
The user can click on a box to display the Tweet on the bottom of the screen. When the control groups on the left are expanded, the user can toggle on/off a line that goes through every Tweet that explicitly contains the corresponding phrase. The slider filters the Tweets displayed by their similarity values to the phrase.


The user can click on a box to display the Tweet on the bottom of the screen. When the control groups on the left are expanded, the user can toggle on/off a line that goes through every Tweet that explicitly contains the corresponding phrase. The slider filters the Tweets displayed by their similarity values to the phrase.
Code