Precipitation vs "Water" Checkouts
MAT 259, 2021
Ashley Bruce
Concept
Given the amount that it rains in Seattle, I wanted to see if there was a correlation between how much
it rained, and checkouts of books with “Water” keywords in the title.
Query
select *
from spl_2016.outraw
where (
LOWER (title) like '% rain %'
or LOWER (title) like '%water%'
or LOWER (title) like '%river%'
or LOWER (title) like '% lake %'
or LOWER (title) like '%ocean%'
or LOWER (title) like '%sea %'
)
and year(cout) = YEAR**
** YEAR = 2007-2019
from spl_2016.outraw
where (
LOWER (title) like '% rain %'
or LOWER (title) like '%water%'
or LOWER (title) like '%river%'
or LOWER (title) like '% lake %'
or LOWER (title) like '%ocean%'
or LOWER (title) like '%sea %'
)
and year(cout) = YEAR**
** YEAR = 2007-2019
Preliminary sketches
Please put your sketches here with some explanations.

Since this project deals with rain, I initially wanted my visualization to look like rain falling. This was a sketch of the initial idea. As I started making the project, I realized the data points would not be well spread out and the overlap would not be informative. I decided it would be a good idea to make some new ideas. This next sketch was an an updated idea.
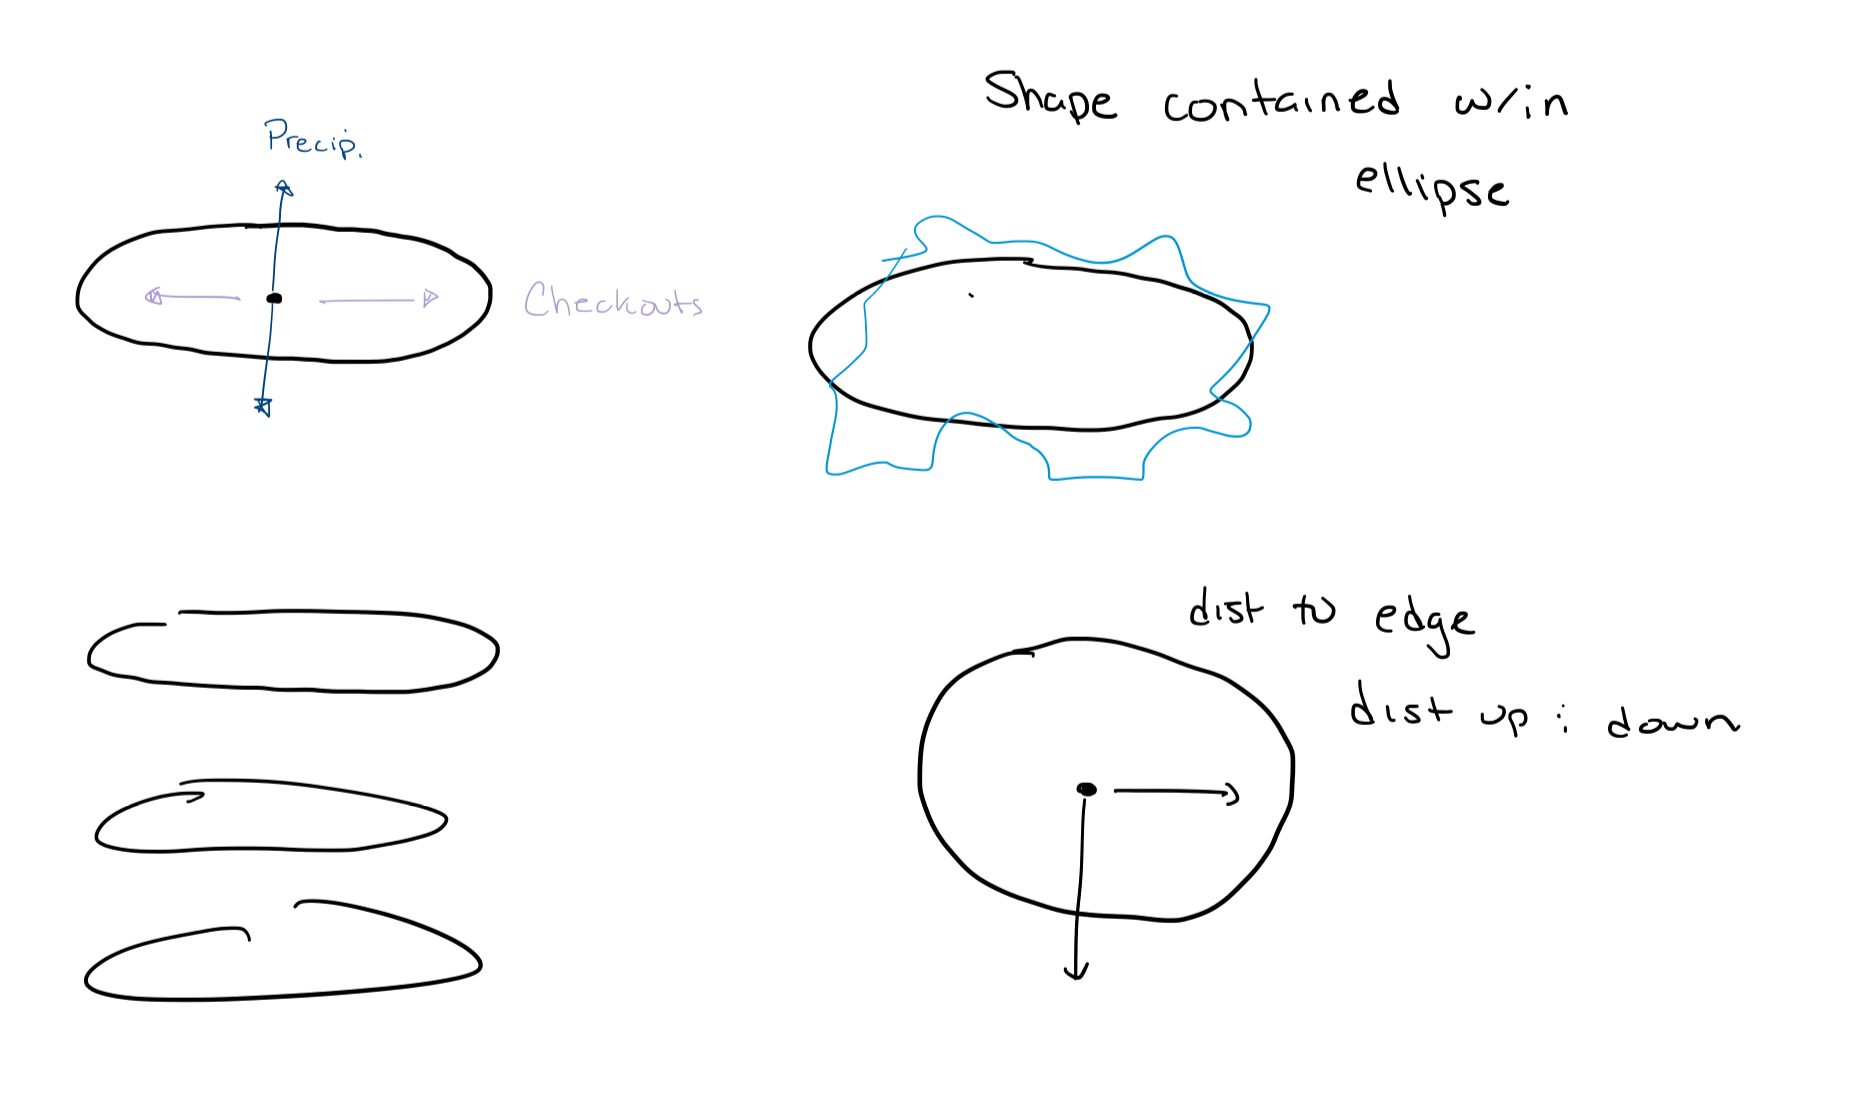
I still liked the idea of data being contained within the circles, and decided to start with that idea. Eventually I wanted to incorporate a line connecting some points, but was unsure as to how to go about it. Once I discovered the convex-hull algorithm, I realized it would be perfect, and decided to use that.
Since this project deals with rain, I initially wanted my visualization to look like rain falling. This was a sketch of the initial idea. As I started making the project, I realized the data points would not be well spread out and the overlap would not be informative. I decided it would be a good idea to make some new ideas. This next sketch was an an updated idea.
I still liked the idea of data being contained within the circles, and decided to start with that idea. Eventually I wanted to incorporate a line connecting some points, but was unsure as to how to go about it. Once I discovered the convex-hull algorithm, I realized it would be perfect, and decided to use that.
Process
The data used for this project was obtained by requesting Seattle precipitation data from the NOAA for the
years 2007 through 2019. Once a request was placed, a csv with the requested data was emailed. With the
precipitation data and the CSV files from the Seattle library query, there was a ton of data to sift through.
To reduce the size of the data, I wanted to group all the titles together via checkout number for each day so I
could more easily associate it with the precipitation values provided by the NOAA. To do this, I wrote a short
Python code that took the CSV file output from the query and returned another CSV with the daily checkout numbers.
This code is included in the zip file. Once these CSVs were obtained, I further cleaned the data by filtering the
titles so each key word could be isolated. After all the data cleanup was done, I could visualize the data.
Final result
Once the convex-hull algorithm was implemented, the results looked quite nice.

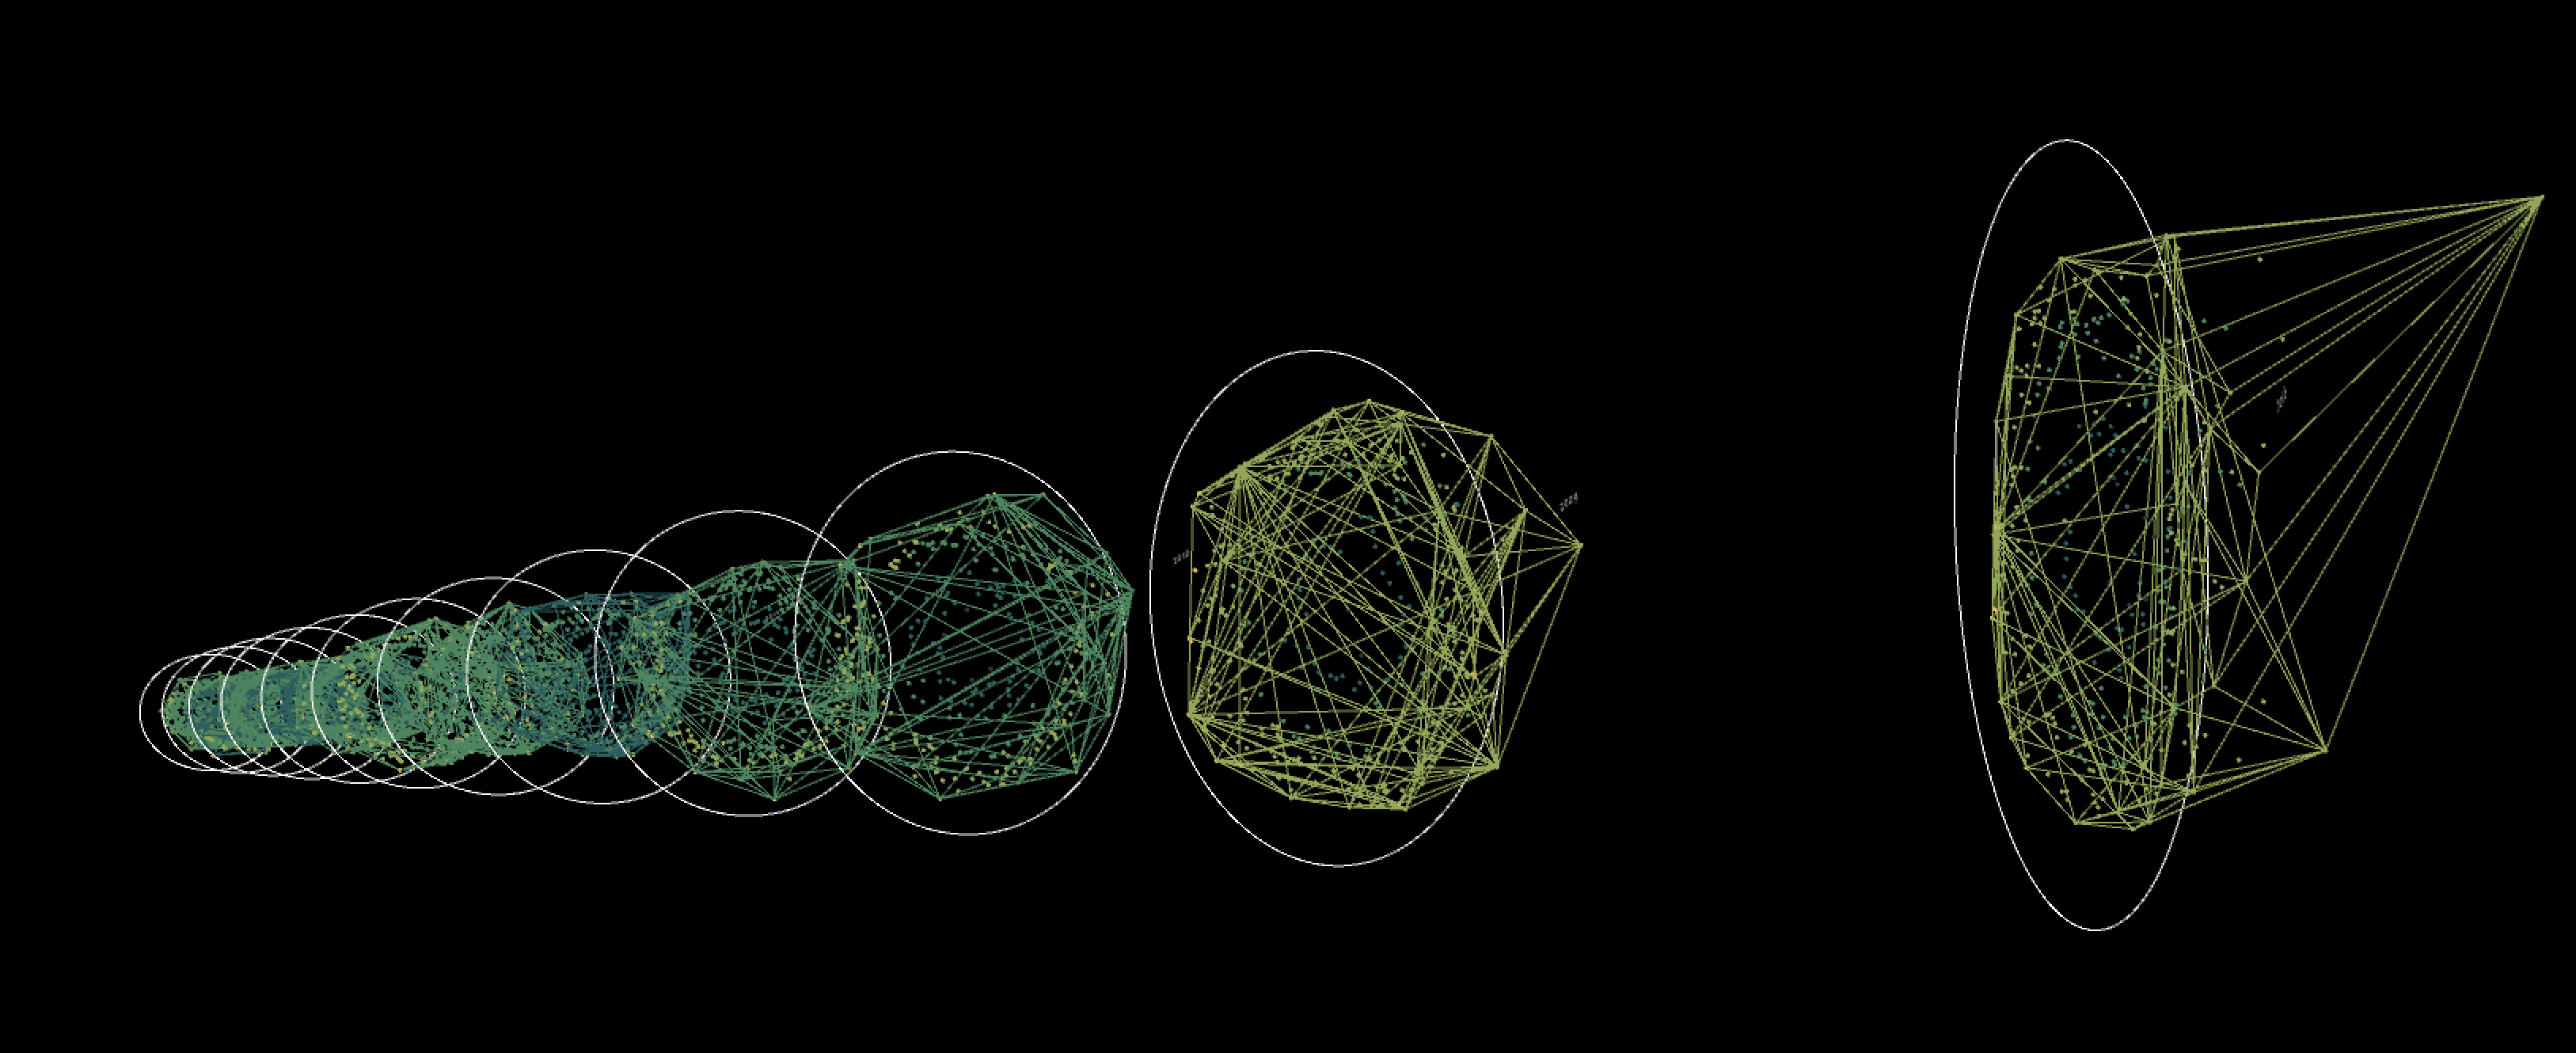
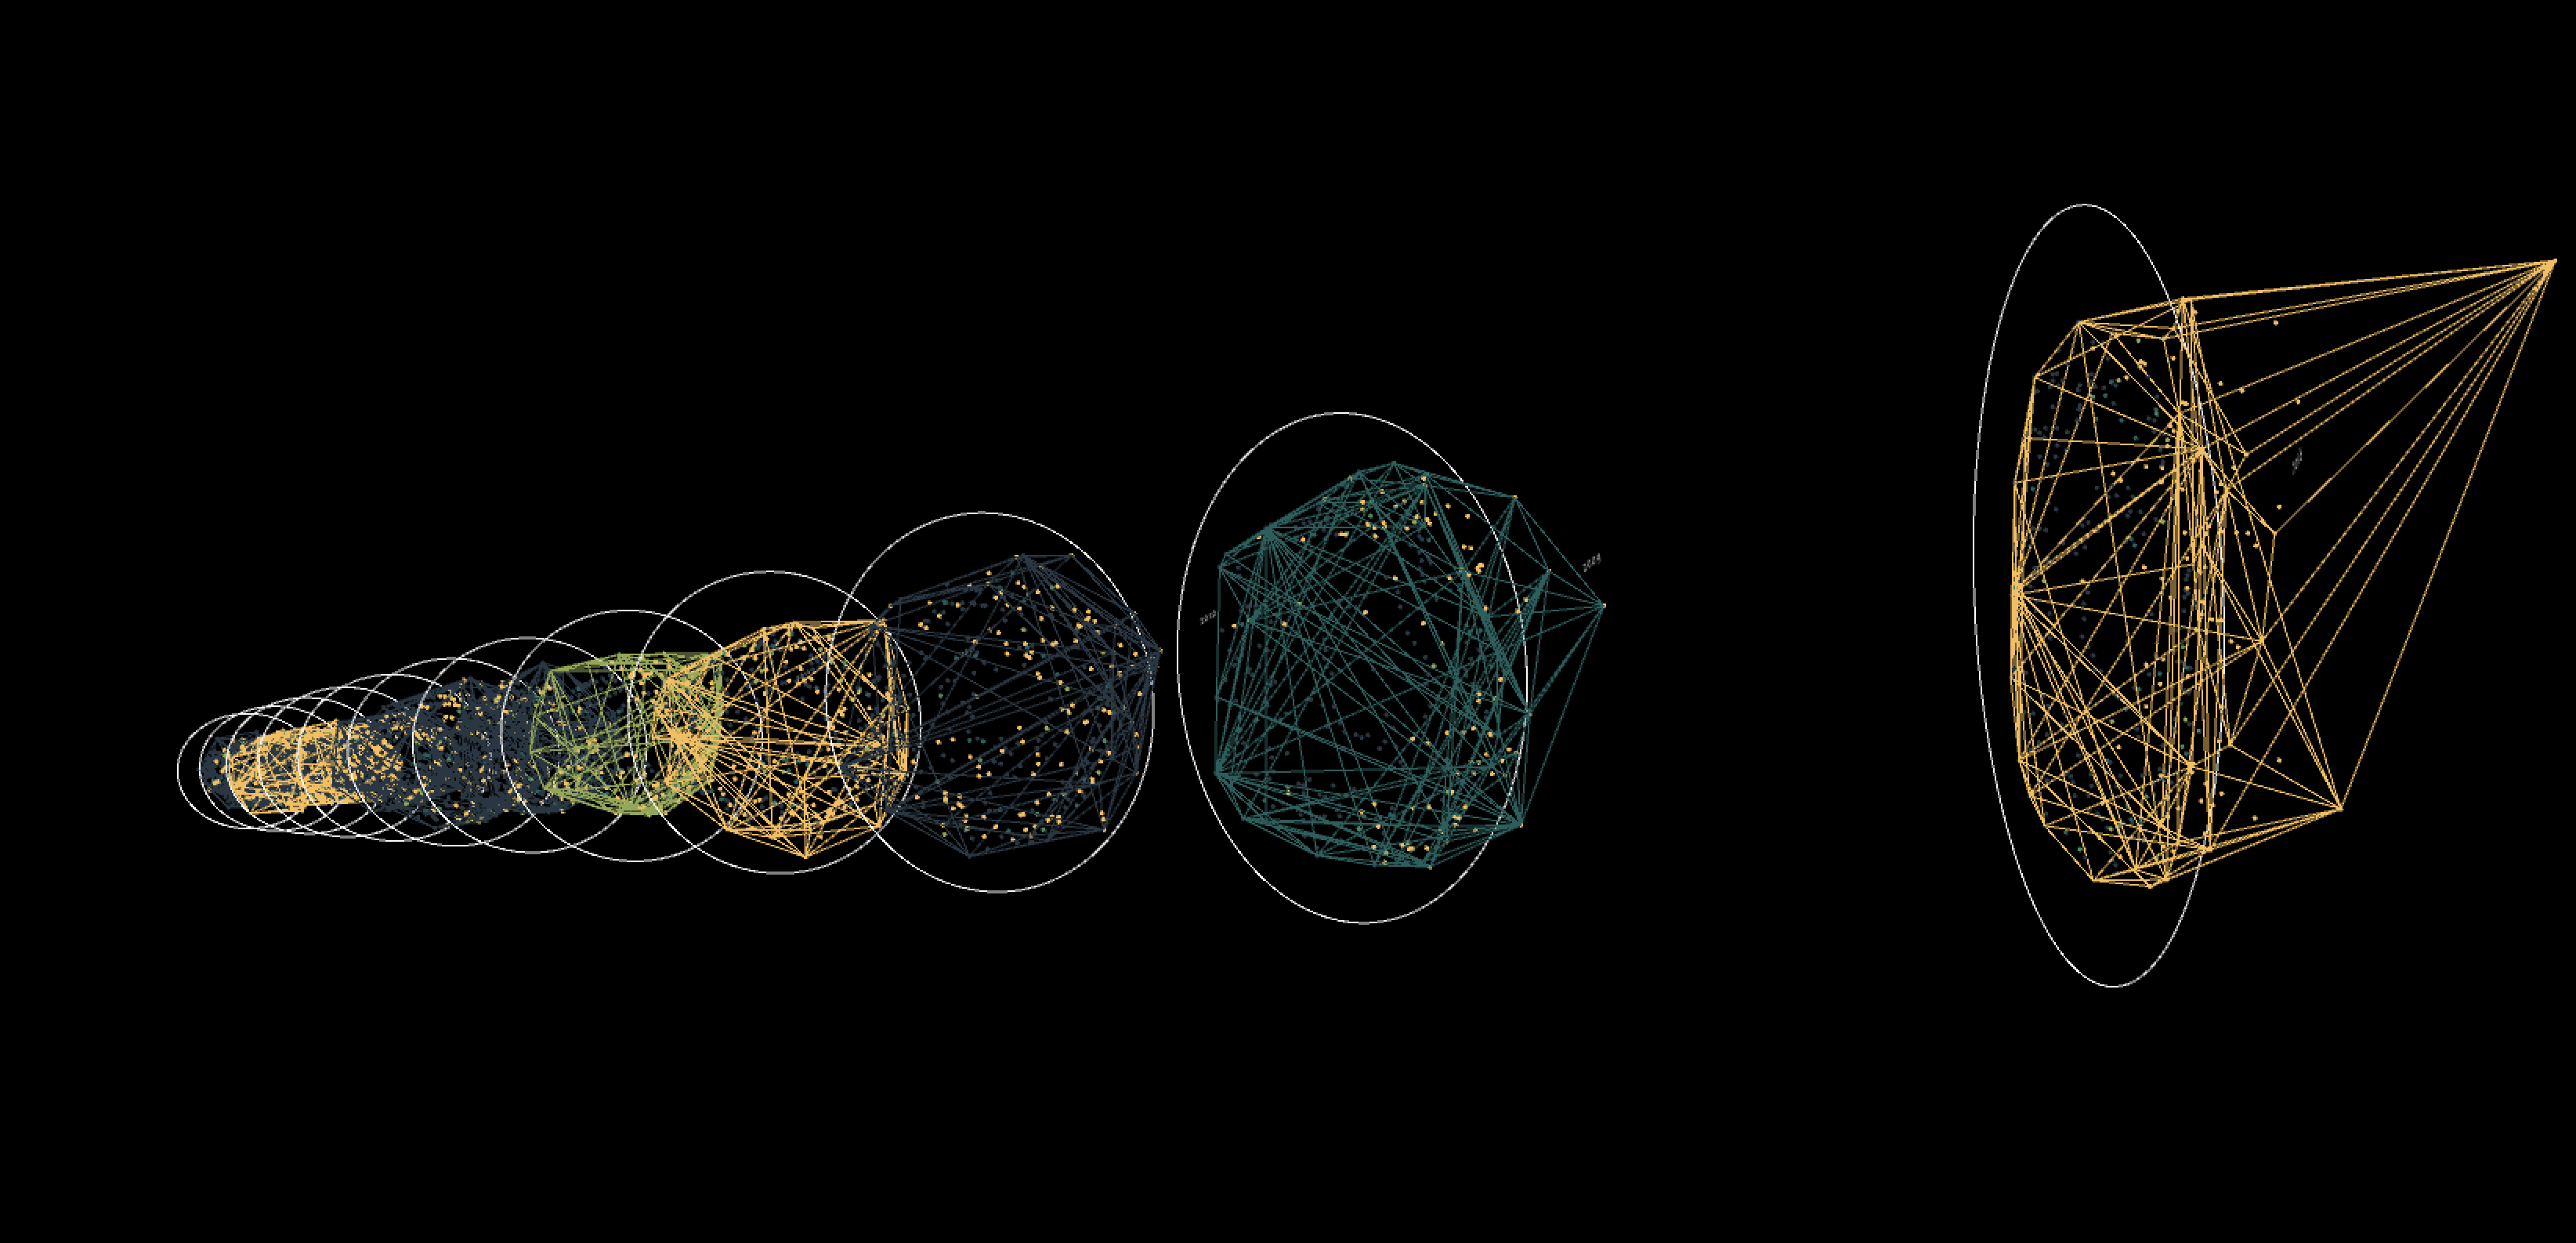


The user can toggle between color options, as well as being able to view the convex-hull lines or not. Color options include color according to relative precipitation, where warmer colors represent larger relative precipitation amounts and cooler colors represent smaller relative amount, or relative checkout numbers, with the same color scheme. The user can also toggle through which subset of the data they want to view.
As can be seen, there is no real correlation between the precipitation amount and the total number of checkouts of books about water.
Code