The Slow Readers of Seattle Public Library (SPL)
MAT 259, 2020
Evgeny Noi
Concept
My main goal in visualizing the Seattle Public Library (SPL) data was to bring in the locational
information into investigation. In my previous project I identified and joined locational attributes of 11,000 books
to include the information on the branch where the books are stored. Another crucial element of proposed visualization
was in generating representation at the finest level of detail. That is, the base unit of analysis should have been the
most basic one: individual check-ins or check-outs. Overall, around 130,000 identifiable check-ins/outs within the course of
3 years (2012-12-31 – 2015-12-31) were found in the database for 11,000 books, followed by a simple exploratory analysis.
Here my first design decision was to switch from p5.js onto standalone Processing due to the volume of the data.
Query
                    select *
                    from spl_2016.inraw
                    where (cout>'2012-12-31' and cout<'2015-12-31') and
                        CONCAT(bibNumber,collcode,itemtype) in ('261cs9rarbk',
                    '813canfacbk',
                     -- insert unique identifiers from the attached sql file (11,000 lines of code).
                    );
Preliminary sketches
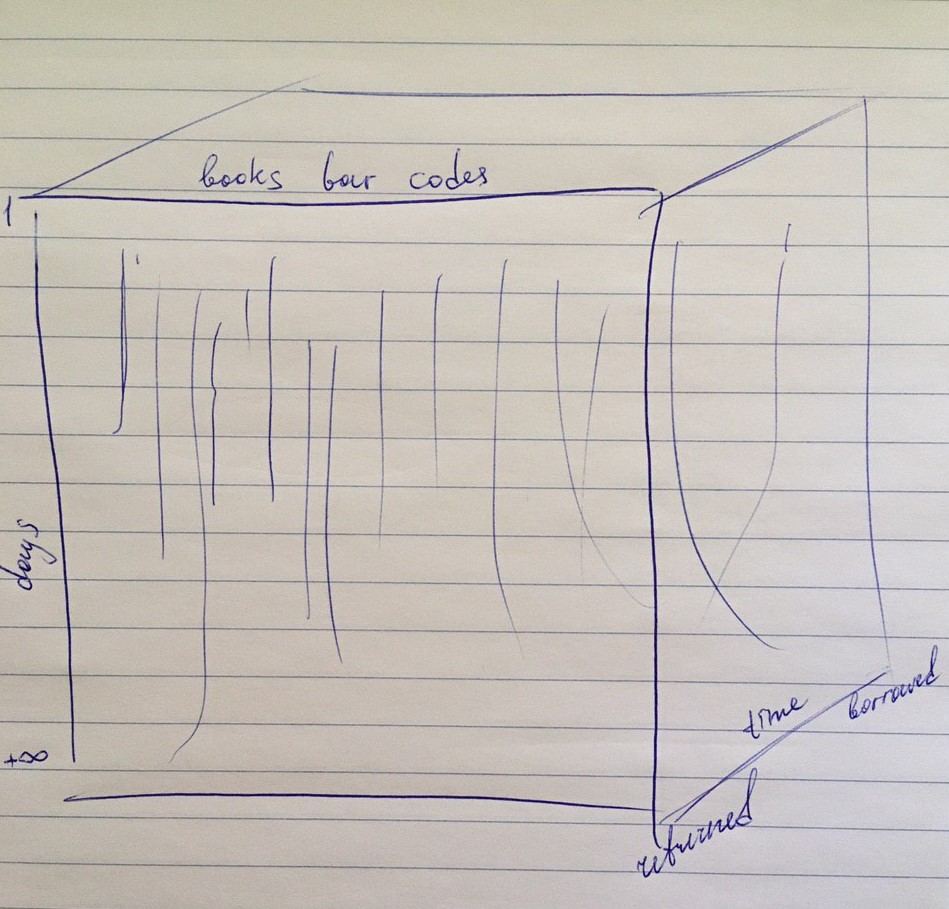
I started out working with a follow-along examples from the class. From left to right I mapped a spot
for each individual book. Then, on the vertical axis the time span of the loan from the first day
of the observation period (2012-12-31). The z-axis depicts the time of the day the books was either
checked-out or returned.
Process
Because the granular analysis was based on individual check-in trajectories in time, I decided to project
each individual book on the horizontal (X) axis. In fact, new variable ‘ranker’ was generated as a re-ordered
version of the barcodes (see code below), where the books were sorted according to the branch, in which they
were stored. This allowed visible differentiation of patterns in data, with visible groupings.
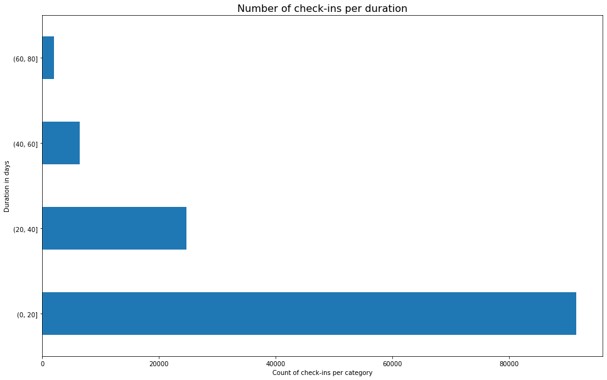
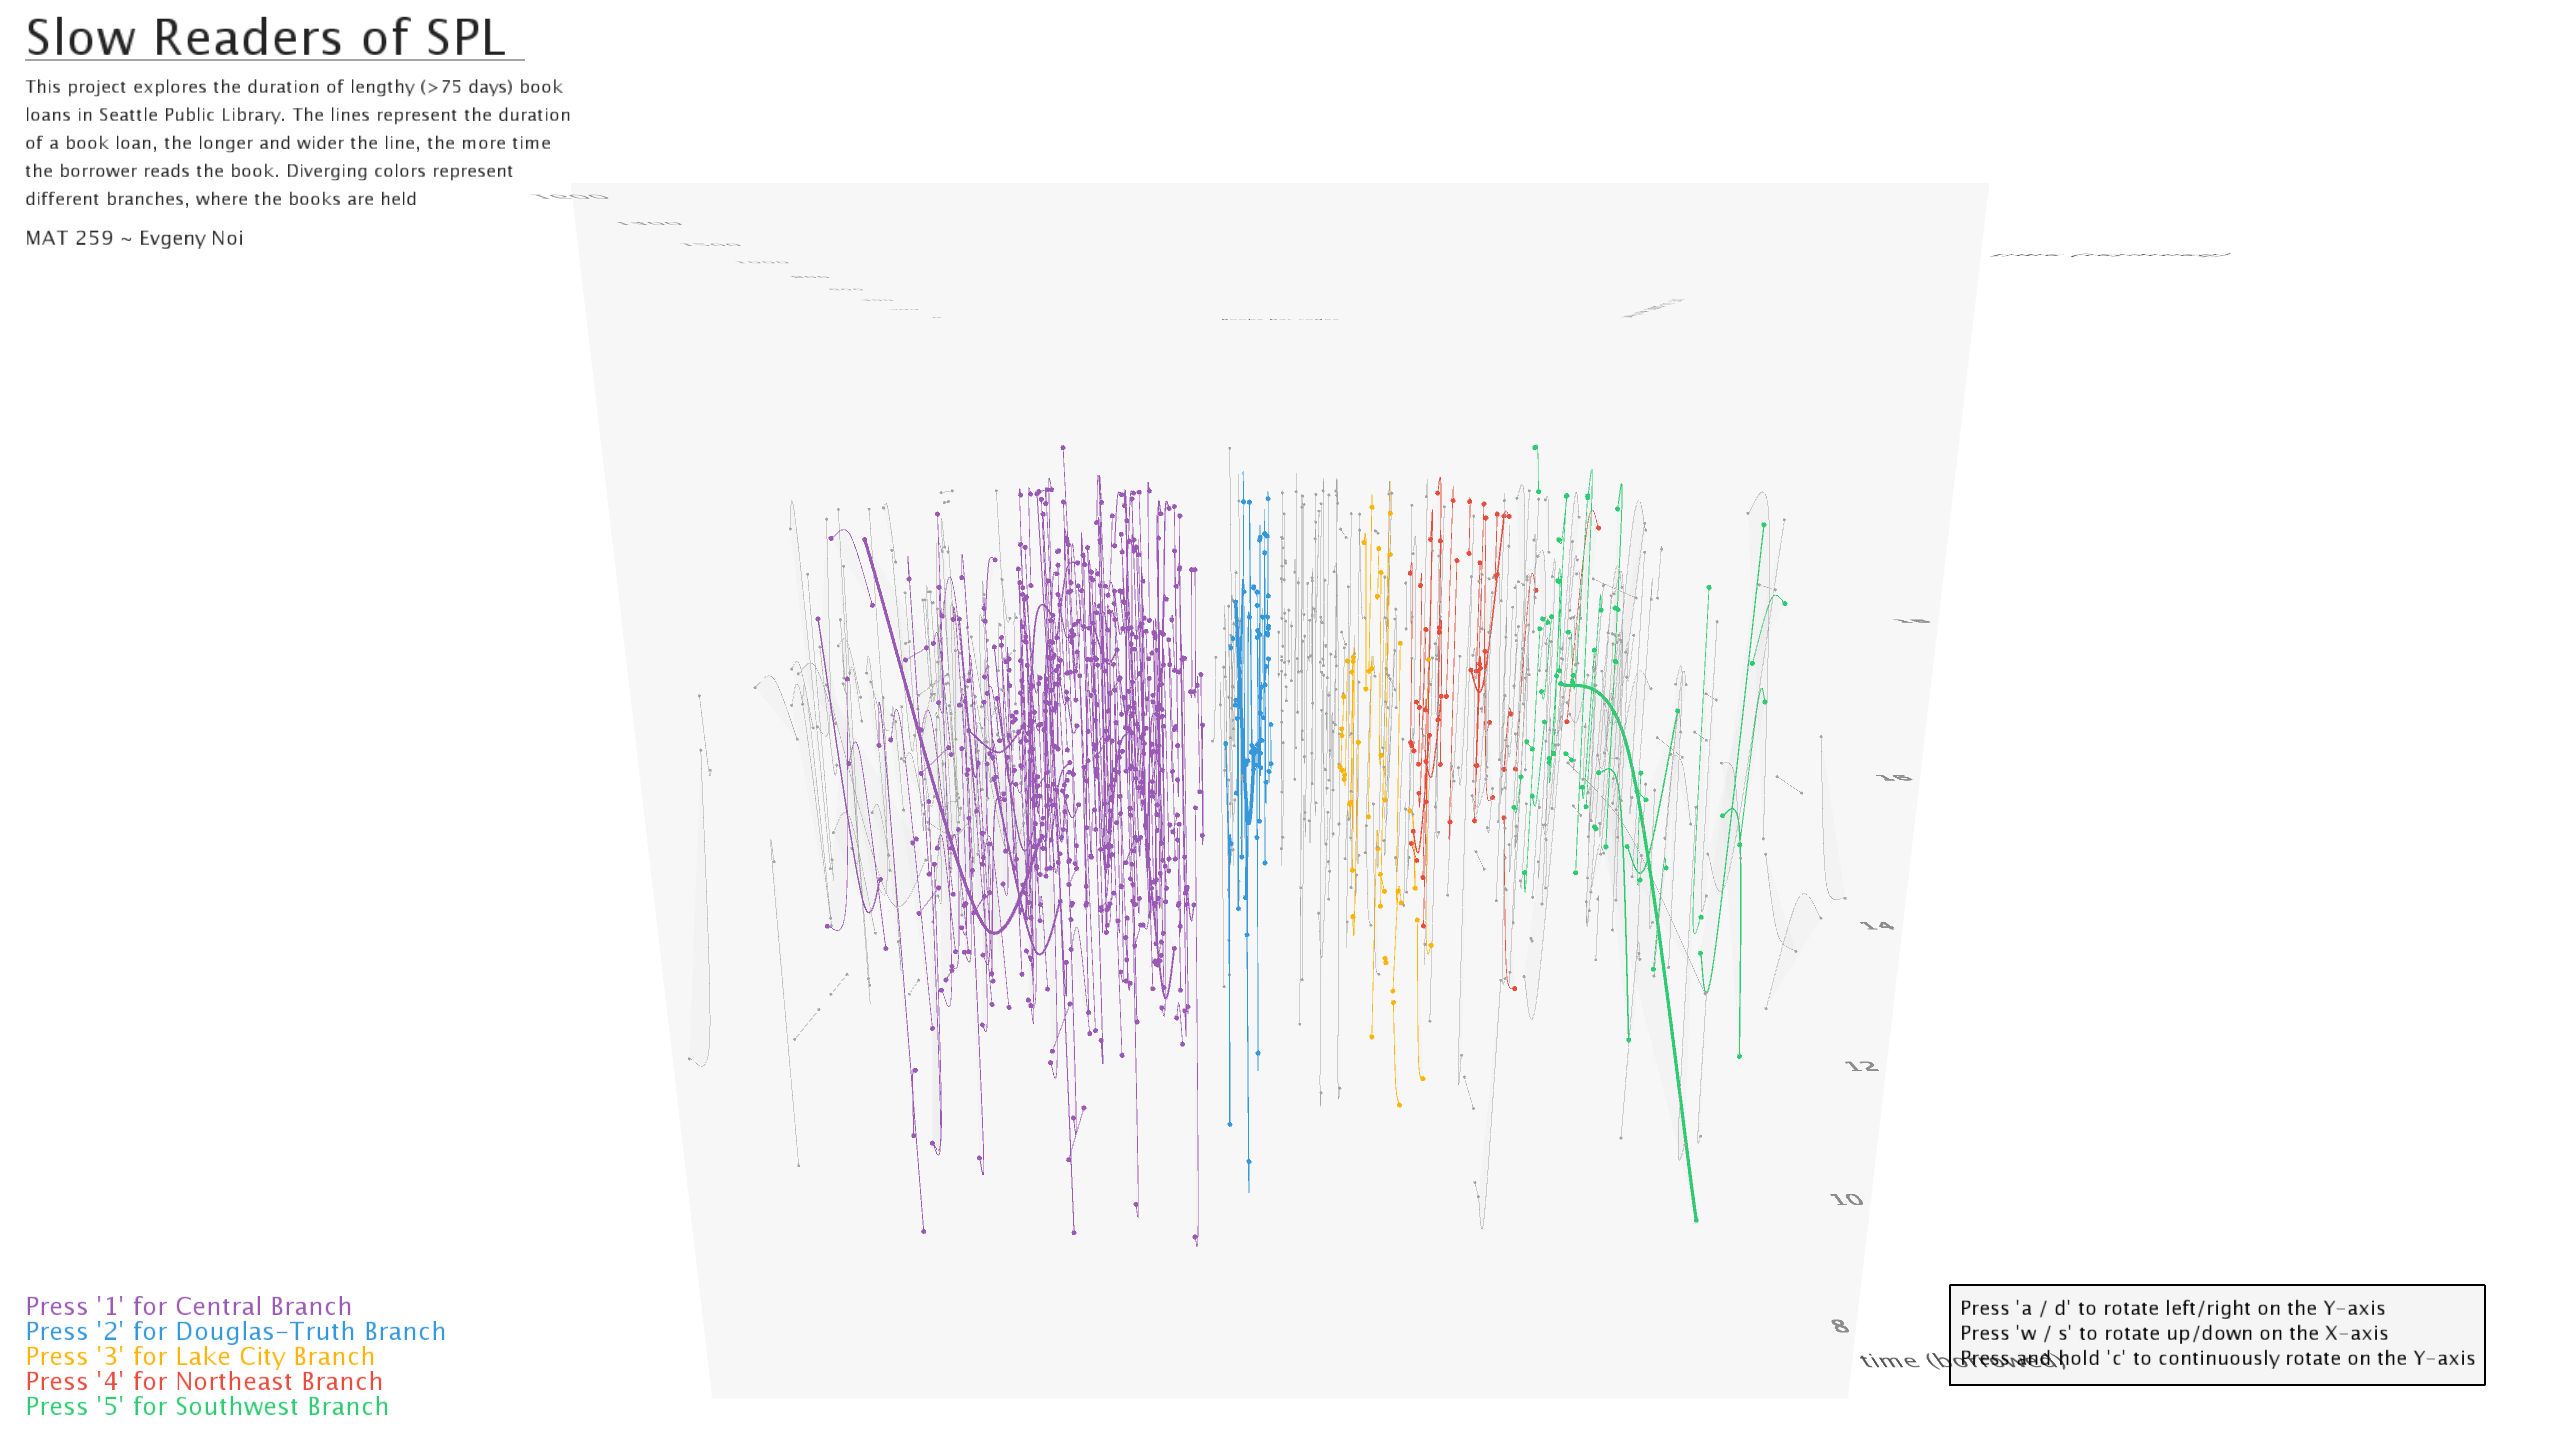
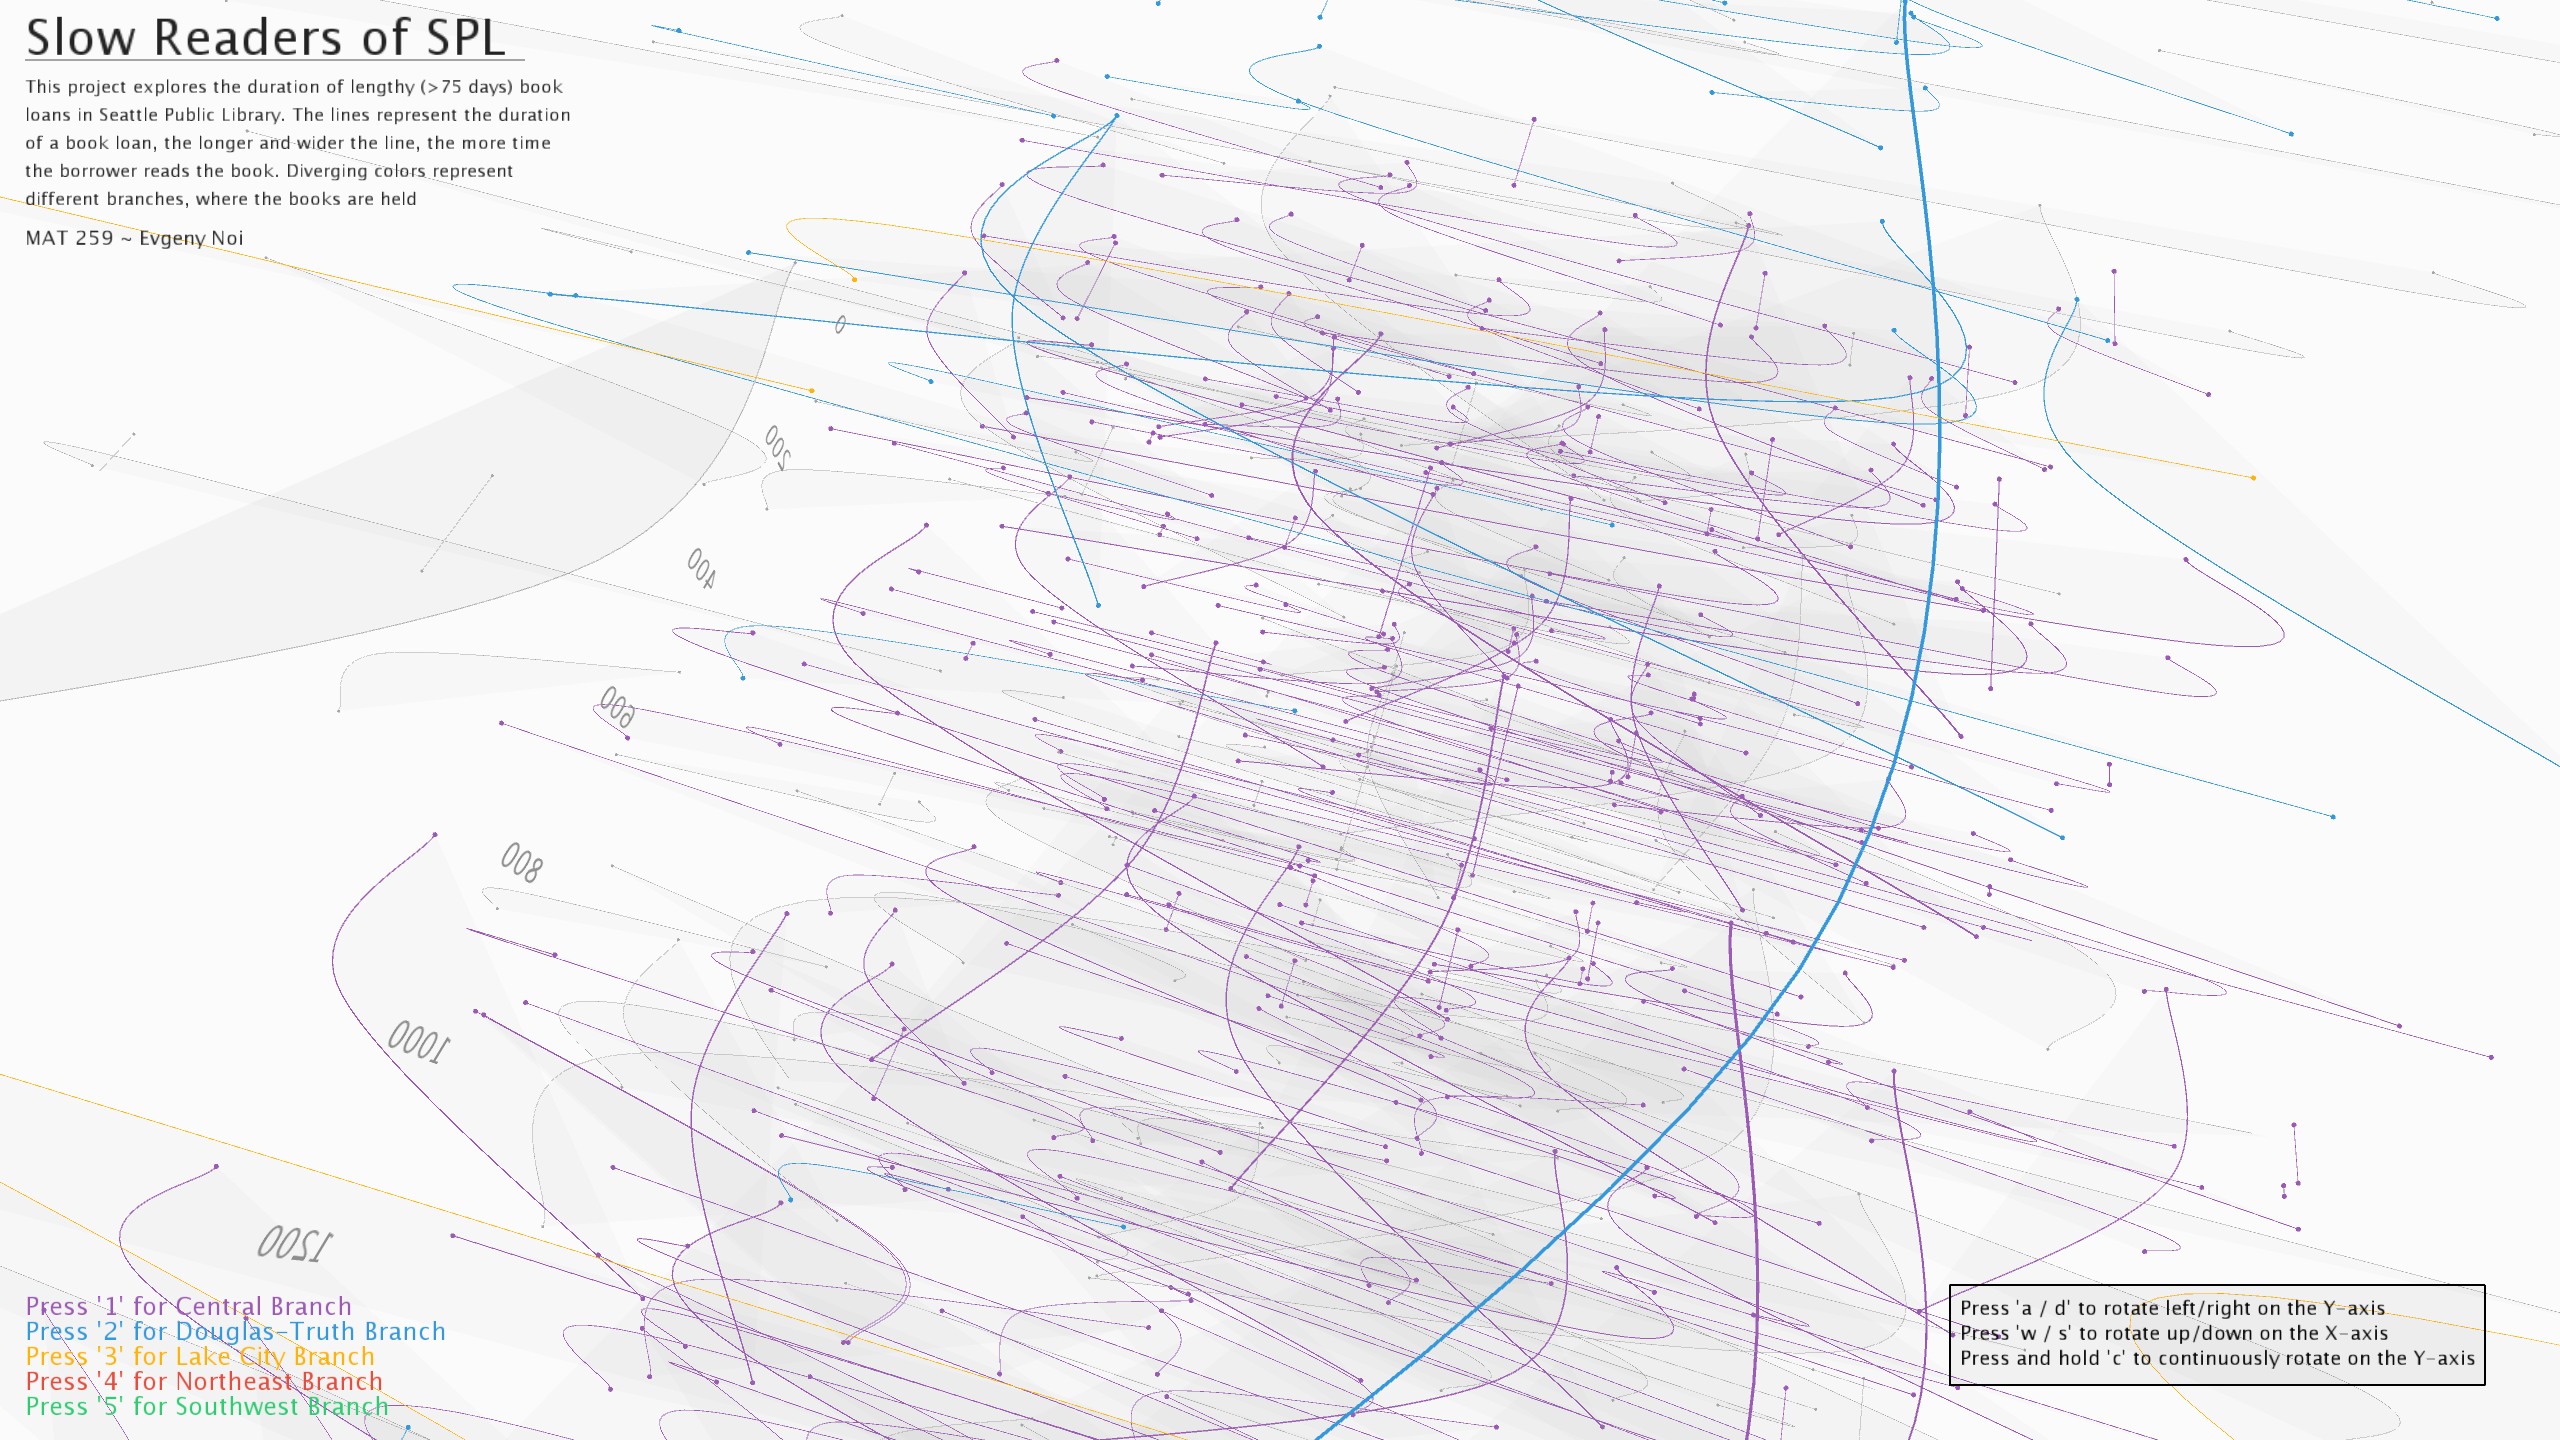
To identify the duration of the book loan, I calculated the difference between the check-in and check-out dates. The loan on a book is a continuous process, and as such, it is traditionally represented as a line. To locate the line on the axis in relation to other books (vertical (Y) axis), new scale of days from min(check-out) to max(check-in) was generated. While the mean duration of a book is 16 days, there are 48,000 transactions with an indicated loan period above mean. After generating several visualizations and in order to minimize cluttering on the canvas, the filtering duration threshold was set to 75.
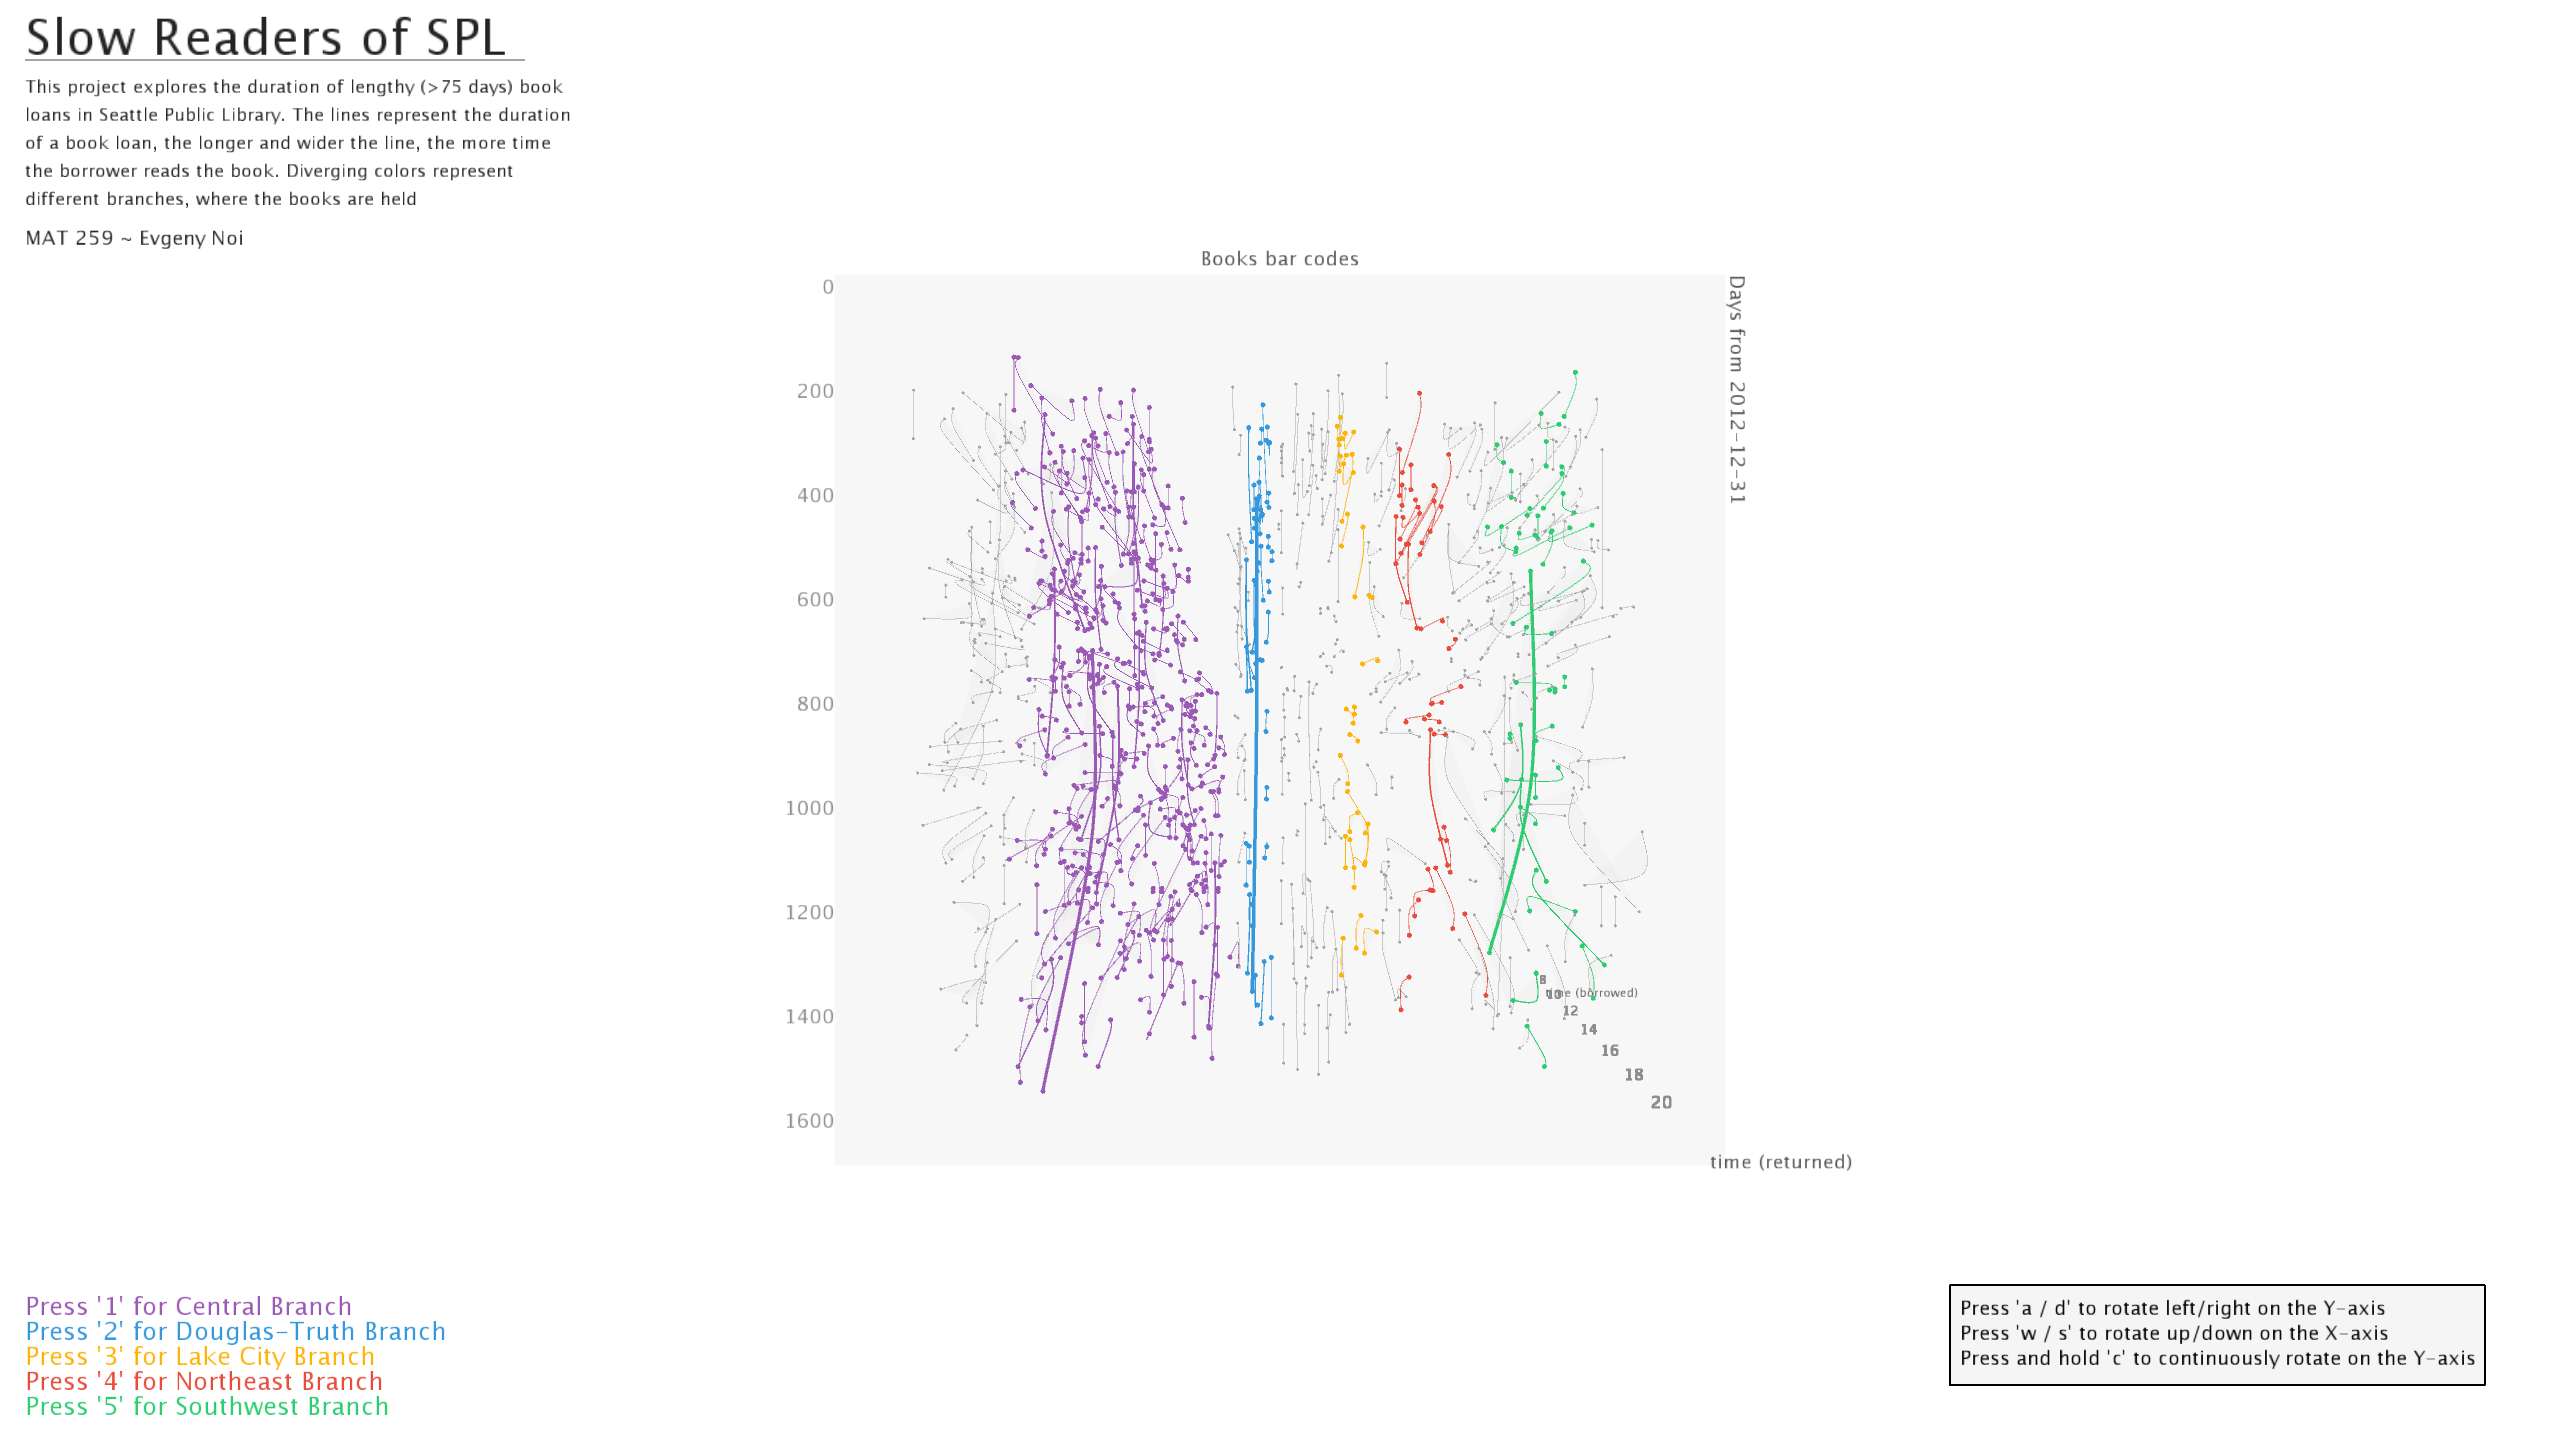
Finally, I decided to add time of day as a 3rd dimension of the visualization, with a minimum at the opening hour of the library and maximum at the closing time. In doing so, I decided to add the curvature and convert simple straight-line representations into curveVerteces (as per Processing terminology), where the degree of curvature depends on the middle point which was warped on the y-axis (see code in project folder for further details). In the last step, I added points at the start and end of a book loan to better differentiate the duration.
I do not have 'work-in-progress' documentation for this visualization. Suffice to say there were many errors and debugging.

                # generate unique identifier as reordered version of barcodes
                dur5['ranker'] = dur5.barcode.rank(method='dense')
                print(dur5.ranker.max())
To identify the duration of the book loan, I calculated the difference between the check-in and check-out dates. The loan on a book is a continuous process, and as such, it is traditionally represented as a line. To locate the line on the axis in relation to other books (vertical (Y) axis), new scale of days from min(check-out) to max(check-in) was generated. While the mean duration of a book is 16 days, there are 48,000 transactions with an indicated loan period above mean. After generating several visualizations and in order to minimize cluttering on the canvas, the filtering duration threshold was set to 75.
Finally, I decided to add time of day as a 3rd dimension of the visualization, with a minimum at the opening hour of the library and maximum at the closing time. In doing so, I decided to add the curvature and convert simple straight-line representations into curveVerteces (as per Processing terminology), where the degree of curvature depends on the middle point which was warped on the y-axis (see code in project folder for further details). In the last step, I added points at the start and end of a book loan to better differentiate the duration.
I do not have 'work-in-progress' documentation for this visualization. Suffice to say there were many errors and debugging.
Final result
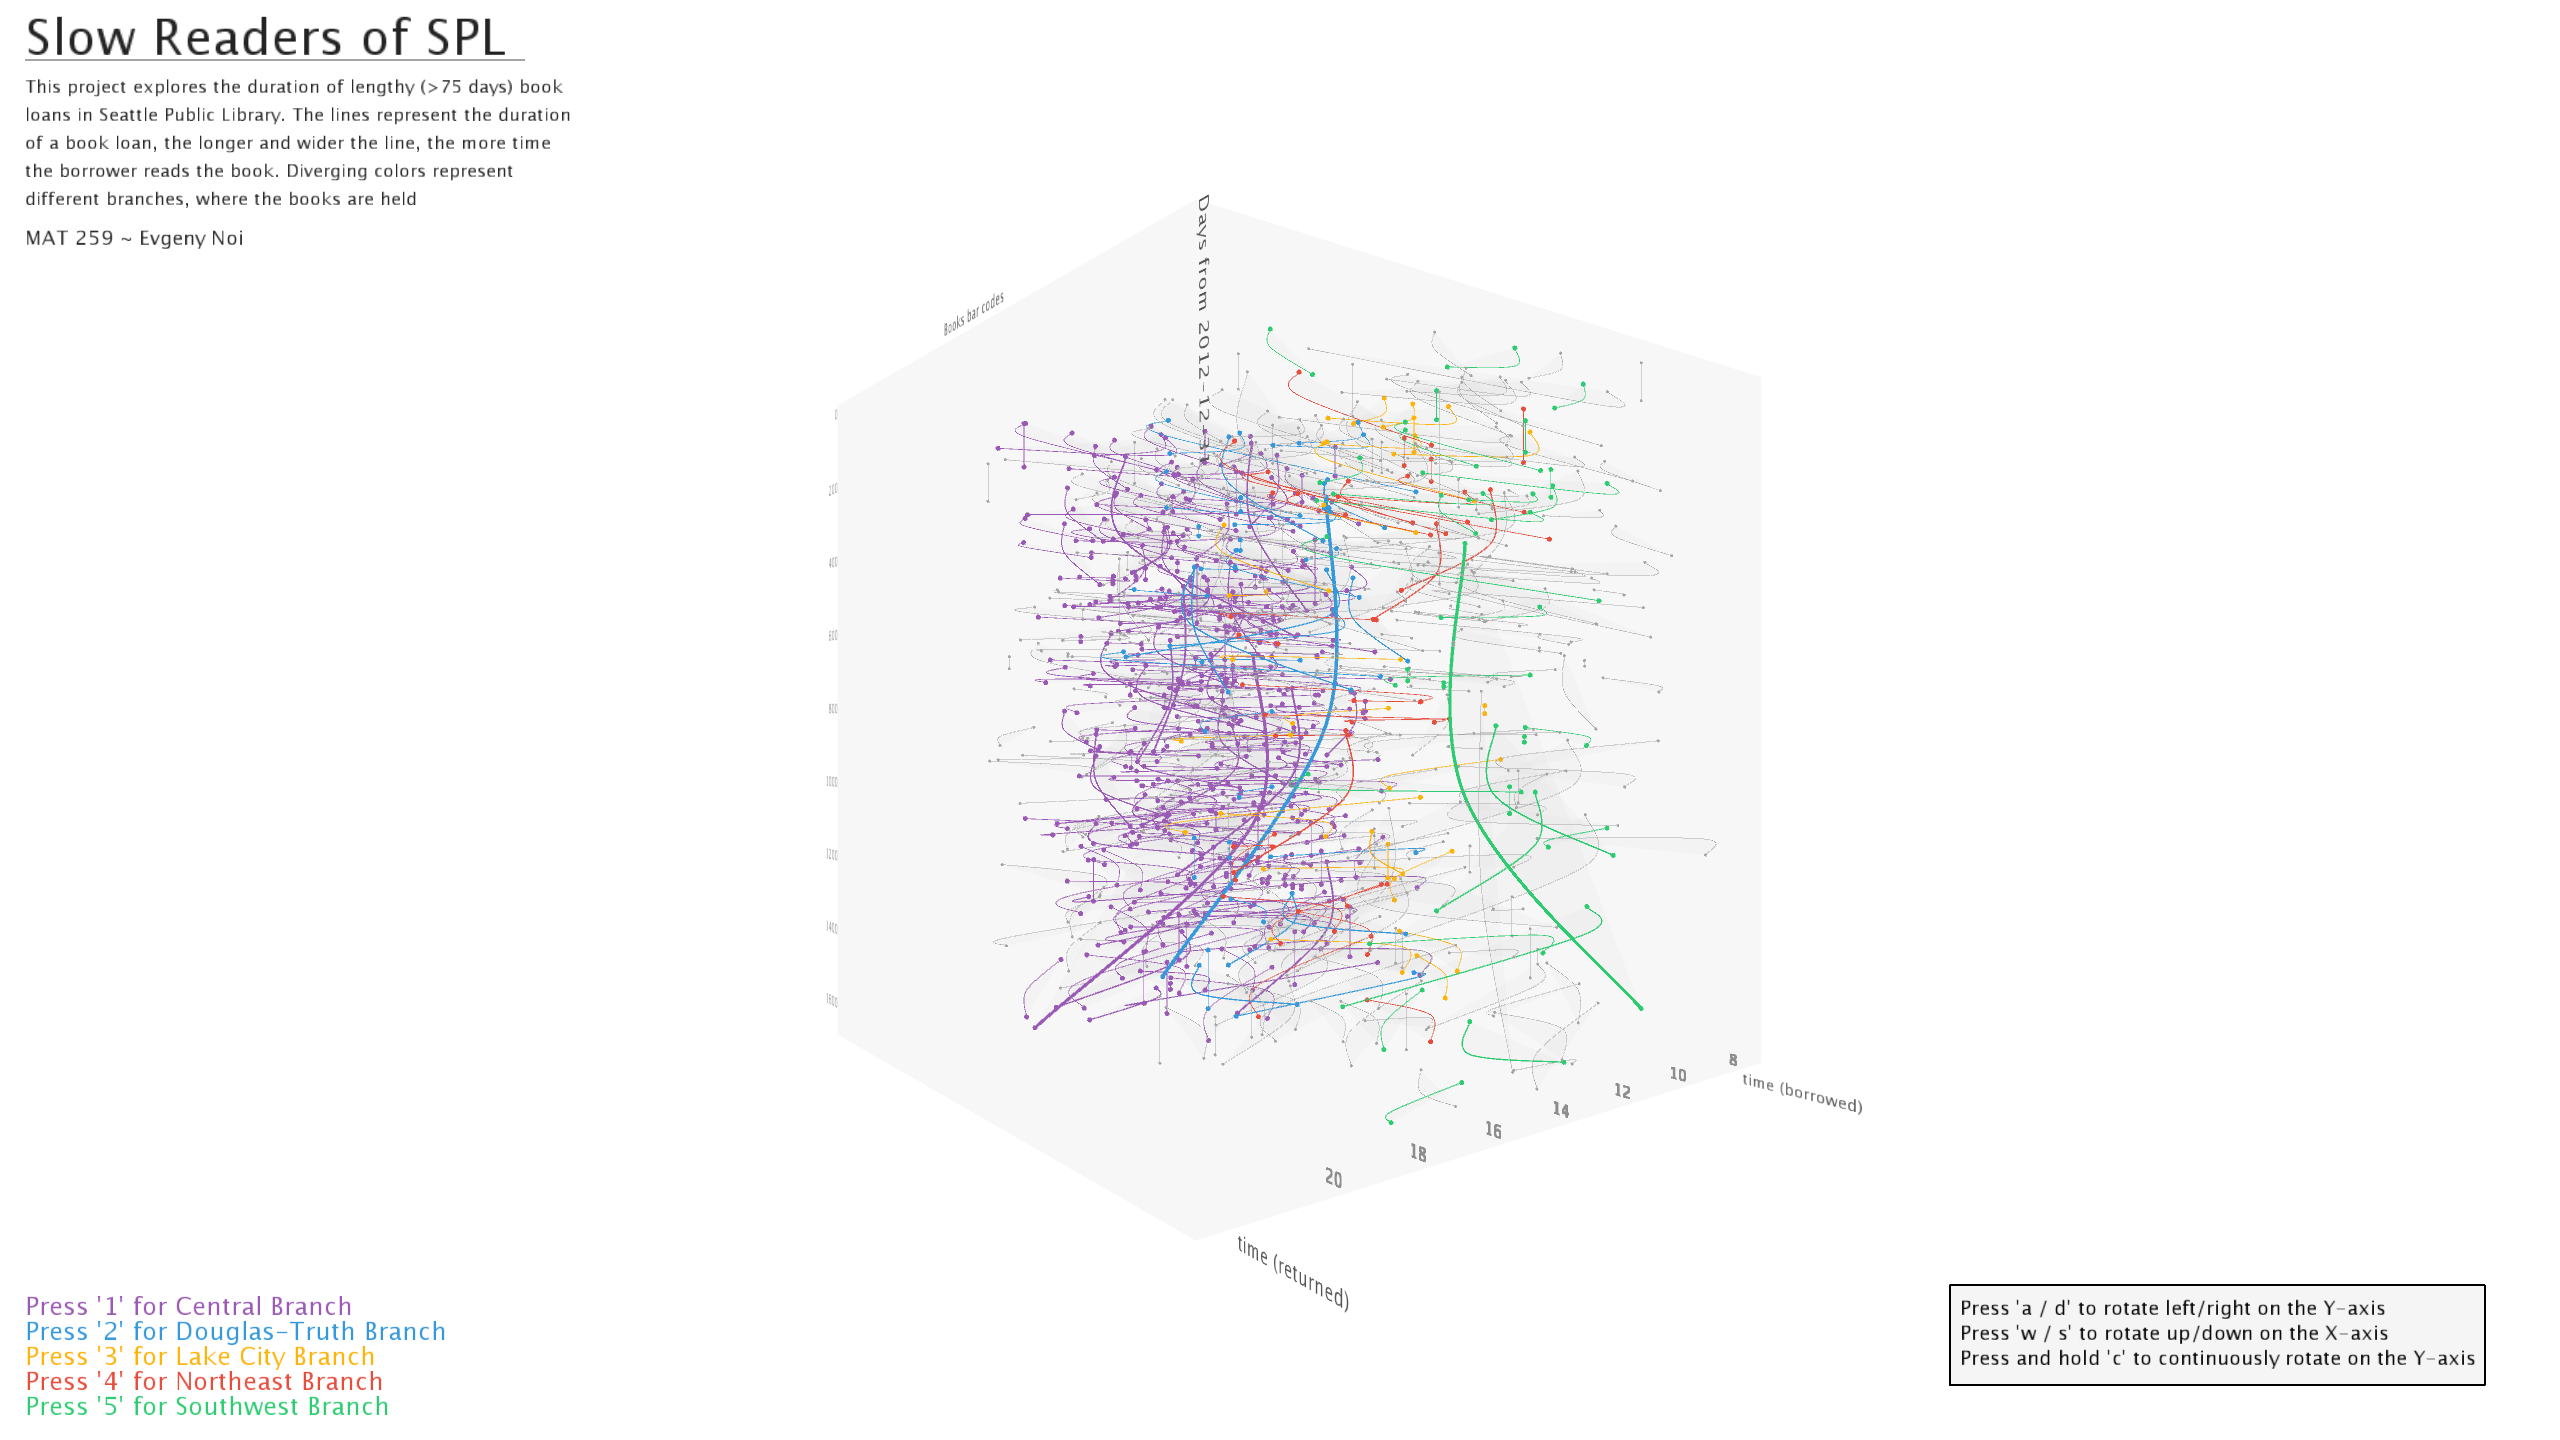
The whole creative process was more inductive in its manner. I was merely letting the inputs manifest
their structure in the visual forms of 3d cube, which provided a more easily navigable space for data
visualization and exploration. In the end, I tweaked a few things here and there, to accentuate certain
patterns in the data, but this was merely an exercise in developing my programming skills in
data visualization.
Various colors were used to denote five locations with most check-ins/outs: Central branch, Northeast branch, Southwest branch, Lake City branch, and Douglass-Truth branch. Each location was assigned a key-controller. Check-in from every other location was denoted in grey to not distract from the first five.
Various colors were used to denote five locations with most check-ins/outs: Central branch, Northeast branch, Southwest branch, Lake City branch, and Douglass-Truth branch. Each location was assigned a key-controller. Check-in from every other location was denoted in grey to not distract from the first five.
Code