Predictions of Numbers of Checkouts in Seattle Public Library
MAT 259, 2020
Guanyu Chen
Concept
The primary interest of this project is forecasting monthly amounts of dewey books using historical data. The dataset used here, which contain 168-month chekc-out records for different sectors from January 2006 to December 2019, is provided by Seattle Public Library database and are alll time-correlated. It is possible for us to summary statistics and graphical representations of check-out records and conduct further predictions.
Query
SELECT
YEAR(cout) AS Years,
MONTH(cout) AS Months,
SUM(CASE
WHEN deweyClass != '' THEN 1
ELSE 0
END) AS Dewey
FROM
spl_2016.outraw
WHERE
itemtype LIKE '%bk'
AND YEAR(cout) >= '2006'
AND YEAR(cout) <= '2019'
GROUP BY YEAR(cout) , MONTH(cout);
SELECT
YEAR(cout) AS Years,
MONTH(cout) AS Months,
SUM(CASE
WHEN deweyClass > 000 AND deweyClass < 100 THEN 1
ELSE 0
END) AS D000_099,
SUM(CASE
WHEN deweyClass > 100 AND deweyClass < 200 THEN 1
ELSE 0
END) AS D100_199,
SUM(CASE
WHEN deweyClass > 200 AND deweyClass < 300 THEN 1
ELSE 0
END) AS D200_299,
SUM(CASE
WHEN deweyClass > 300 AND deweyClass < 400 THEN 1
ELSE 0
END) AS D300_399,
SUM(CASE
WHEN deweyClass > 400 AND deweyClass < 500 THEN 1
ELSE 0
END) AS D400_499,
SUM(CASE
WHEN deweyClass > 500 AND deweyClass < 600 THEN 1
ELSE 0
END) AS D500_599,
SUM(CASE
WHEN deweyClass > 600 AND deweyClass < 700 THEN 1
ELSE 0
END) AS D600_699,
SUM(CASE
WHEN deweyClass > 700 AND deweyClass < 800 THEN 1
ELSE 0
END) AS D700_799,
SUM(CASE
WHEN deweyClass > 800 AND deweyClass < 900 THEN 1
ELSE 0
END) AS D800_899,
SUM(CASE
WHEN deweyClass > 900 AND deweyClass < 1000 THEN 1
ELSE 0
END) AS D900_999
FROM
spl_2016.outraw
WHERE
itemtype LIKE '%bk'
AND YEAR(cout) >= '2006'
AND YEAR(cout) <= '2019'
GROUP BY YEAR(cout) , MONTH(cout);
Preliminary sketches
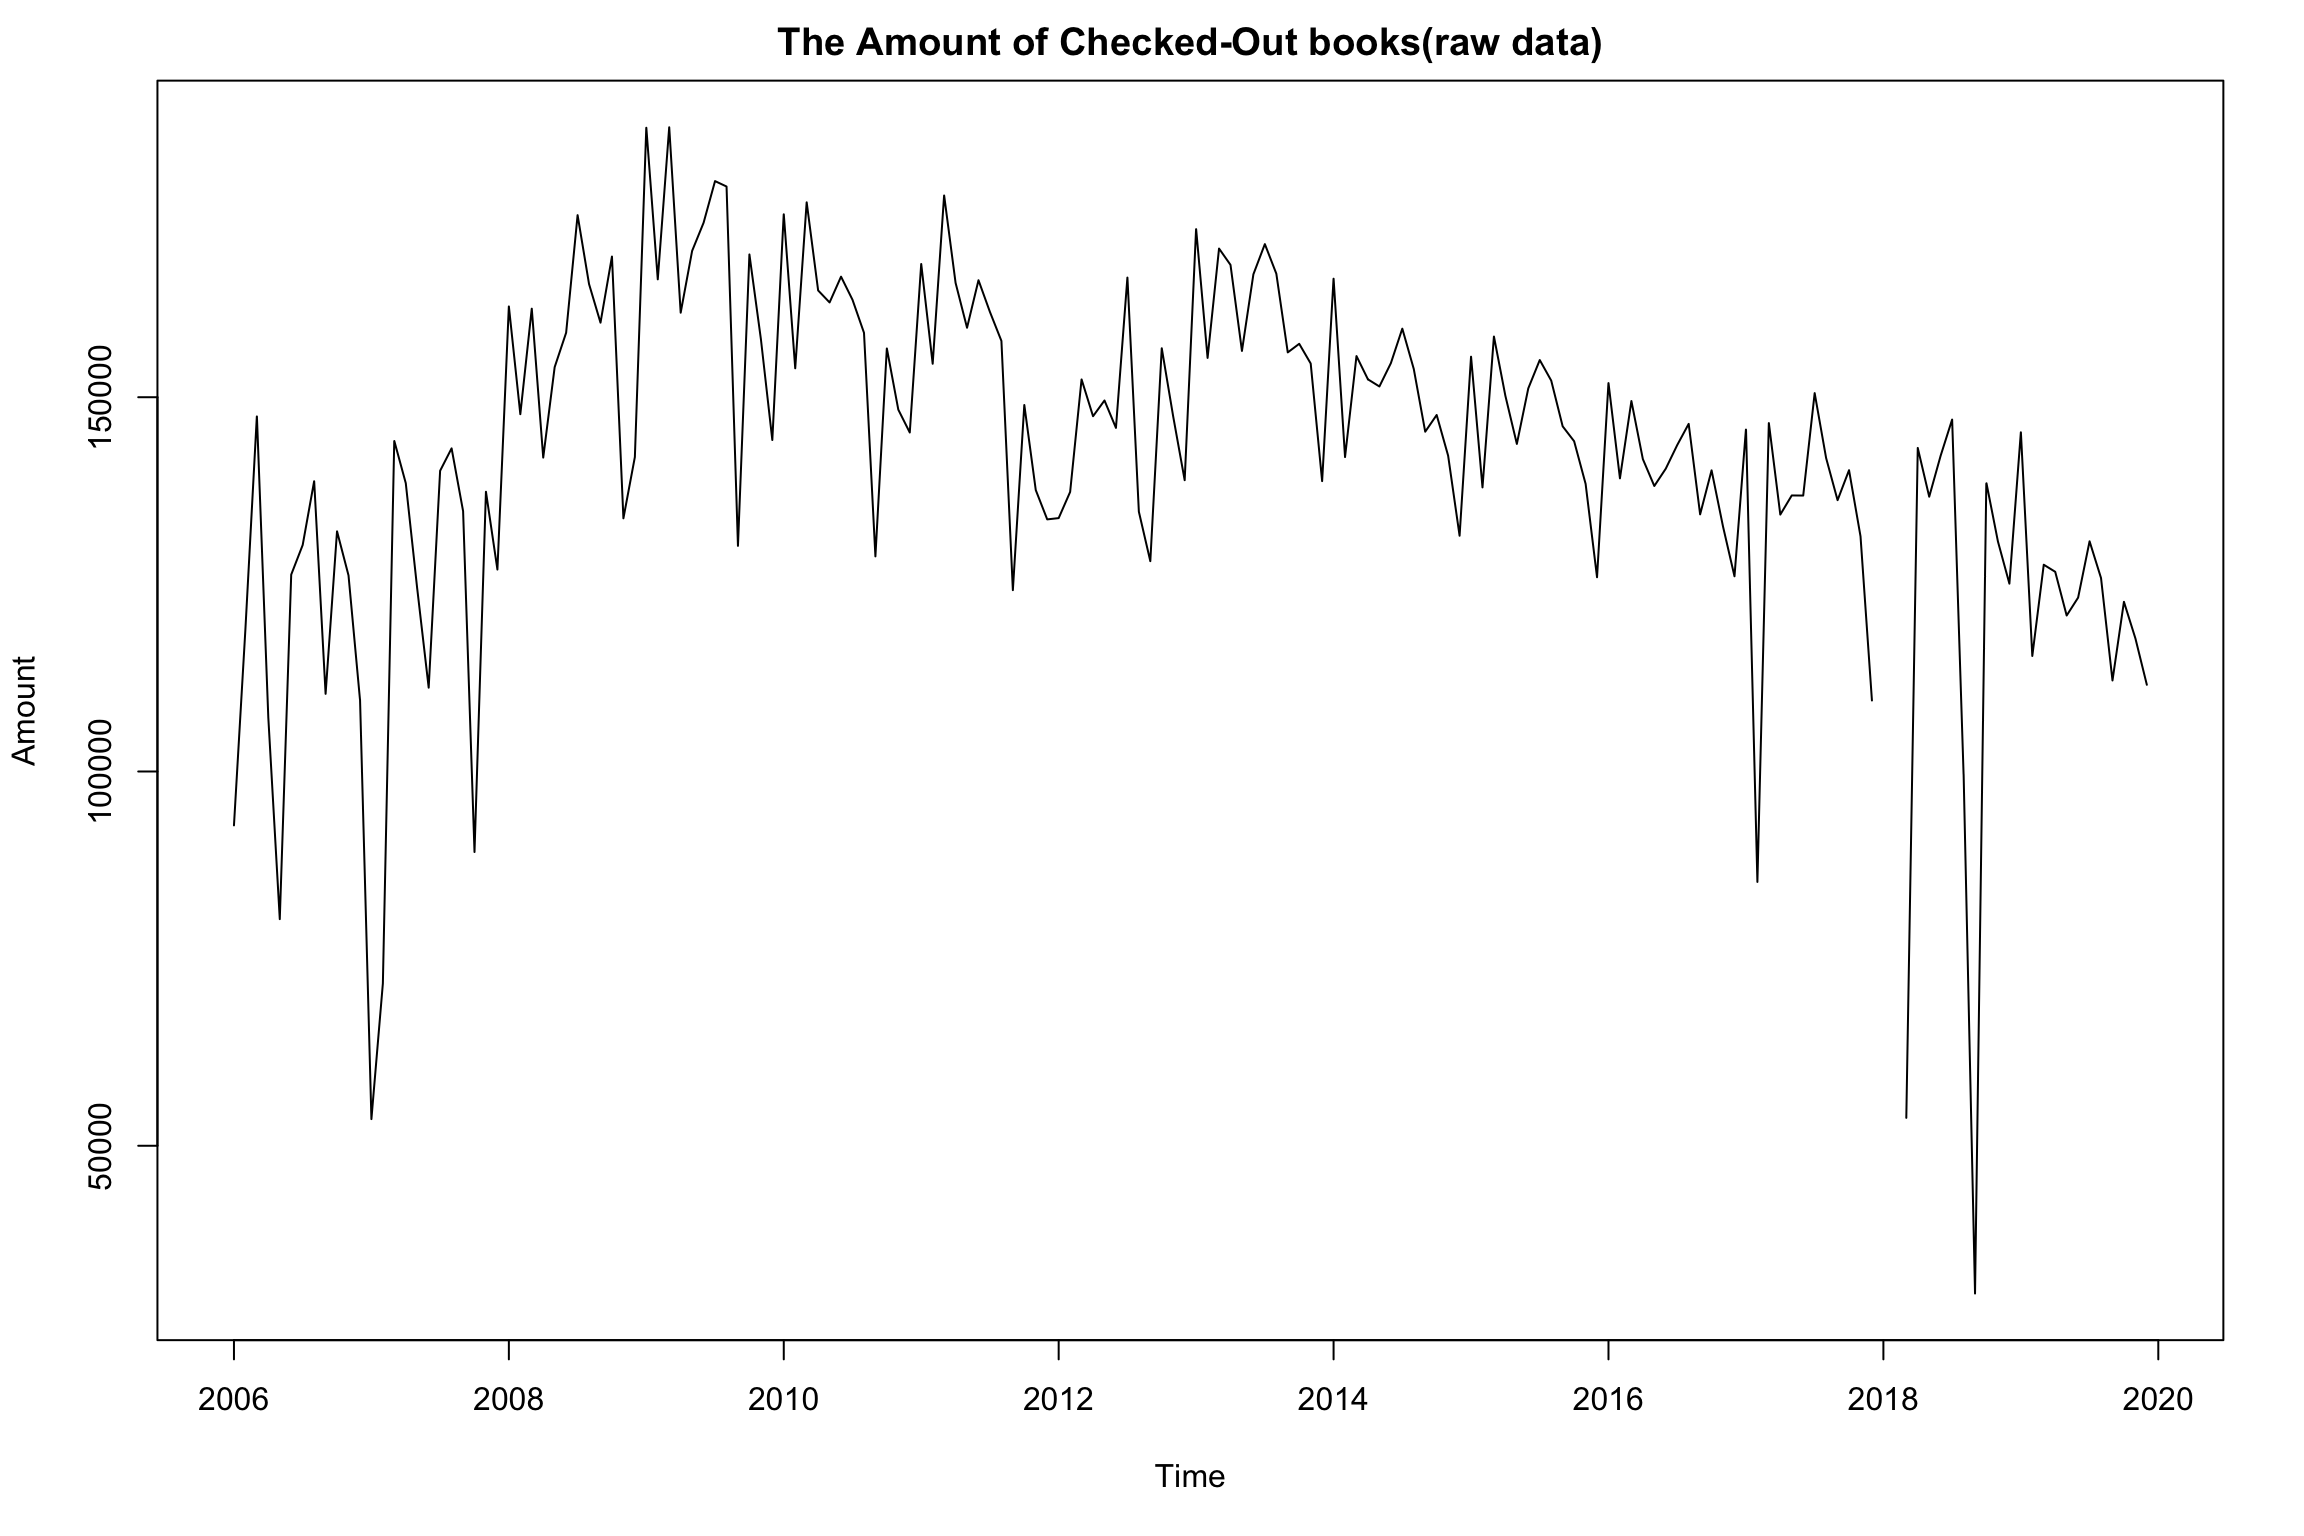
We can easily check that numbers of checkout books in Seattle Public Library increased from 2006 to 2009 and decrease from 2010 to 2020. The fluctuations of numbers of checkout between each year look kinds of similar, which indicates similar yearly or monthly variance over time. It is possible to decompose time-series data into three components to investigate more information of data.
For the decline of numbers of books' checkouts, a main supposed reason is that with more mature of digital reading and free online-books, readers did not have to borrow books from libraries.
Also, when checking numbers of checkouts in different dewey classes, we find that each checkouts kept similar volumes in each year and there was a hugh drop in 2018.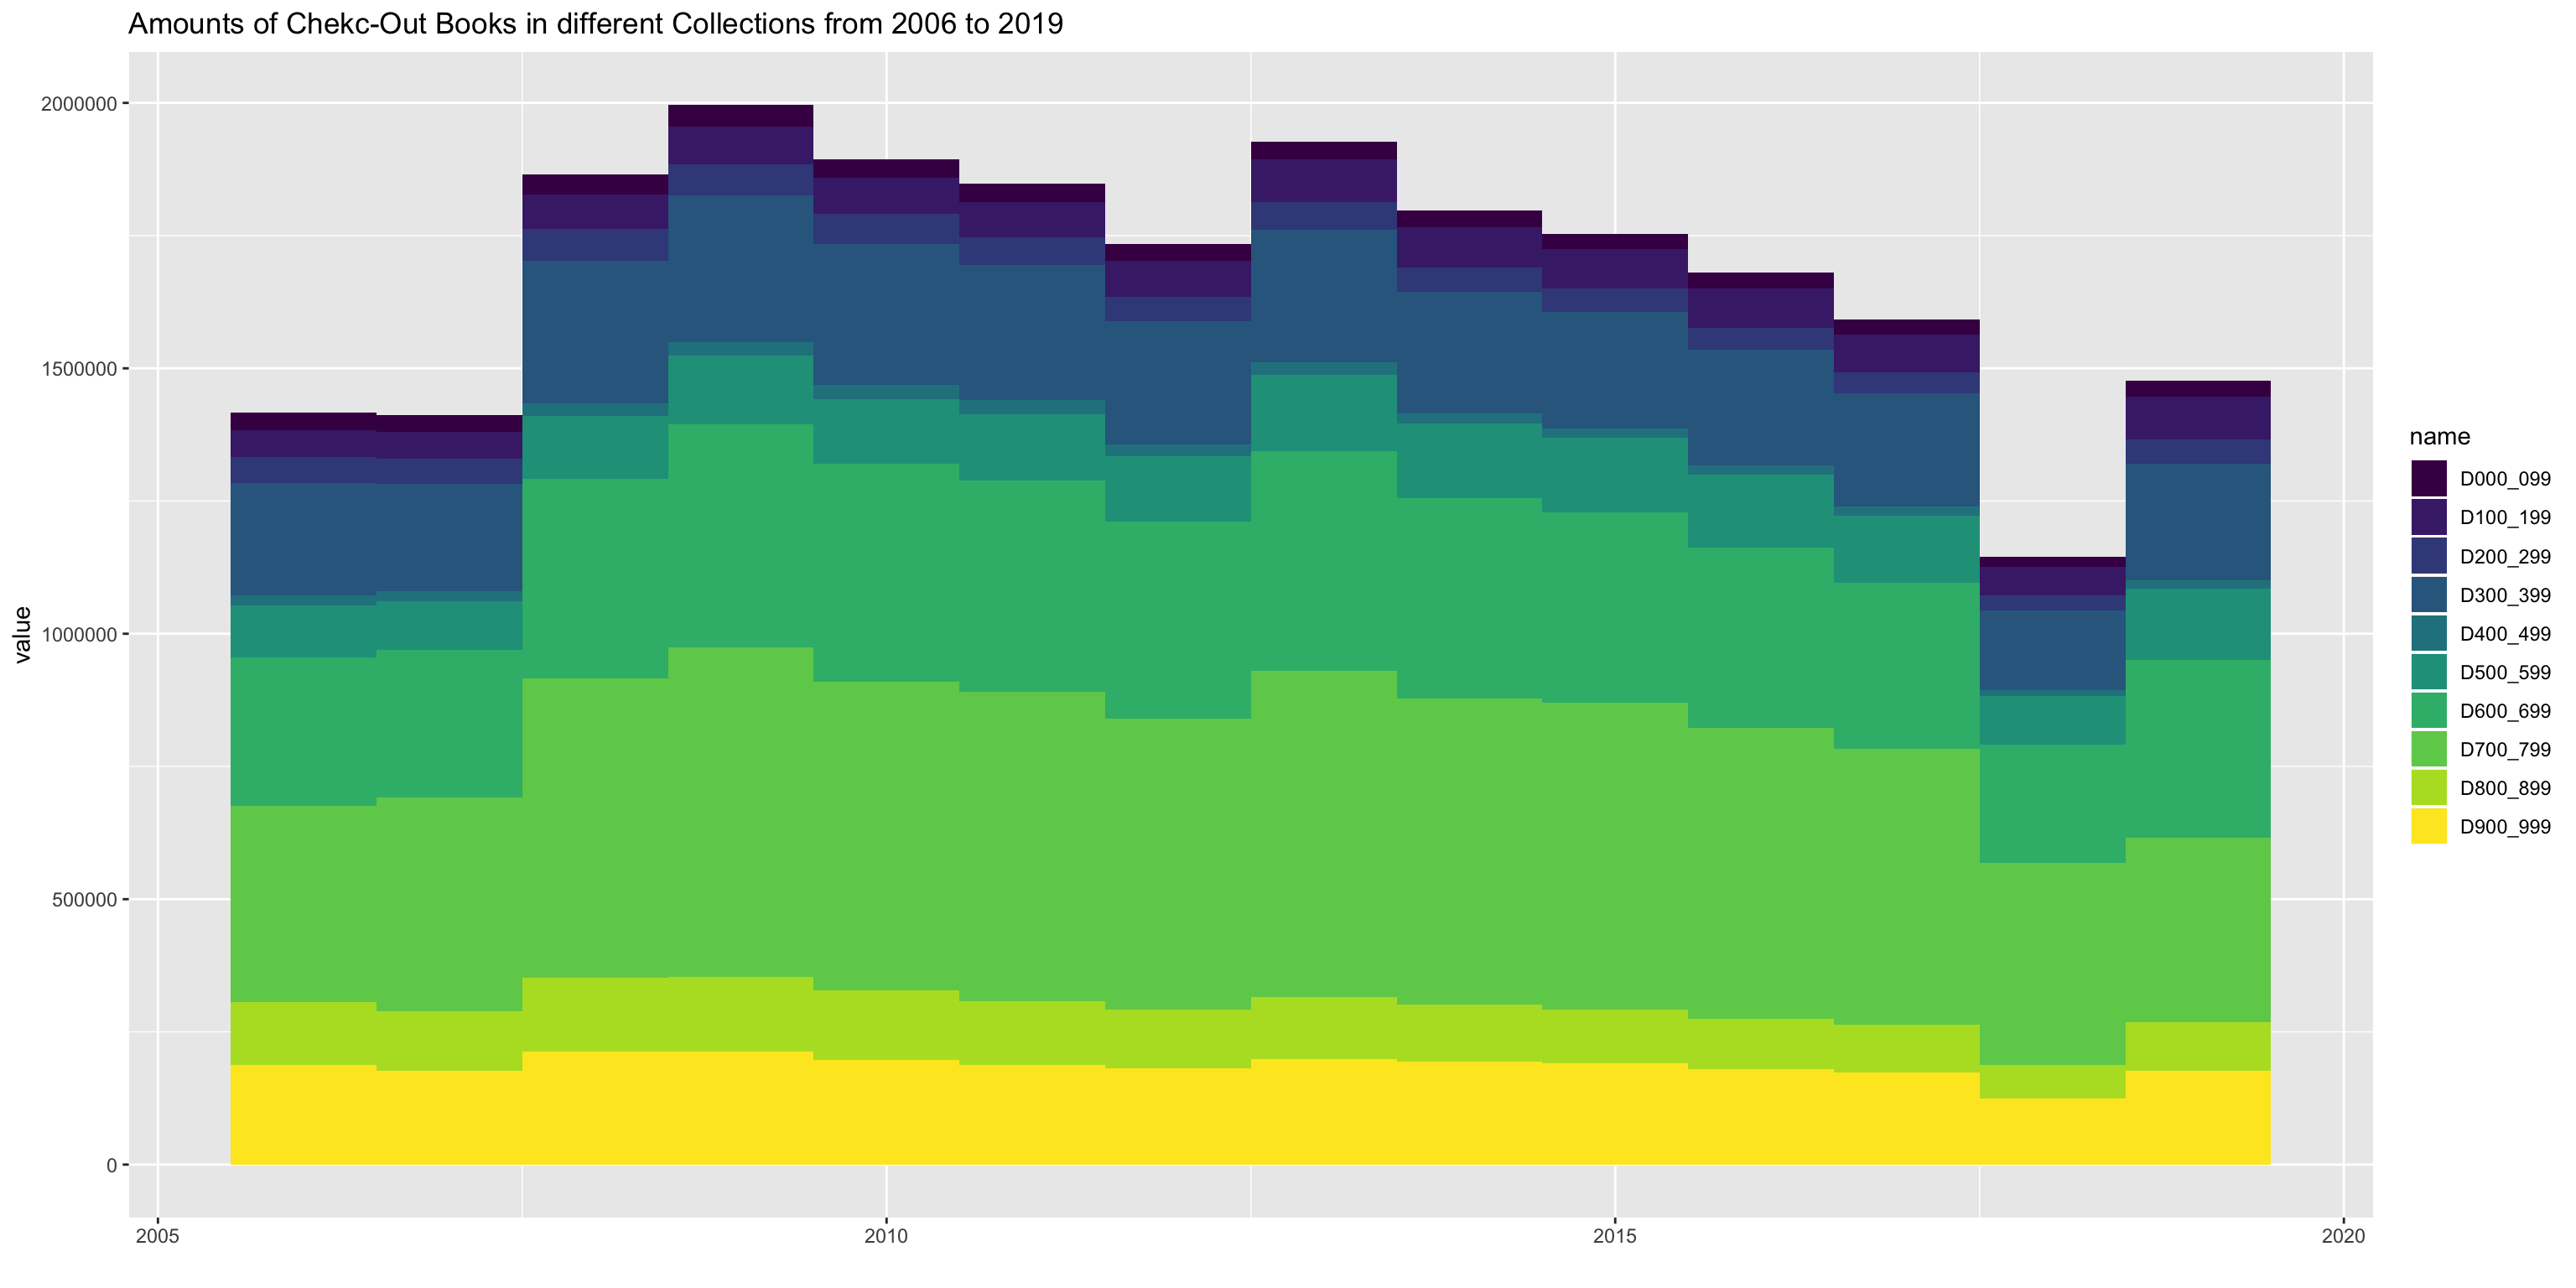
Process
Difficulties
In reality, a collection of data is not always perfect for data analysis. Before starting data analysis, it is necessay to detect some errors, anomalies or hidden patterns. Two main technical problems are:
- Missing Data: The dataset contain missing data in January 2018 and February 2018.
- Abnormal Data: In 2018, the amount of check-out books are extremly lower than previous year.
Methods
Due to missing data, in order to recognize long-term data pattern, I recollected all periodic data in system for analysis.
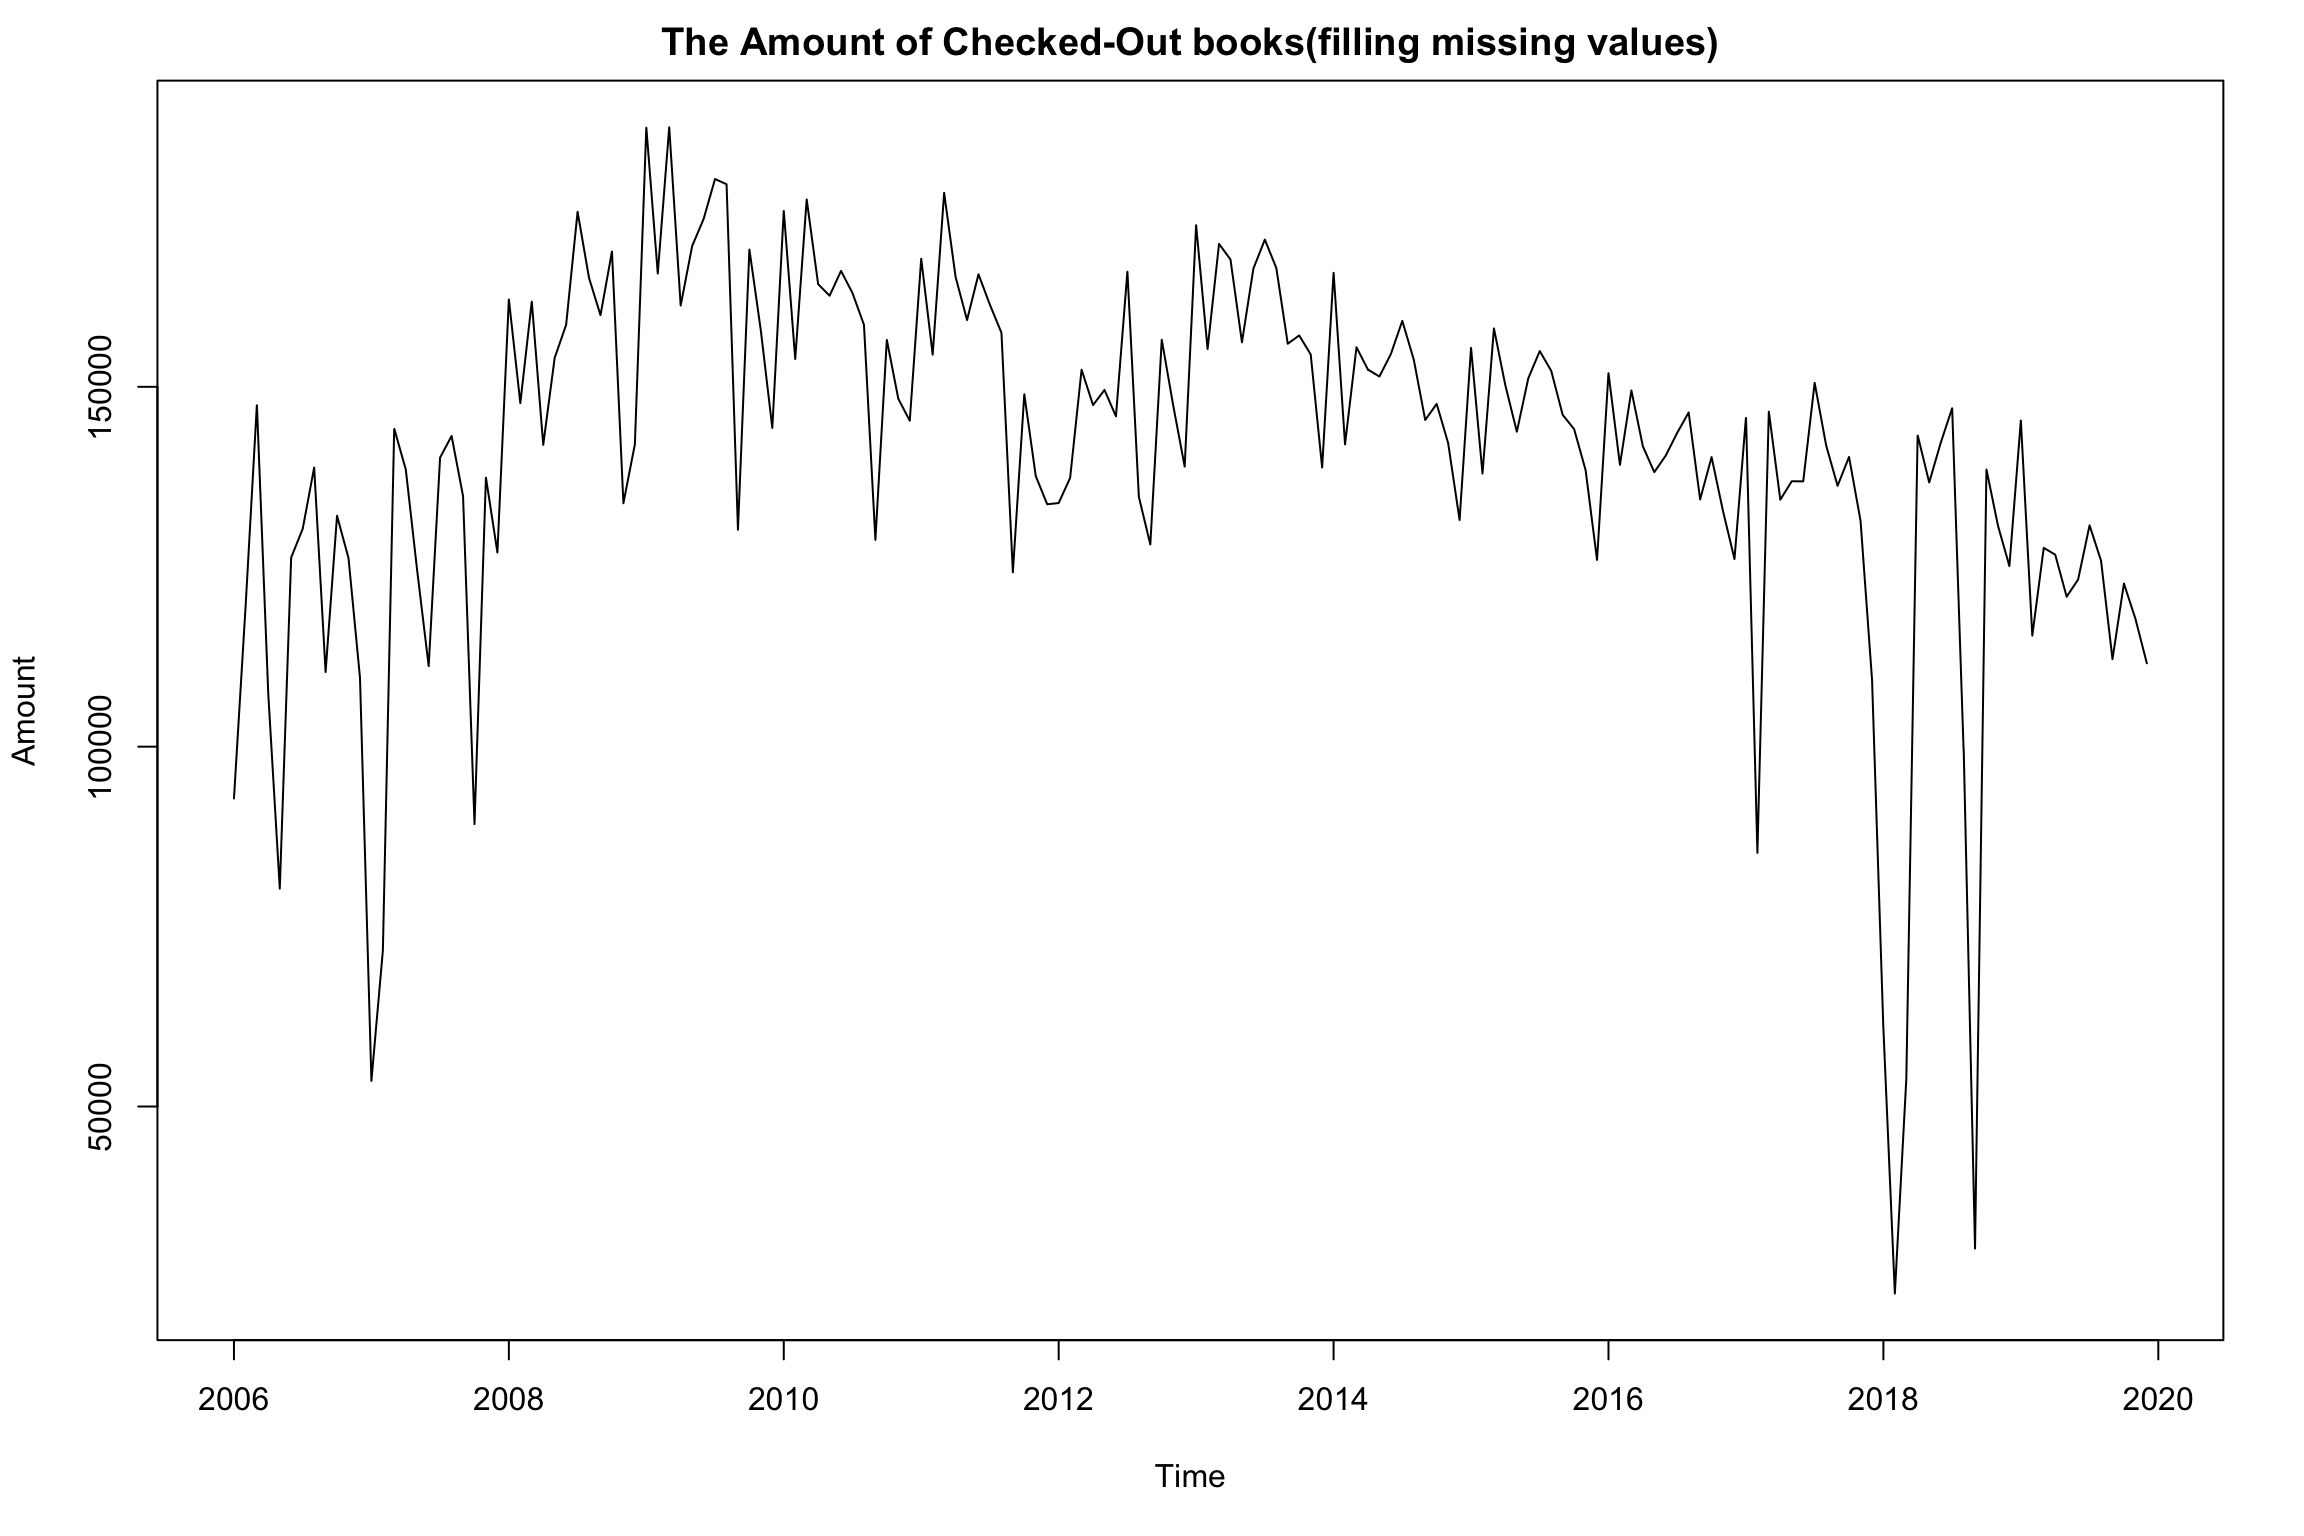
For missing values, applying interpolation method is one of way to solve the problem. Interpolation is used to extrapolate the missing data within the range of discrete set of known data points. The simplest way of interpolation is the linear interpolation that it can fillin a new value by the mean of twoadjacent known values.
The data filled with estimated values is shown below:
Final result
Modeling
For statistical building model, ARIMA model is applied in data anlysis. The predicted amounts and 95% confidence region are plotted below. The predicted pattern looks close to historical patterns. It is noteworthy that the shape of confidence band widen with increasing horizon, which reflects longer term forecast has more uncertainty. This might also be a sign of need of a more stable model.
Predictions and Plotfor 2020 are shown below:
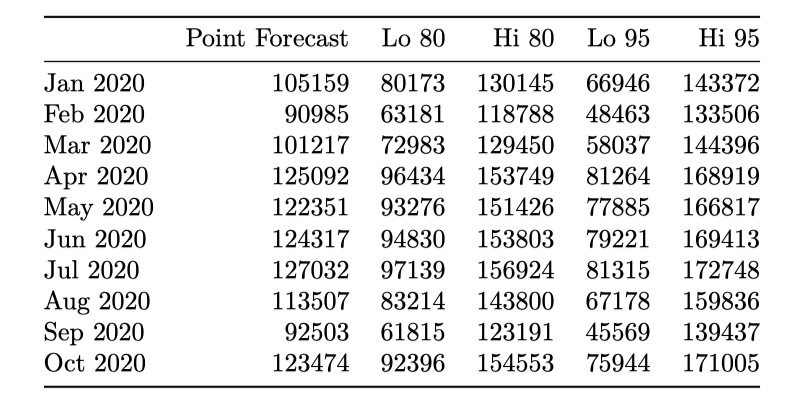
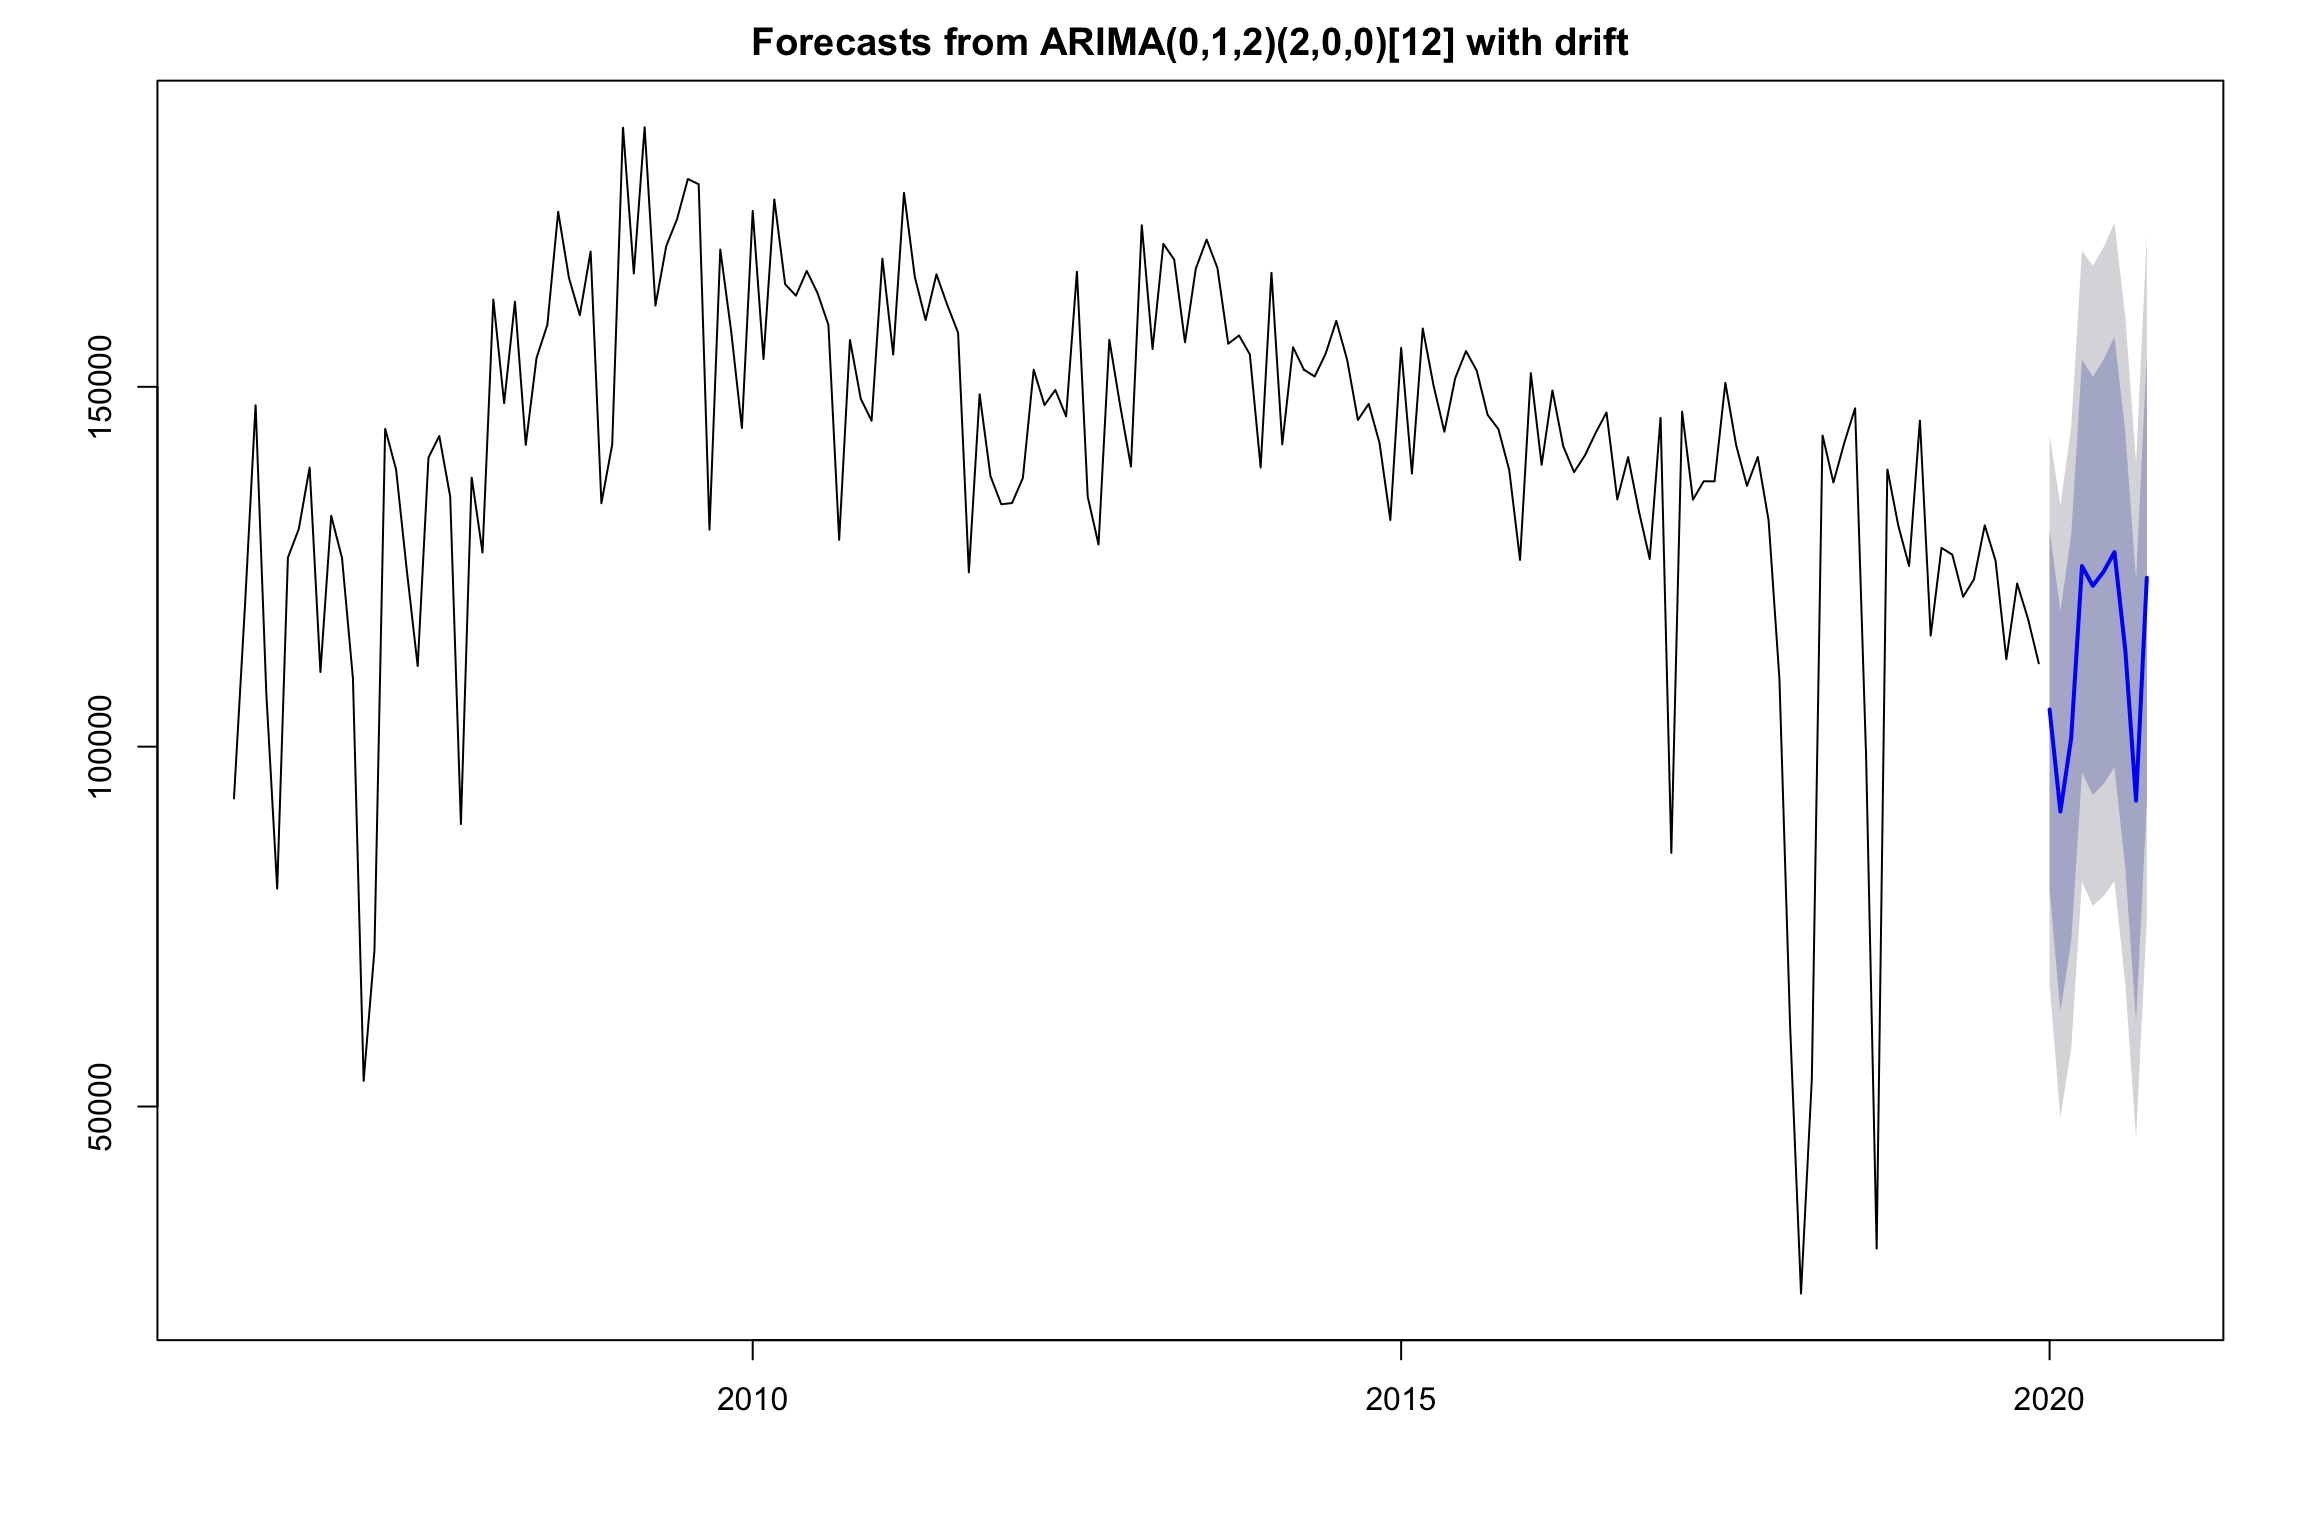
The grey regions stands for confidence prediction bounds that measure varition of predictions' values. If future numbers of checkouts fall into certain grey region, that means our prediction is statistical reliable in some ways.
Code