Regional Cat Composites
MAT 259, 2018
Wilson Mui
Concept
The idea for this project was to create a visualisation that could display the variety of common housecats found throughout California. I was hoping that if there were some cats that were more prominent in some regions, it could be easily spotted here.
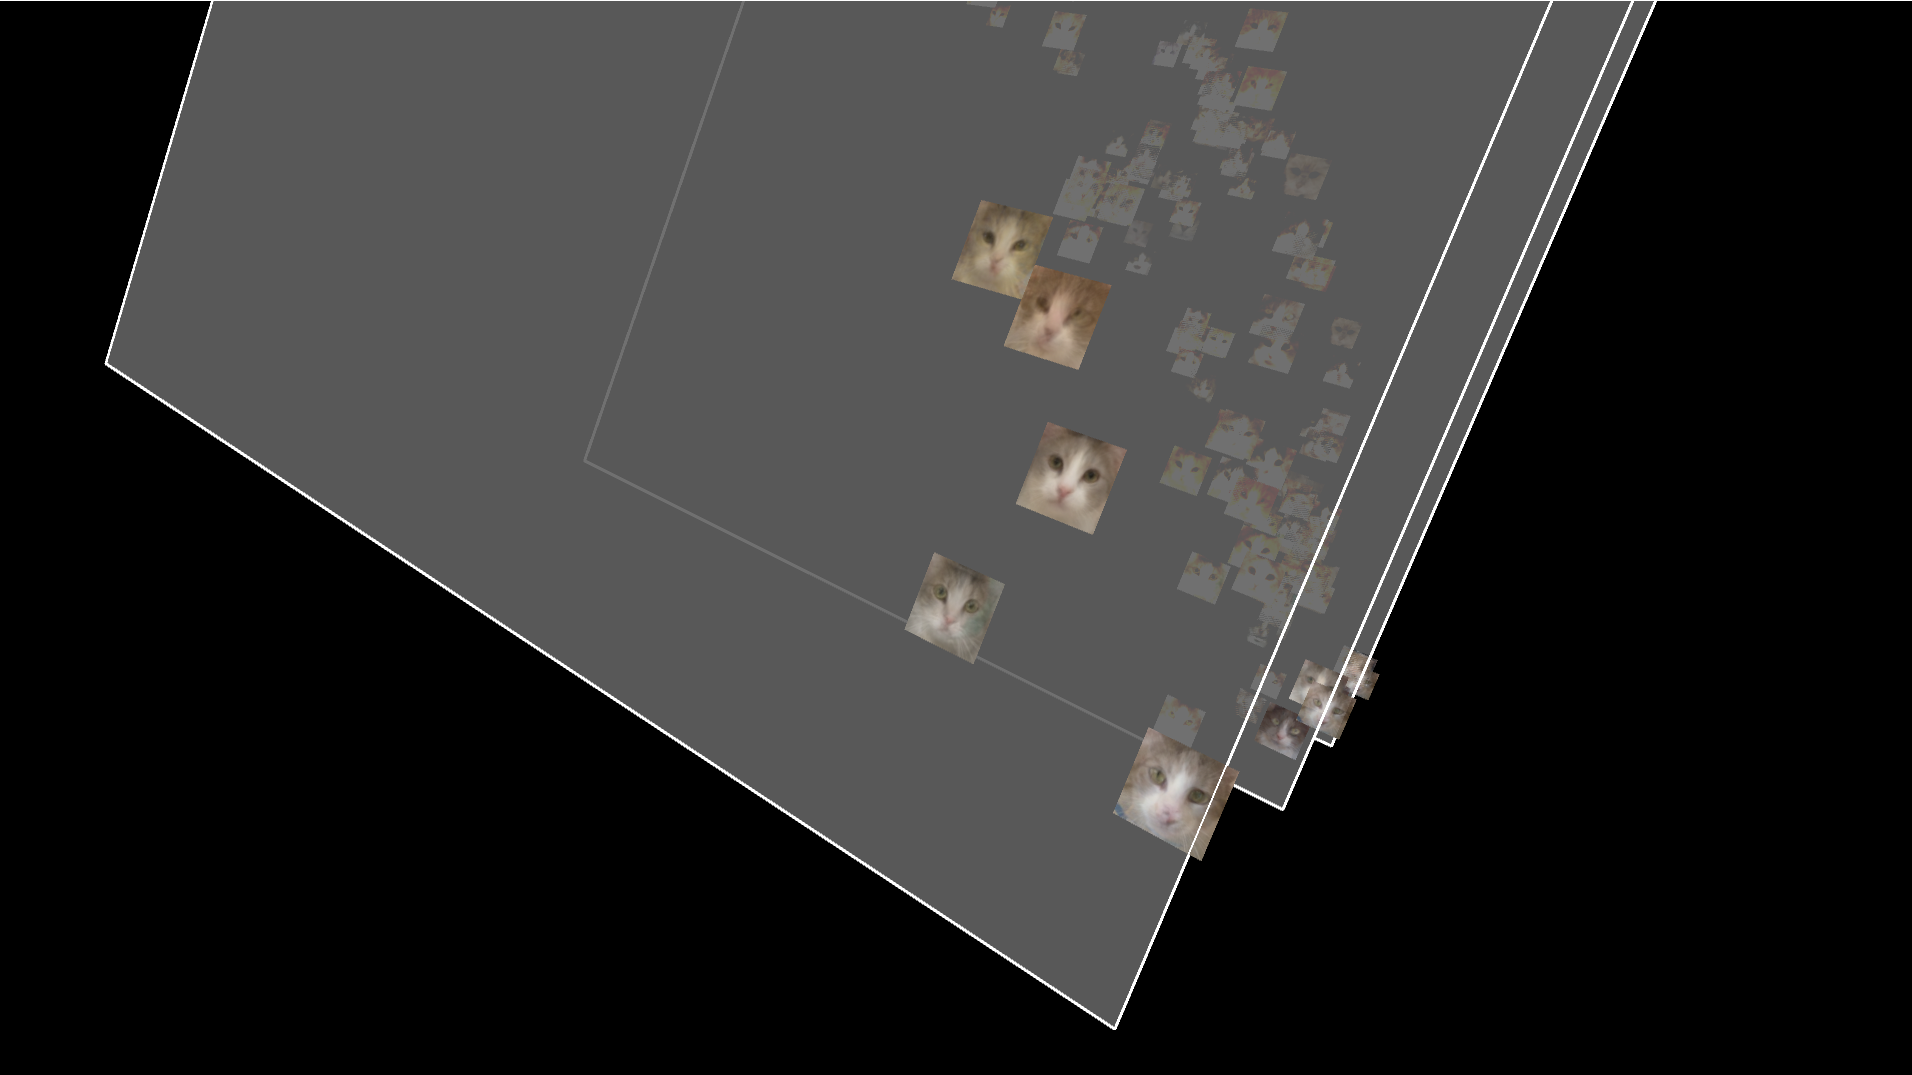
The cats are merged to create an idea of what the average cat for the area would look like. K-means clustering is also used to group up the cats based on location and density. This method of clustering would help group up areas that were closer. Hopefully, it would group cats that appeared more similar as well.
As the layers move up, the amount of clusters is further divided and the cats are grouped up even more. The topmost layer is a composite of all the cats found.
Python was used to fetch each image using Petfinder API. OpenCV was used with Python to process the images and make them more usable. The faces are extracted to prevent merging other features together.
Query
http://api.petfinder.com/pet.find?key=2ab2dc4c94bdedf48a0fc33fd67616d2&animal=cat&location=93117&format=json
Process
Cat images are retrieved with the PetFinder API and then their faces are found and cropped out with OpenCV.
Final result
The shape resembles California because cats were retrieved from centers throughout the state. Similarities between the cats may be quite apparent.

Code