On the Health of America's Counties
MAT 259, 2019
Sarah Wells
Concept
I explored the relationships between health data and expected life expectancy in the US by county. I use health data from 2015 on a variety of factors as well as life expectancy from the CDC calculated on data from 2010-2015. For each county in the data set, I use Kohonen self-organizing for dimensional reduction on selected health factors determining coordinates for the x and y dimensions. Life expectancy then determines the z position and scale from red to green indicating poor and good life expectancy. I allow you to select factors to display and organize, you can also rerun the algorithm with currently selected factors.
Data
County Health Rankings from: http://www.countyhealthrankings.org/explore-health-rankings/rankings-data-documentation/national-data-documentation-2010-2016
2015 County Health Rankings Data - v3.xls
County Life Expectancy from: https://www.cdc.gov/nchs/nvss/usaleep/usaleep.html#life-expectancy
Calculated from years 2010-2015:
Life_Expectancy.csv
Final results and analysis
Screenshots and Analysis:
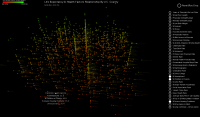
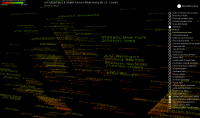
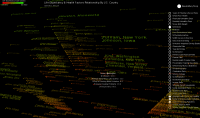
Screenshot 1: Shows organization based on % Unemployment, % Children in Poverty, % Severe Housing Problems. This also shows the ability to hover over to display the County, State, selected factors, and life expectancy.
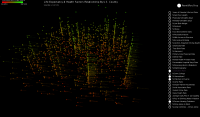
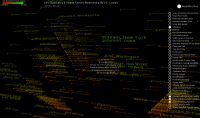
Screenshot 2: Keeping the data trained using % Unemployment, % Children in Poverty, % Severe Housing Problems, we additionally select Graduation Rate. This reorganizes the data using the additional Graduation Rate factor. The similarity in overall shape indicates not much difference between this and using only the initial three factors. One can infer a positive relationship between these factors.
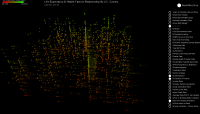
Screenshot 3: Similar to screenshot 2, we keep the data trained from % Unemployment, % Children in Poverty, % Severe Housing Problems and add % Smokers. We see the data becomes a little more chaotic, this may mean a slightly weaker relationship between % Smokers and the first three factors than between Graduation Rate and those factors.
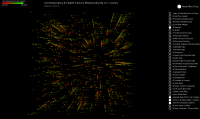
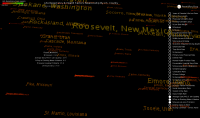
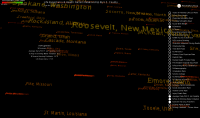
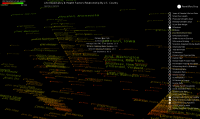
Screenshot 4: I choose some environment/physical factors, this screen displays the overall organization. (% Smokers, Average Daily PM2.5 Air Quality, % Pop in Drinking Water Violation, % Severe Housing Problems),
Screenshots 5-7: Using the above factor choices. I identify a clump of similar x-y coordinates indicating similar environmental/physical factors and similar low life expectancy. Hovering over a few, we see respective values for % Smokers, Average Daily PM2.5 Air Quality, % Pop in Drinking Water Violation, % Severe Housing Problems, Life Expectancy:
Russell, Kennedy: 31.0, 13.4, 0.0, 15.0, 73.9
Grayson, Kentucky: 29.0, 13.8, 0.0, 15.0, 74.1
Starke, Indiana: 33.0, 13.2, 0.0, 16.0, 74.6
We might conclude these high number of smokers, poor air quality, and housing problems, indicate low life expectancy.
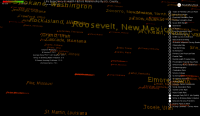
Screenshots 8-11:
Using the same factor choices, again. I identify a clump of similar x-y coordinates indicating similar environmental/physical factors and high similar life expectancy. Hovering over a few, we see respective values for % Smokers, Average Daily PM2.5 Air Quality, % Pop in Drinking Water Violation, % Severe Housing Problems, Life Expectancy:
Chelan, Washington: 13.0, 11.2, 0.0, 16.0, 80.1
Columbia, New York: 14.0, 11.0, 0.0, 16.0, 80.9
Putnam, New York: 10.0, 10.9, 0.0, 20.0, 81.8
We might conclude these much lower number of smokers than the above sample contribute to higher life expectancy.
Additional analysis: In implementing SOM, I found efficiency to be a very limiting factors. One reason the program takes so long is to allow for variety in the spatial locations data can be sorted into (nodes), the more nodes the longer the for-loop in the algorithm. This was a difficulty particularly since I wanted to be able to interact with the visualization, the algorithm needs to be rerun every time a new factors is selected or removed. I capped the iterations at 25 since through trial and error I found the data to be reasonably sorted at this point and found it took a reasonable waiting period.
Code