What Do Americans Like to Cook?
MAT 259, 2019
Chantal Nguyen
Concept
I'm interested in visualizing what people are interested in cooking by exploring online recipe databases and extracting information related to the user rating and popularity of recipes.
Query
I obtained the data from this page, where I was referred to from here. I specifically used the "epicurious-recipes.json" file, which contains recipes taken from Epicurious, a popular website that publishes their own recipes as well as those from American food magazines and cookbooks. Users can also post their own recipes, but the website maintains a largely curated experience.
The data is in JSON format and contains, for each recipe, the title, description, ingredients, instructions, rating out of 5, number of reviews, and % of reviewers who said they would make the recipe again, among other information.
I used tf-idf to vectorize the recipes' ingredient lists, SVD as a preliminary dimensionality reduction step to reduce the data to 50 dimensions (otherwise t-SNE alone would be extremely intensive), and t-SNE to further reduce dimensionality to 2D.
I also performed a k-means clustering on the tf-idf vectors to cluster the recipes into 15 clusters.
Process
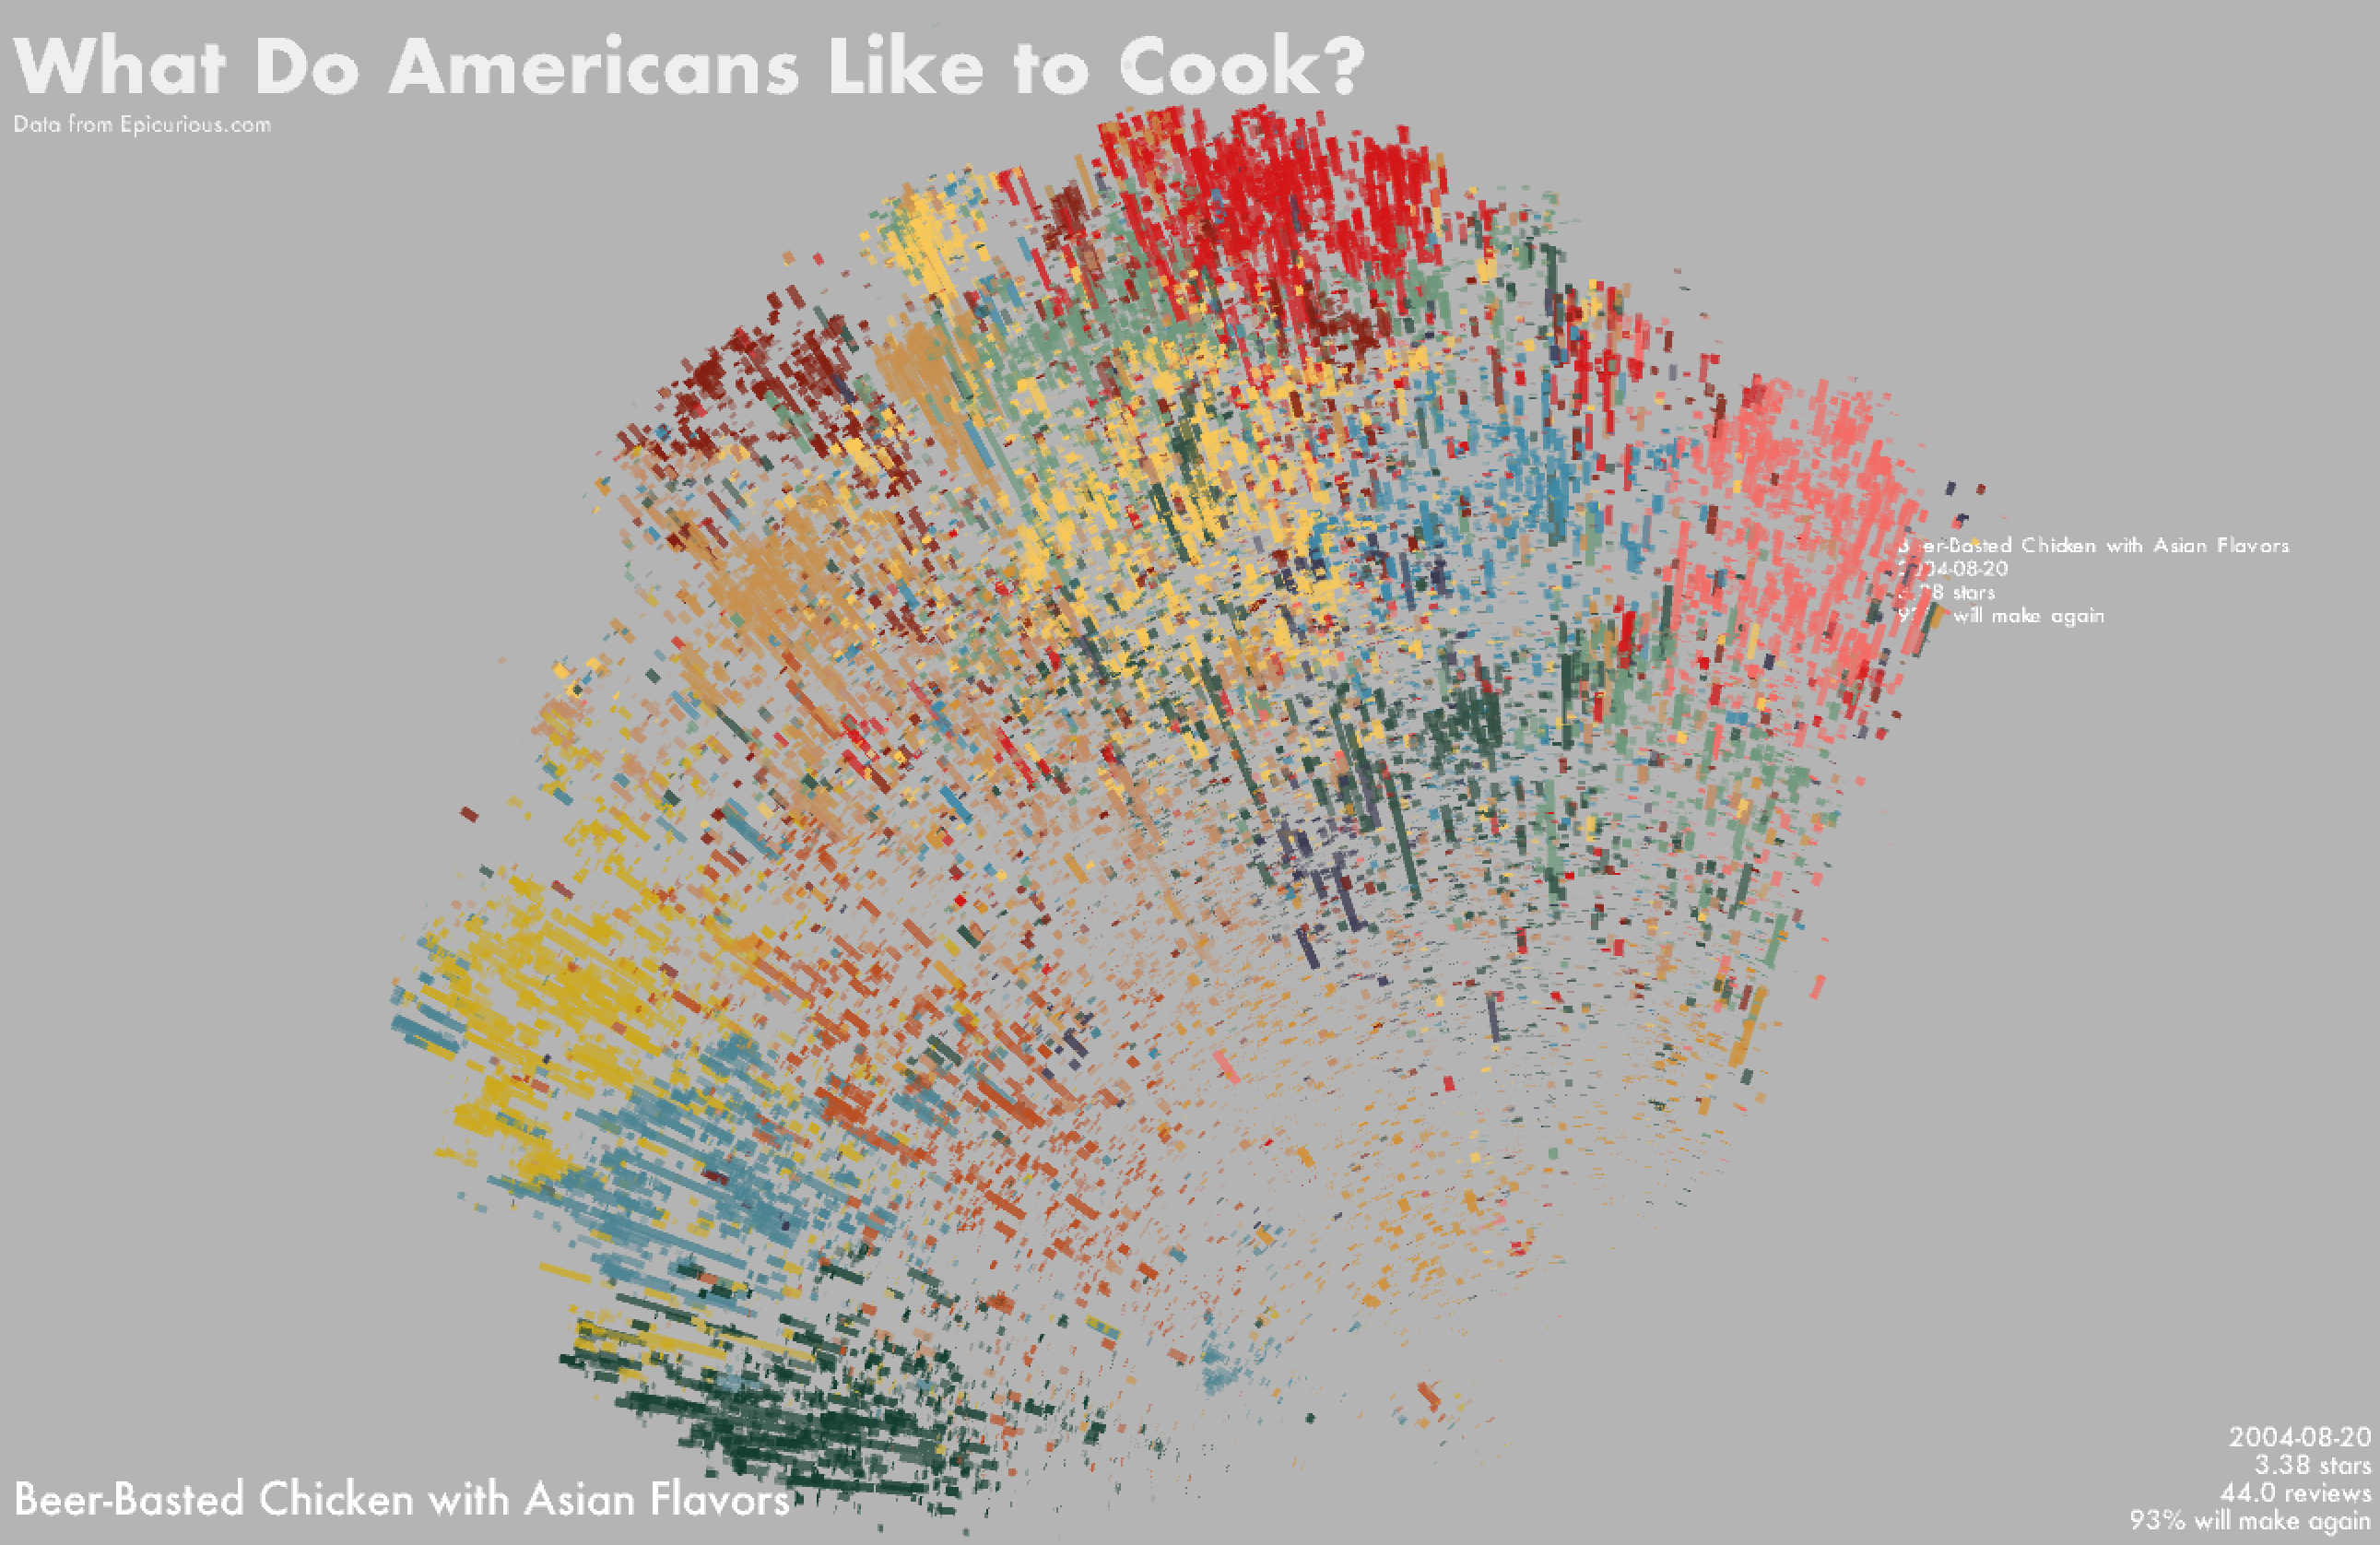
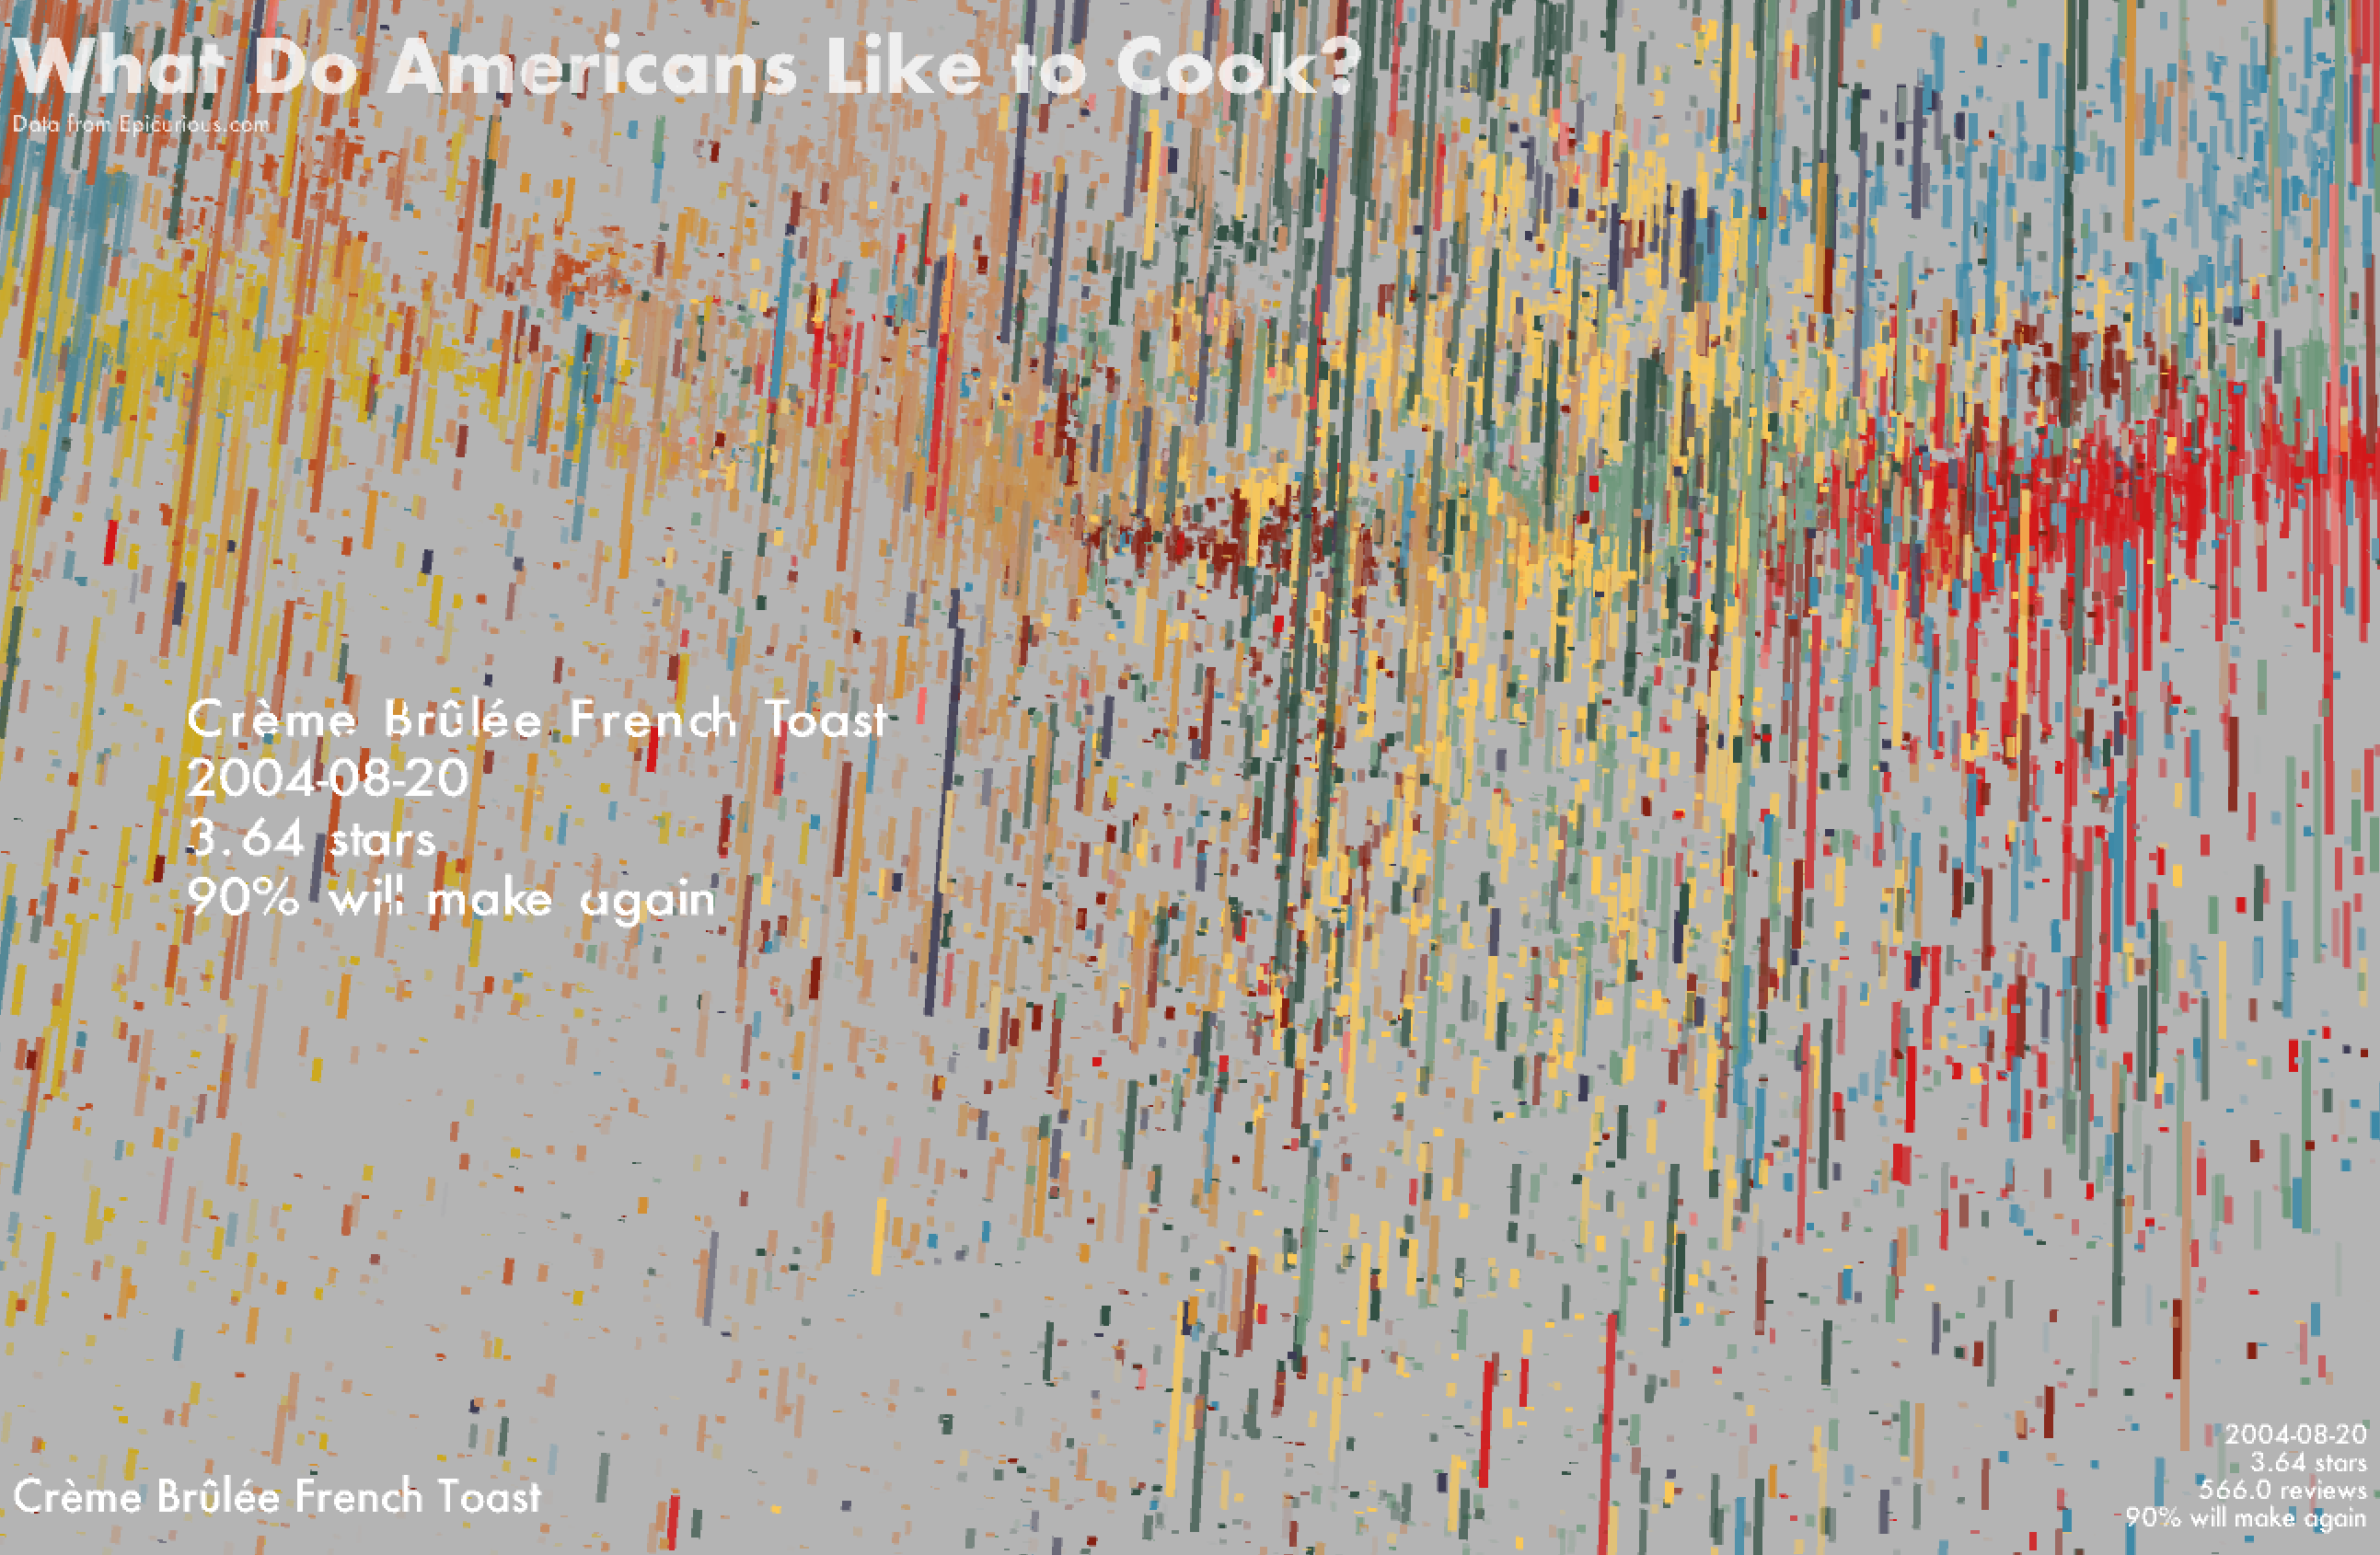
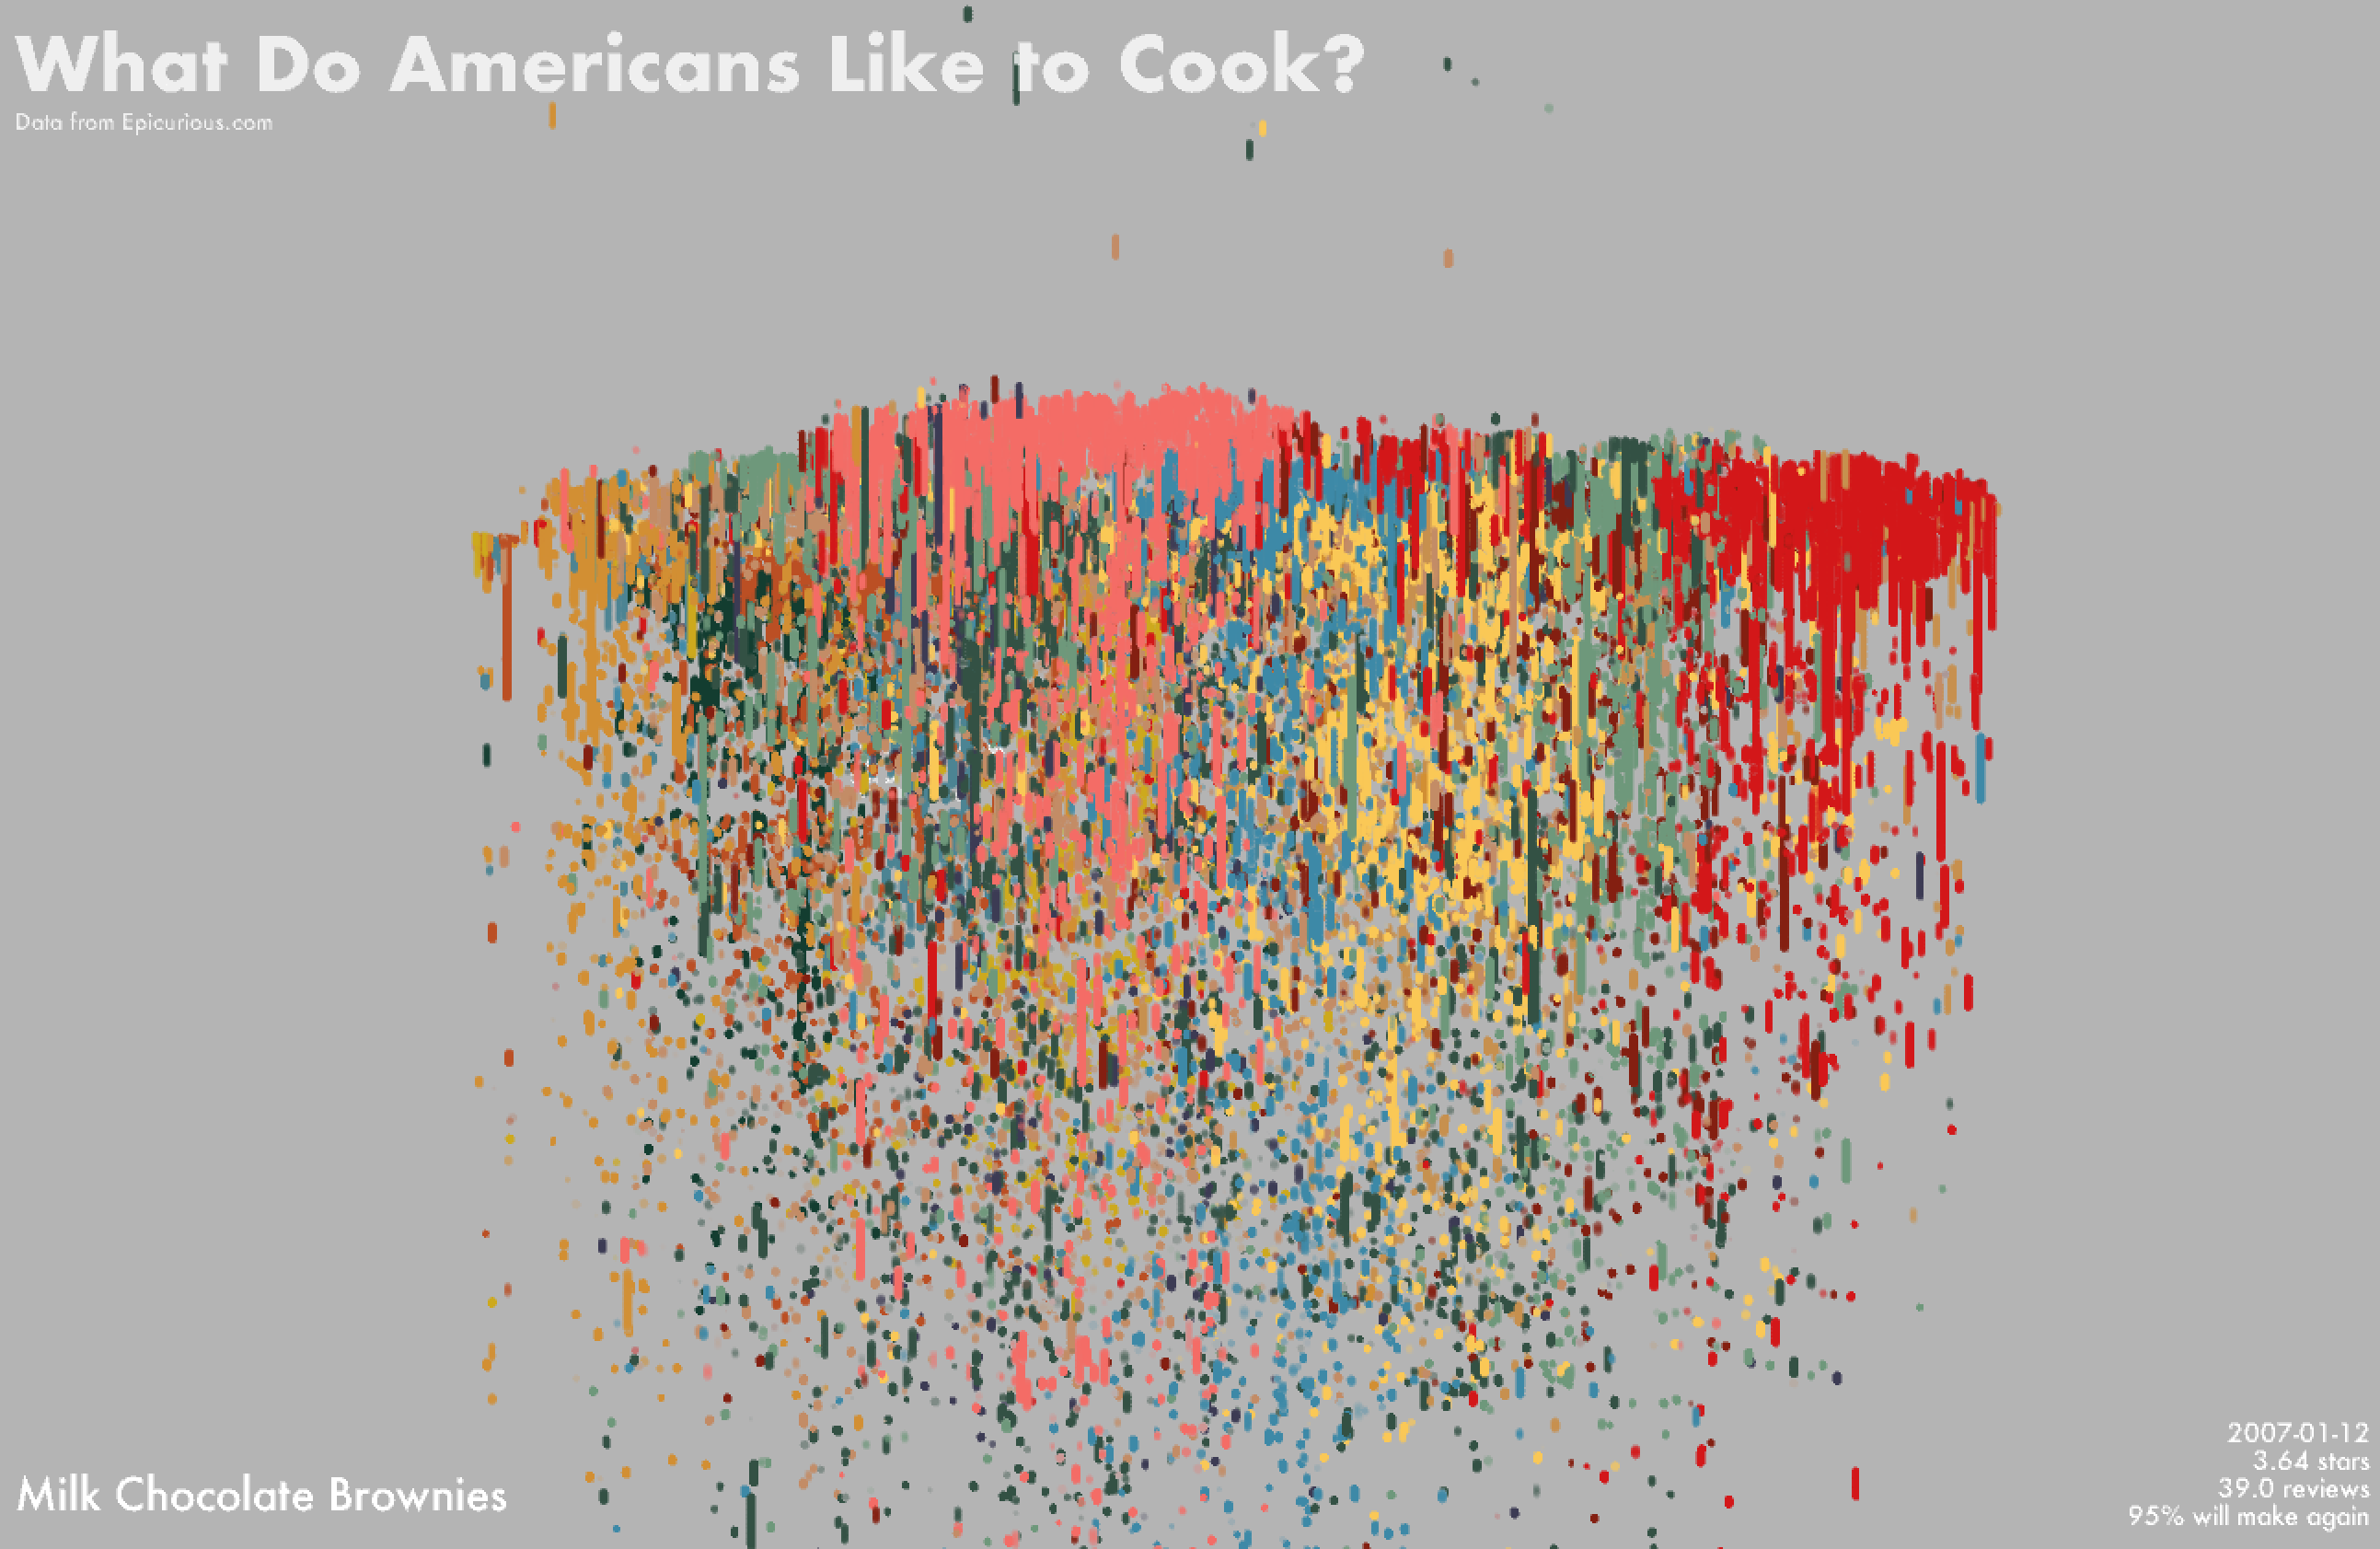
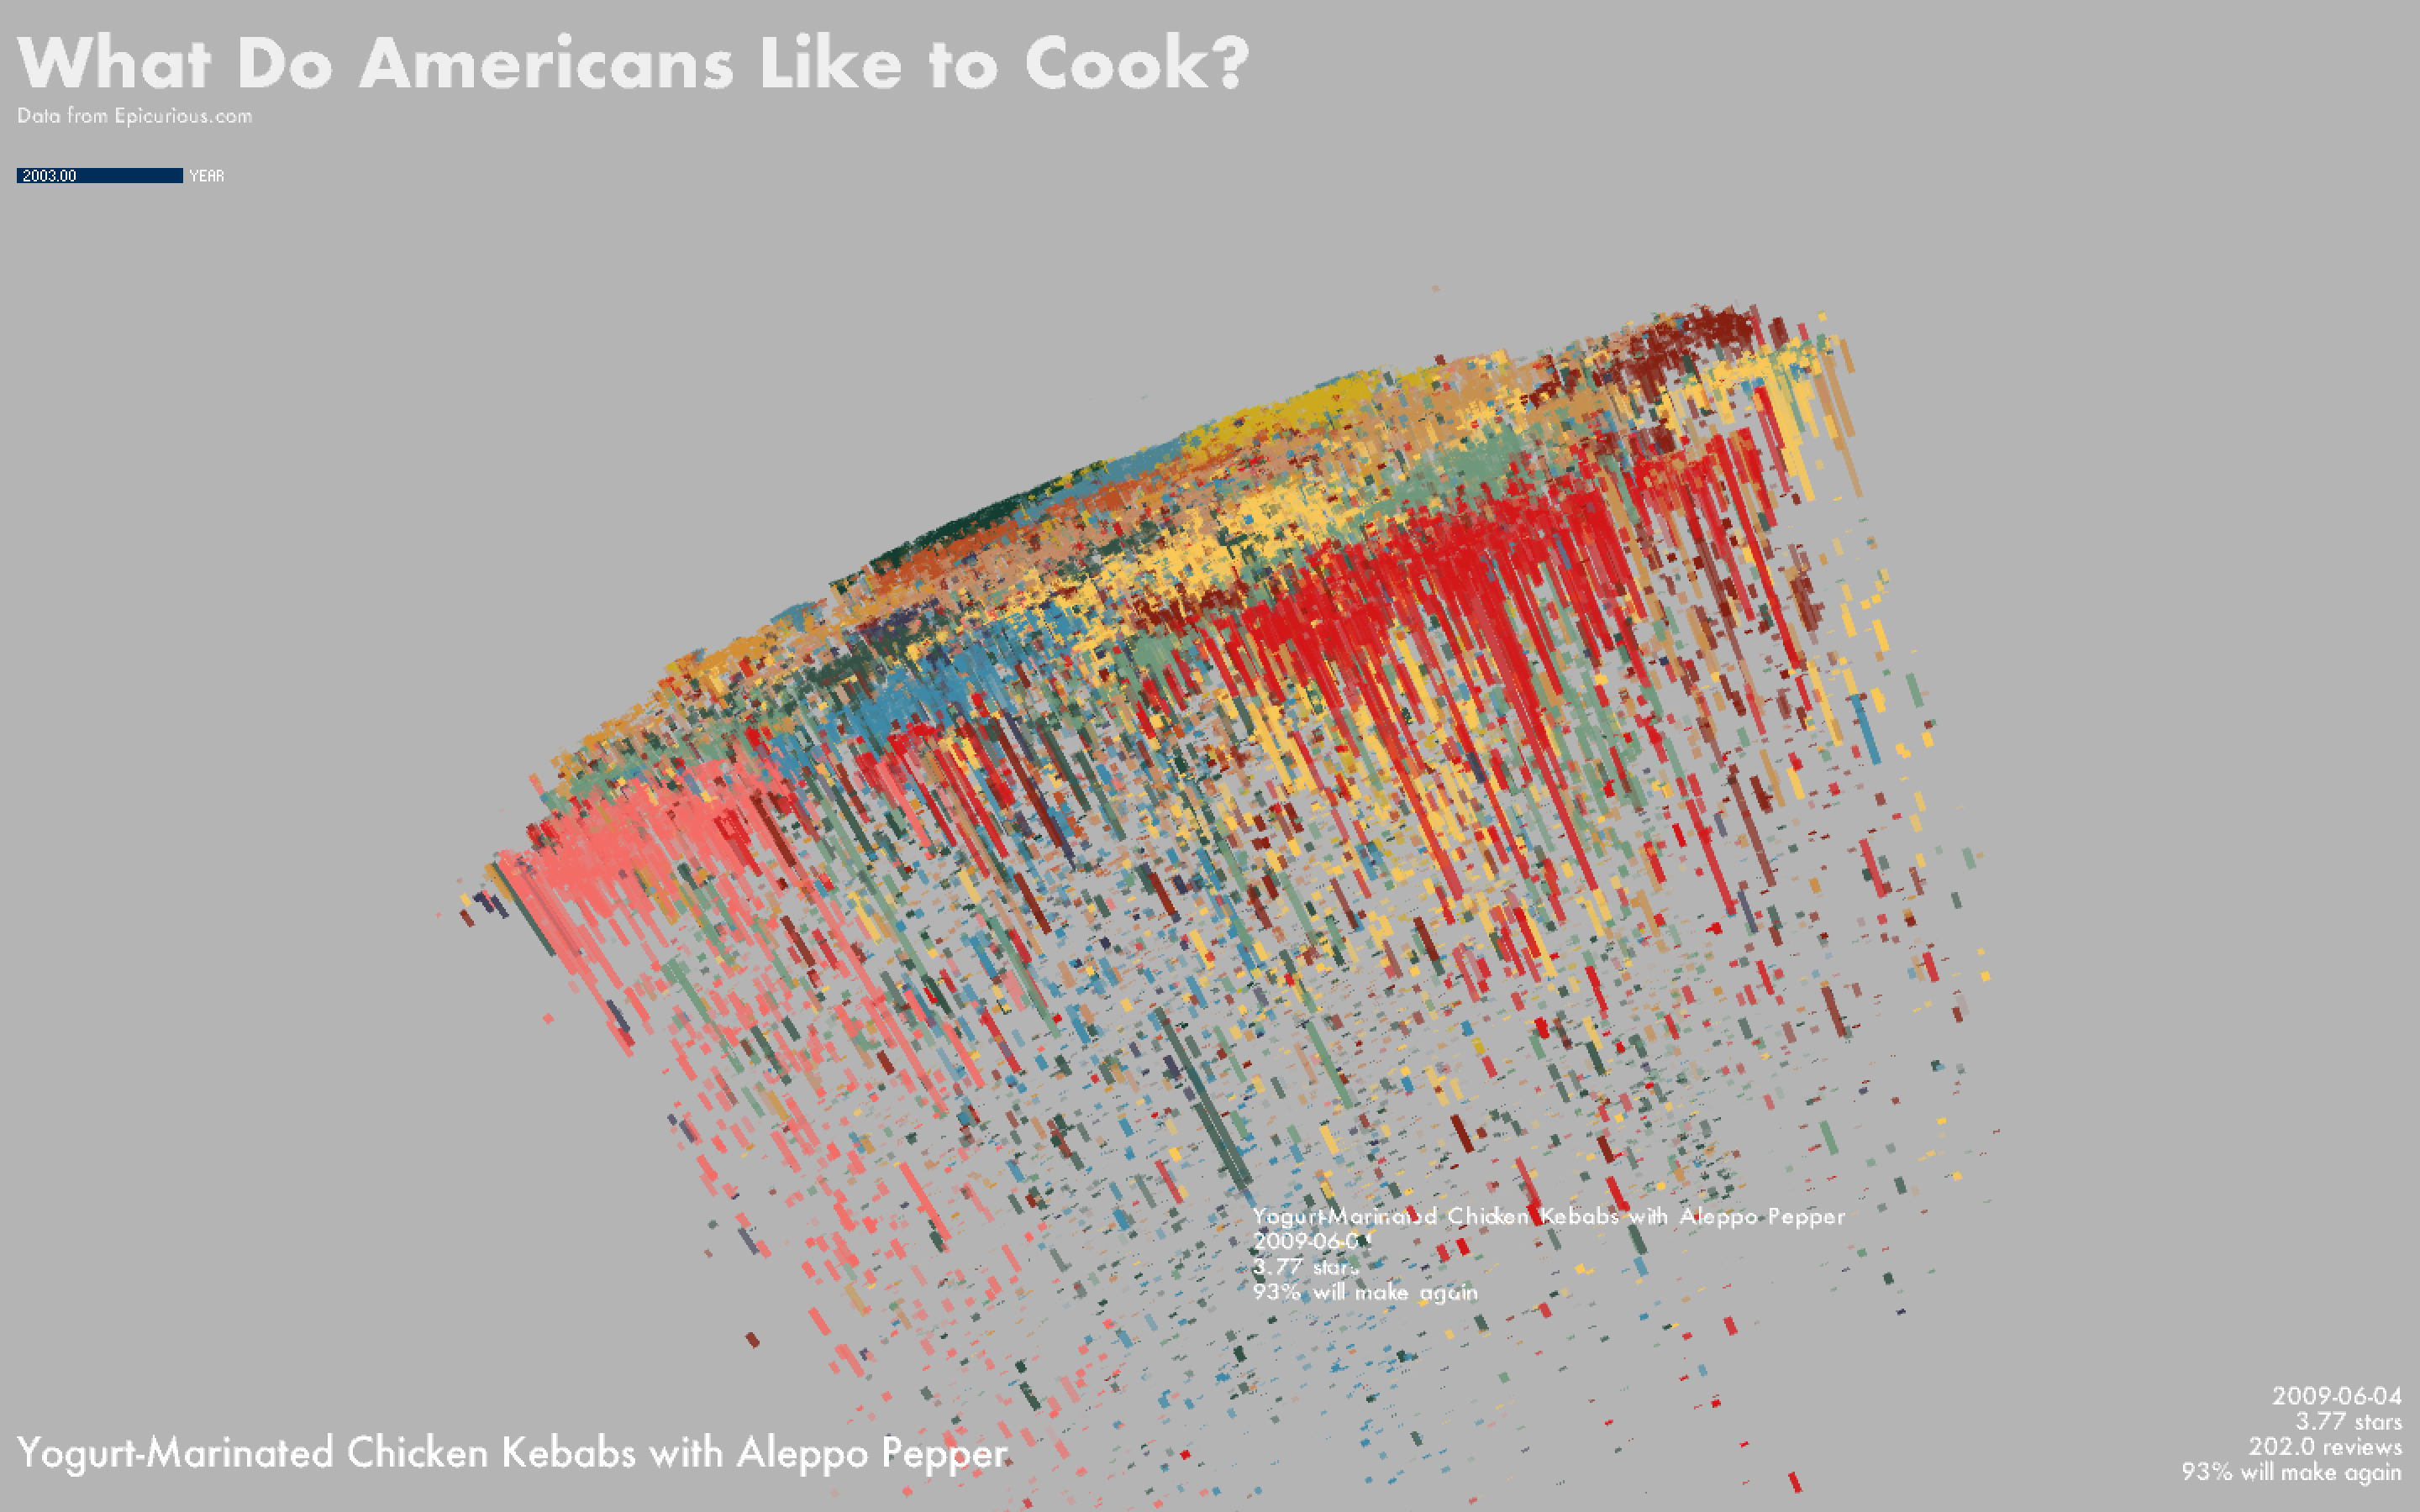
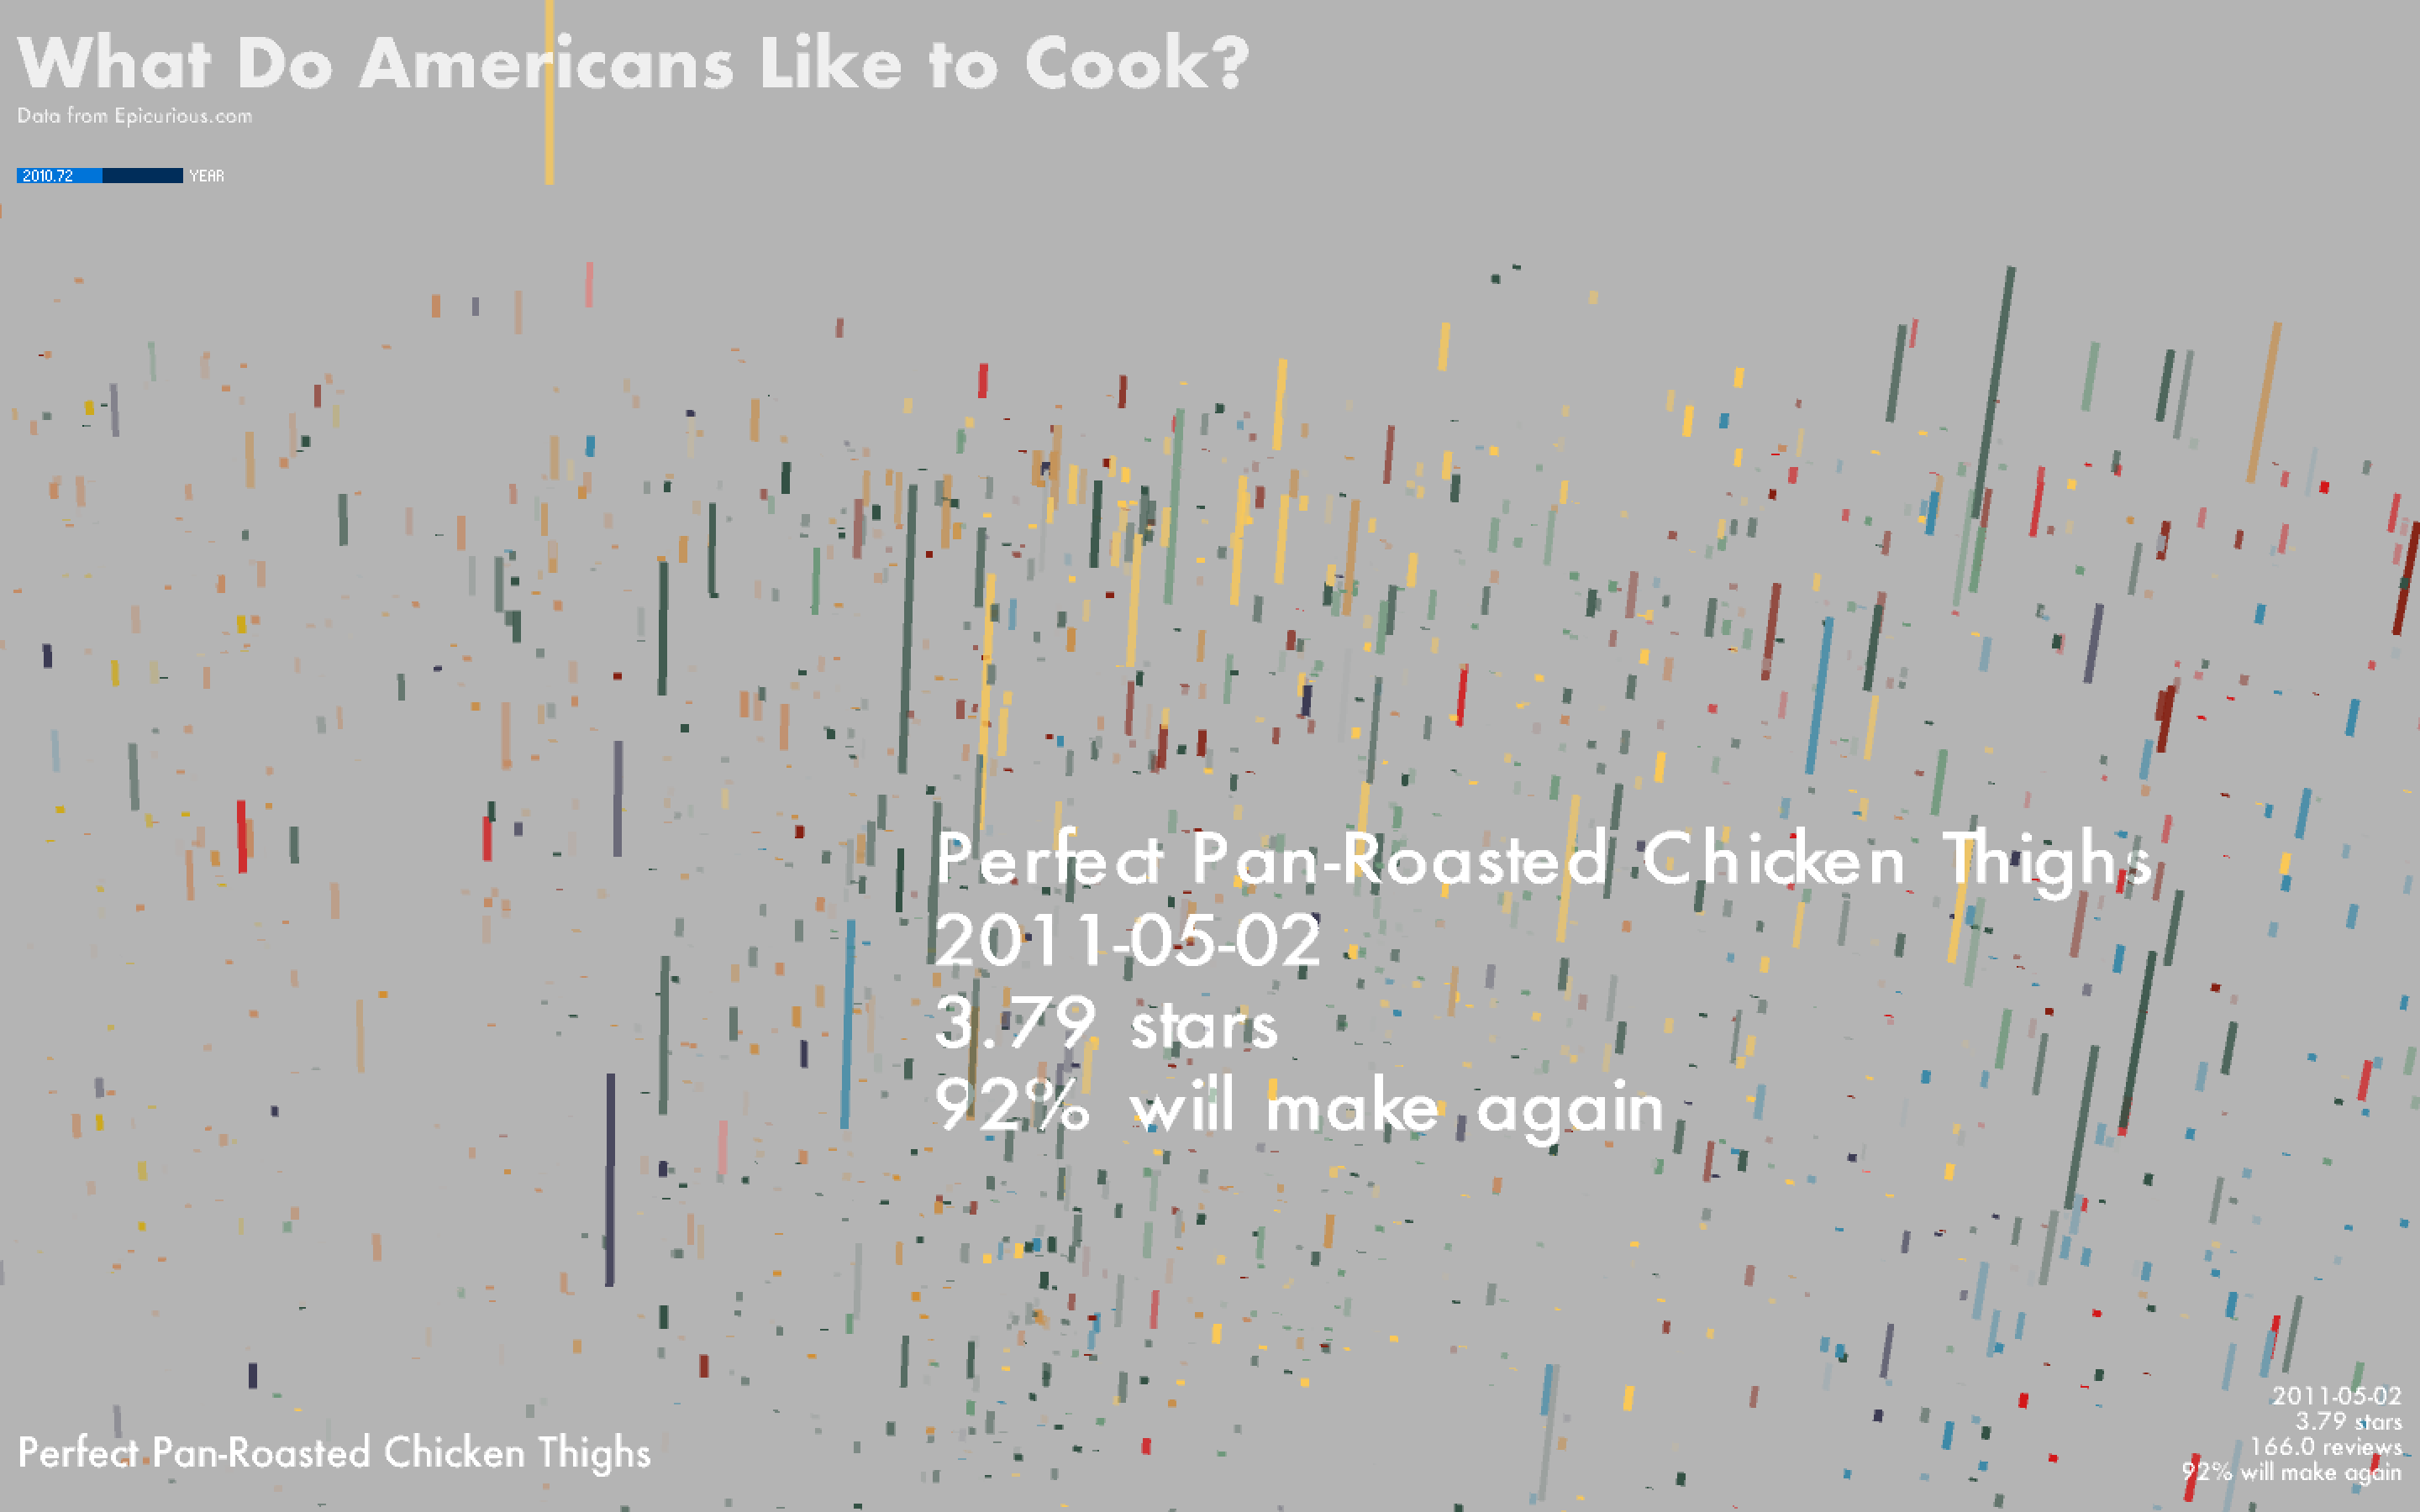
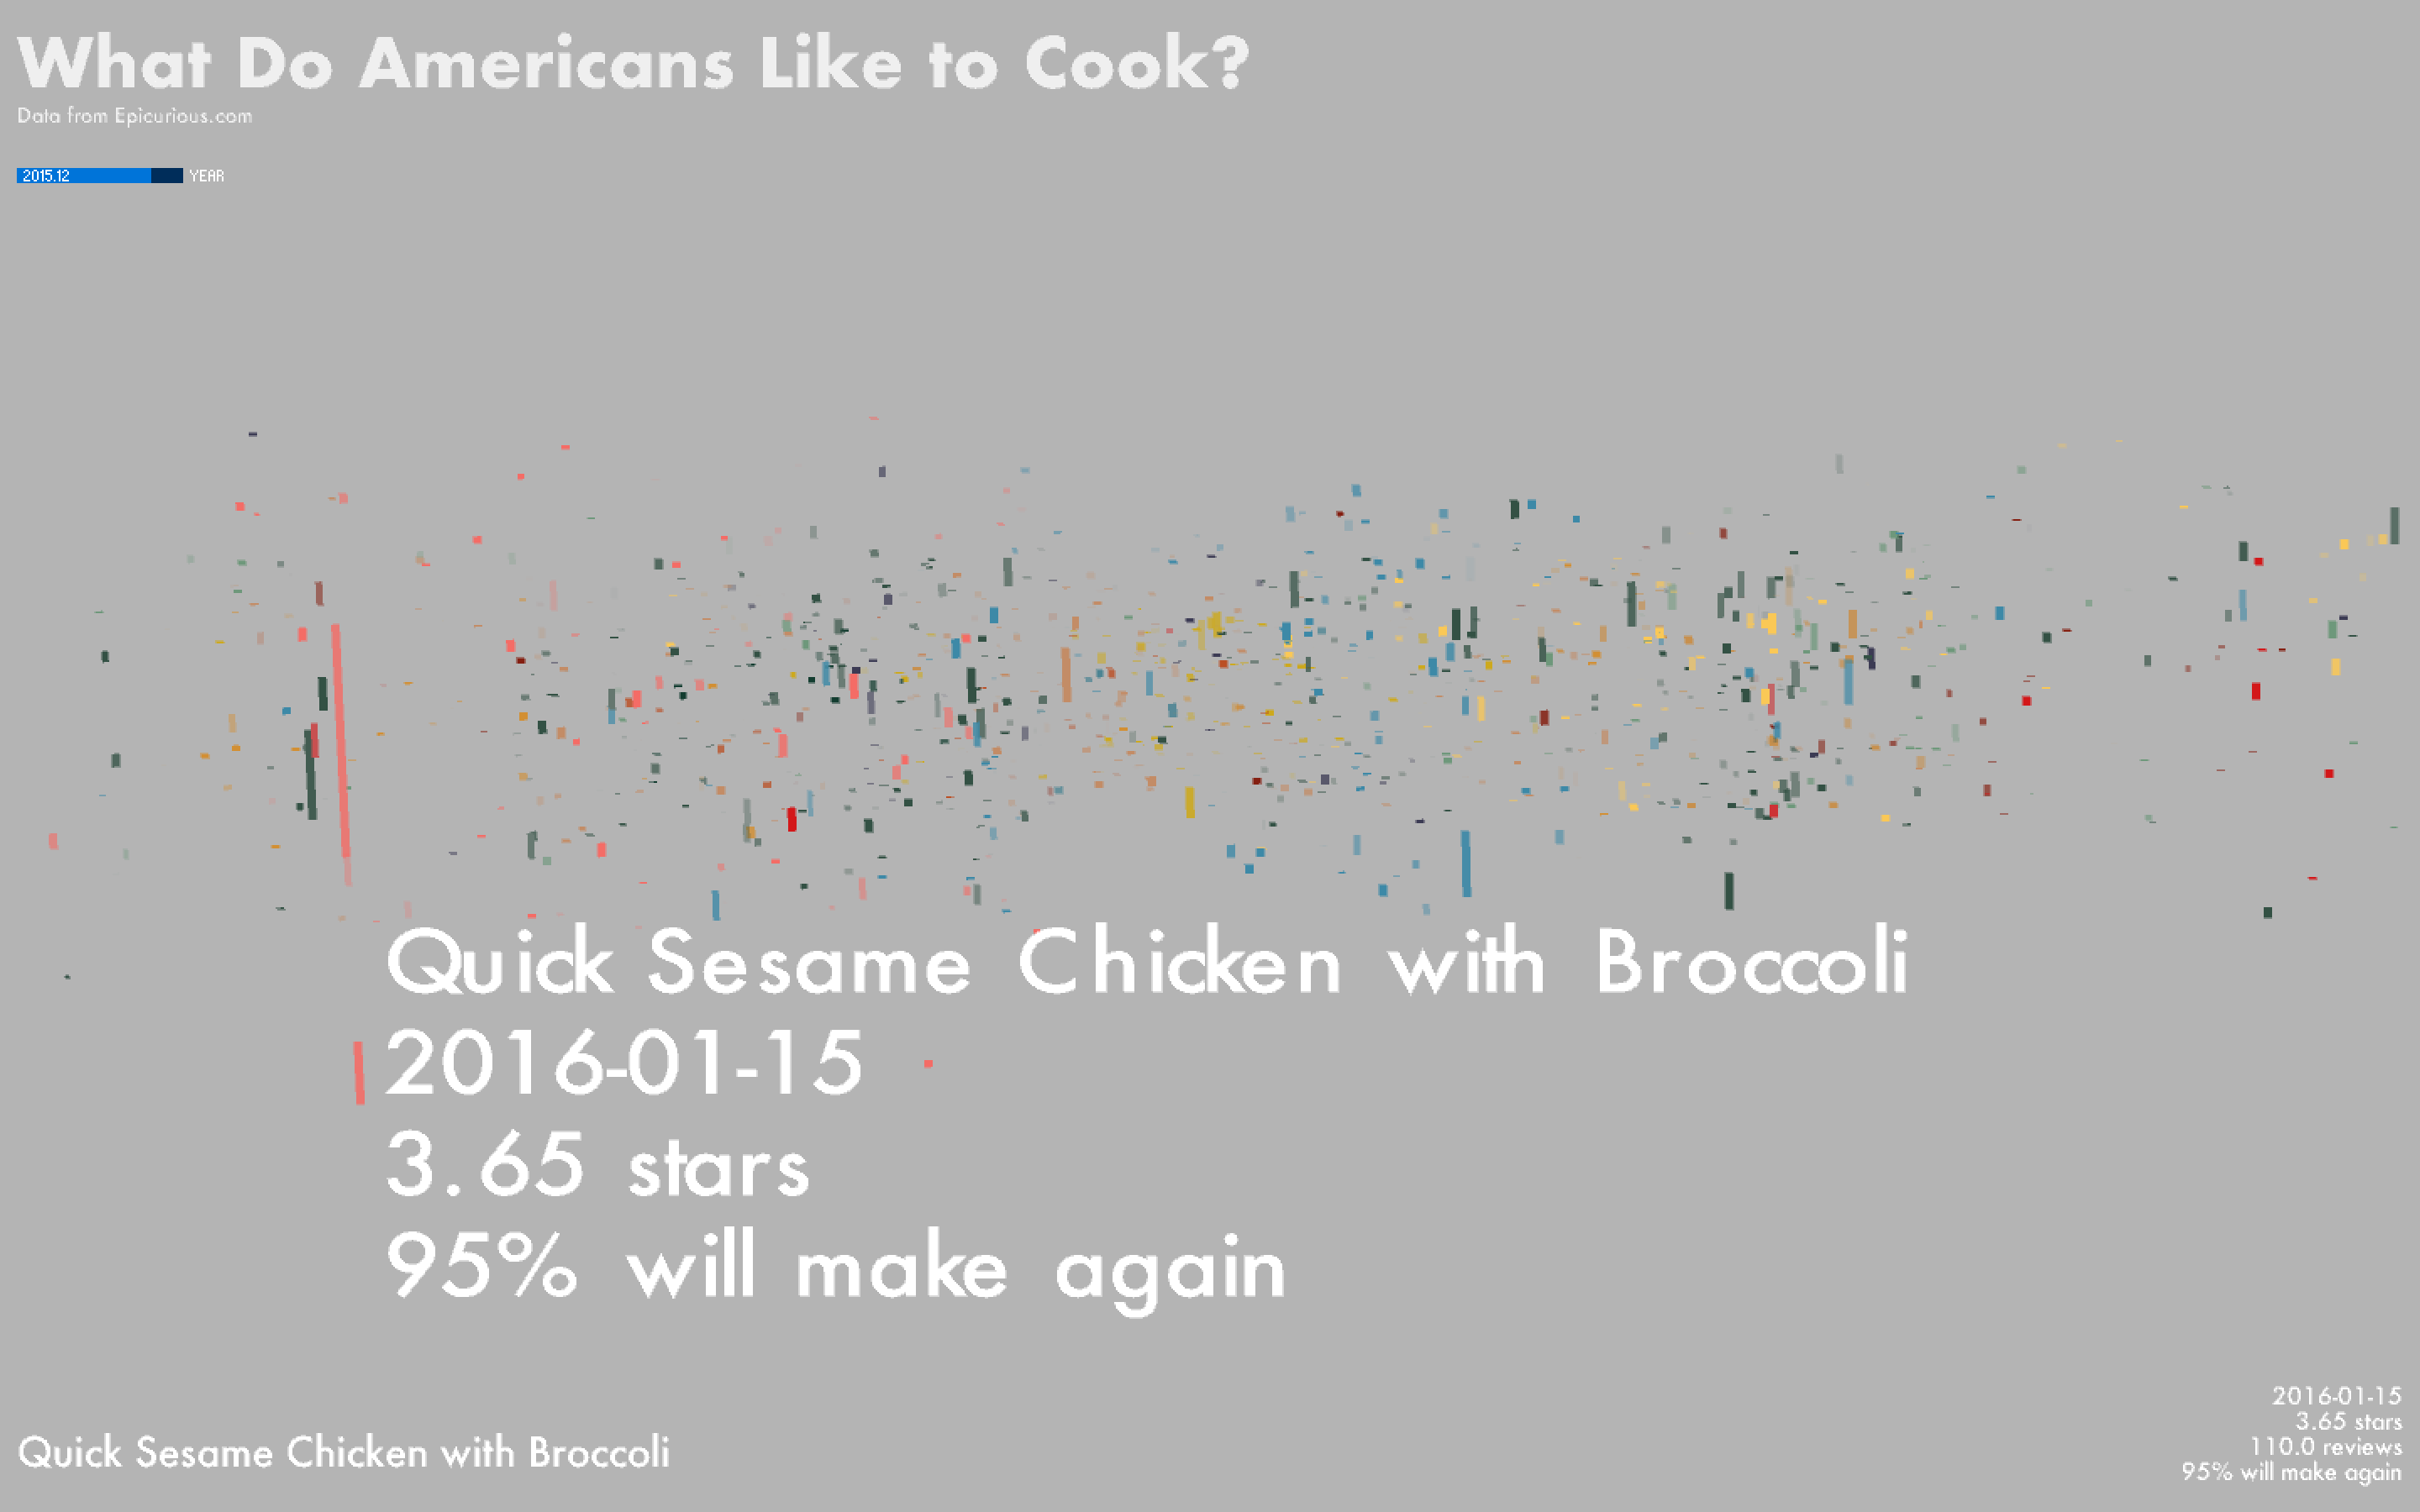
I plotted the data using the t-SNE coordinates in the x-y plane and the recipes' publication dates as the z-coordinates. Each recipe is displayed as a line, where the length of the line represents the number of reviewers and the thickness of the line represents its rating.
The color of the line represents its cluster label and the transparency represents the % of reviewers who said they would make the recipe again. Hovering over each line will show the corresponding recipe title, date, rating, # of reviewers, and % who would make it again.
I wasn't a big fan of the look of the lines with rectangular edges and preferred something with a more rounded look. I tried to approximate this by plotting a row of dots placed very close to each other such that it looks somewhat like a line with rounded edges.
However, the result is extremely slow to render and interact with, so I kept the lines since they are much faster.
Final result

Initially, I was interested in visualizing recipes taken from a user-submitted recipe database (which Epicurious is largely not) such as Allrecipes, which to my knowledge is the most popular food website in the US. While data from Allrecipes was included in the archive linked above, the recipes did not include publication date (though they did include other useful information such as the cooking time). Part of the reason I wanted to use data that included date information is to see how interest in foods/cuisines changes over time. While further analysis will be needed to extract trends from the data, I added a rudimentary slider that allows one to filter out recipes older than a specified date.
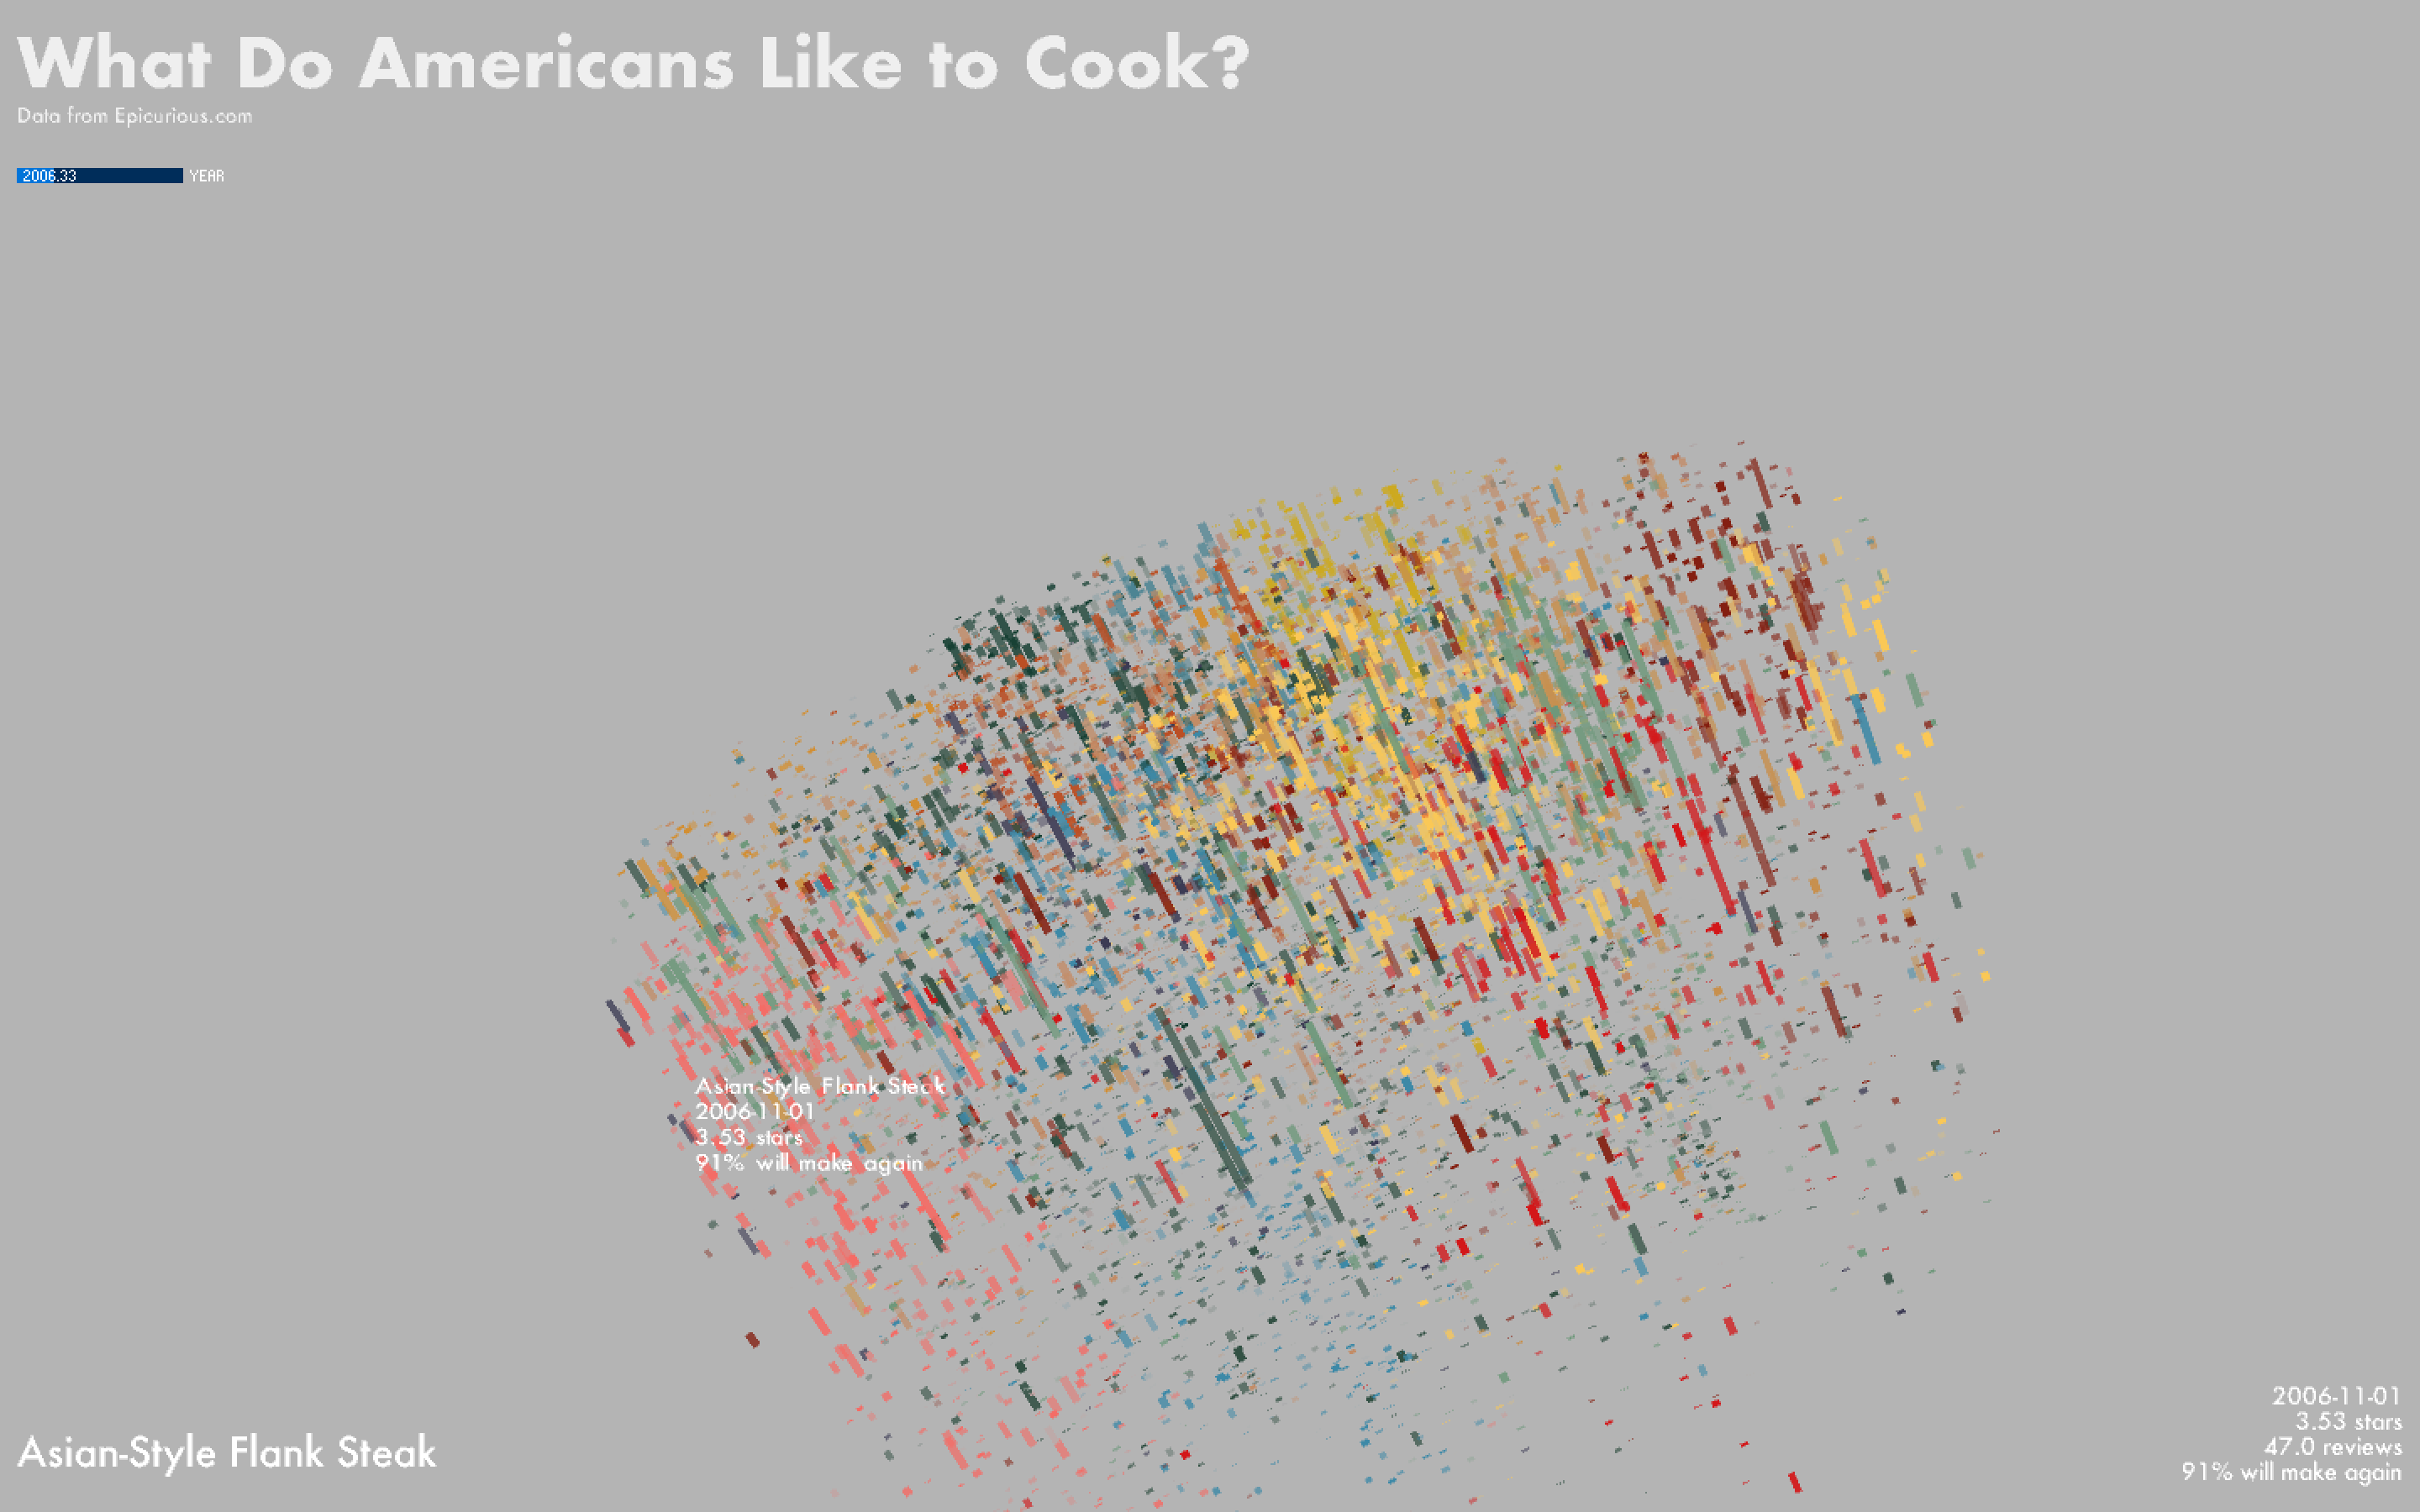
It appears that a large number of recipes have a publication date of 8/20/2004 -- while the site appears to have been founded in 1995, this may be the date on which the database in its current form was first indexed, and existing recipes, plus older ones from magazine issues and other publications that predated the site's establishment, were posted at once on this date. The recipe with the most reviews is Double Chocolate Layer Cake, published on 8/20/2004. Chicken recipes appear relatively popular: My Favorite Simple Roast Chicken, Chicken Marsala, and Roast Chicken Breasts with Garbanzo Beans, Tomatoes, and Paprika are amongst some of the heavily-reviewed recipes published after August 2004; Quick Sesame Chicken with Broccoli has a disproportionally high number of reviews for a recipe published in 2016.
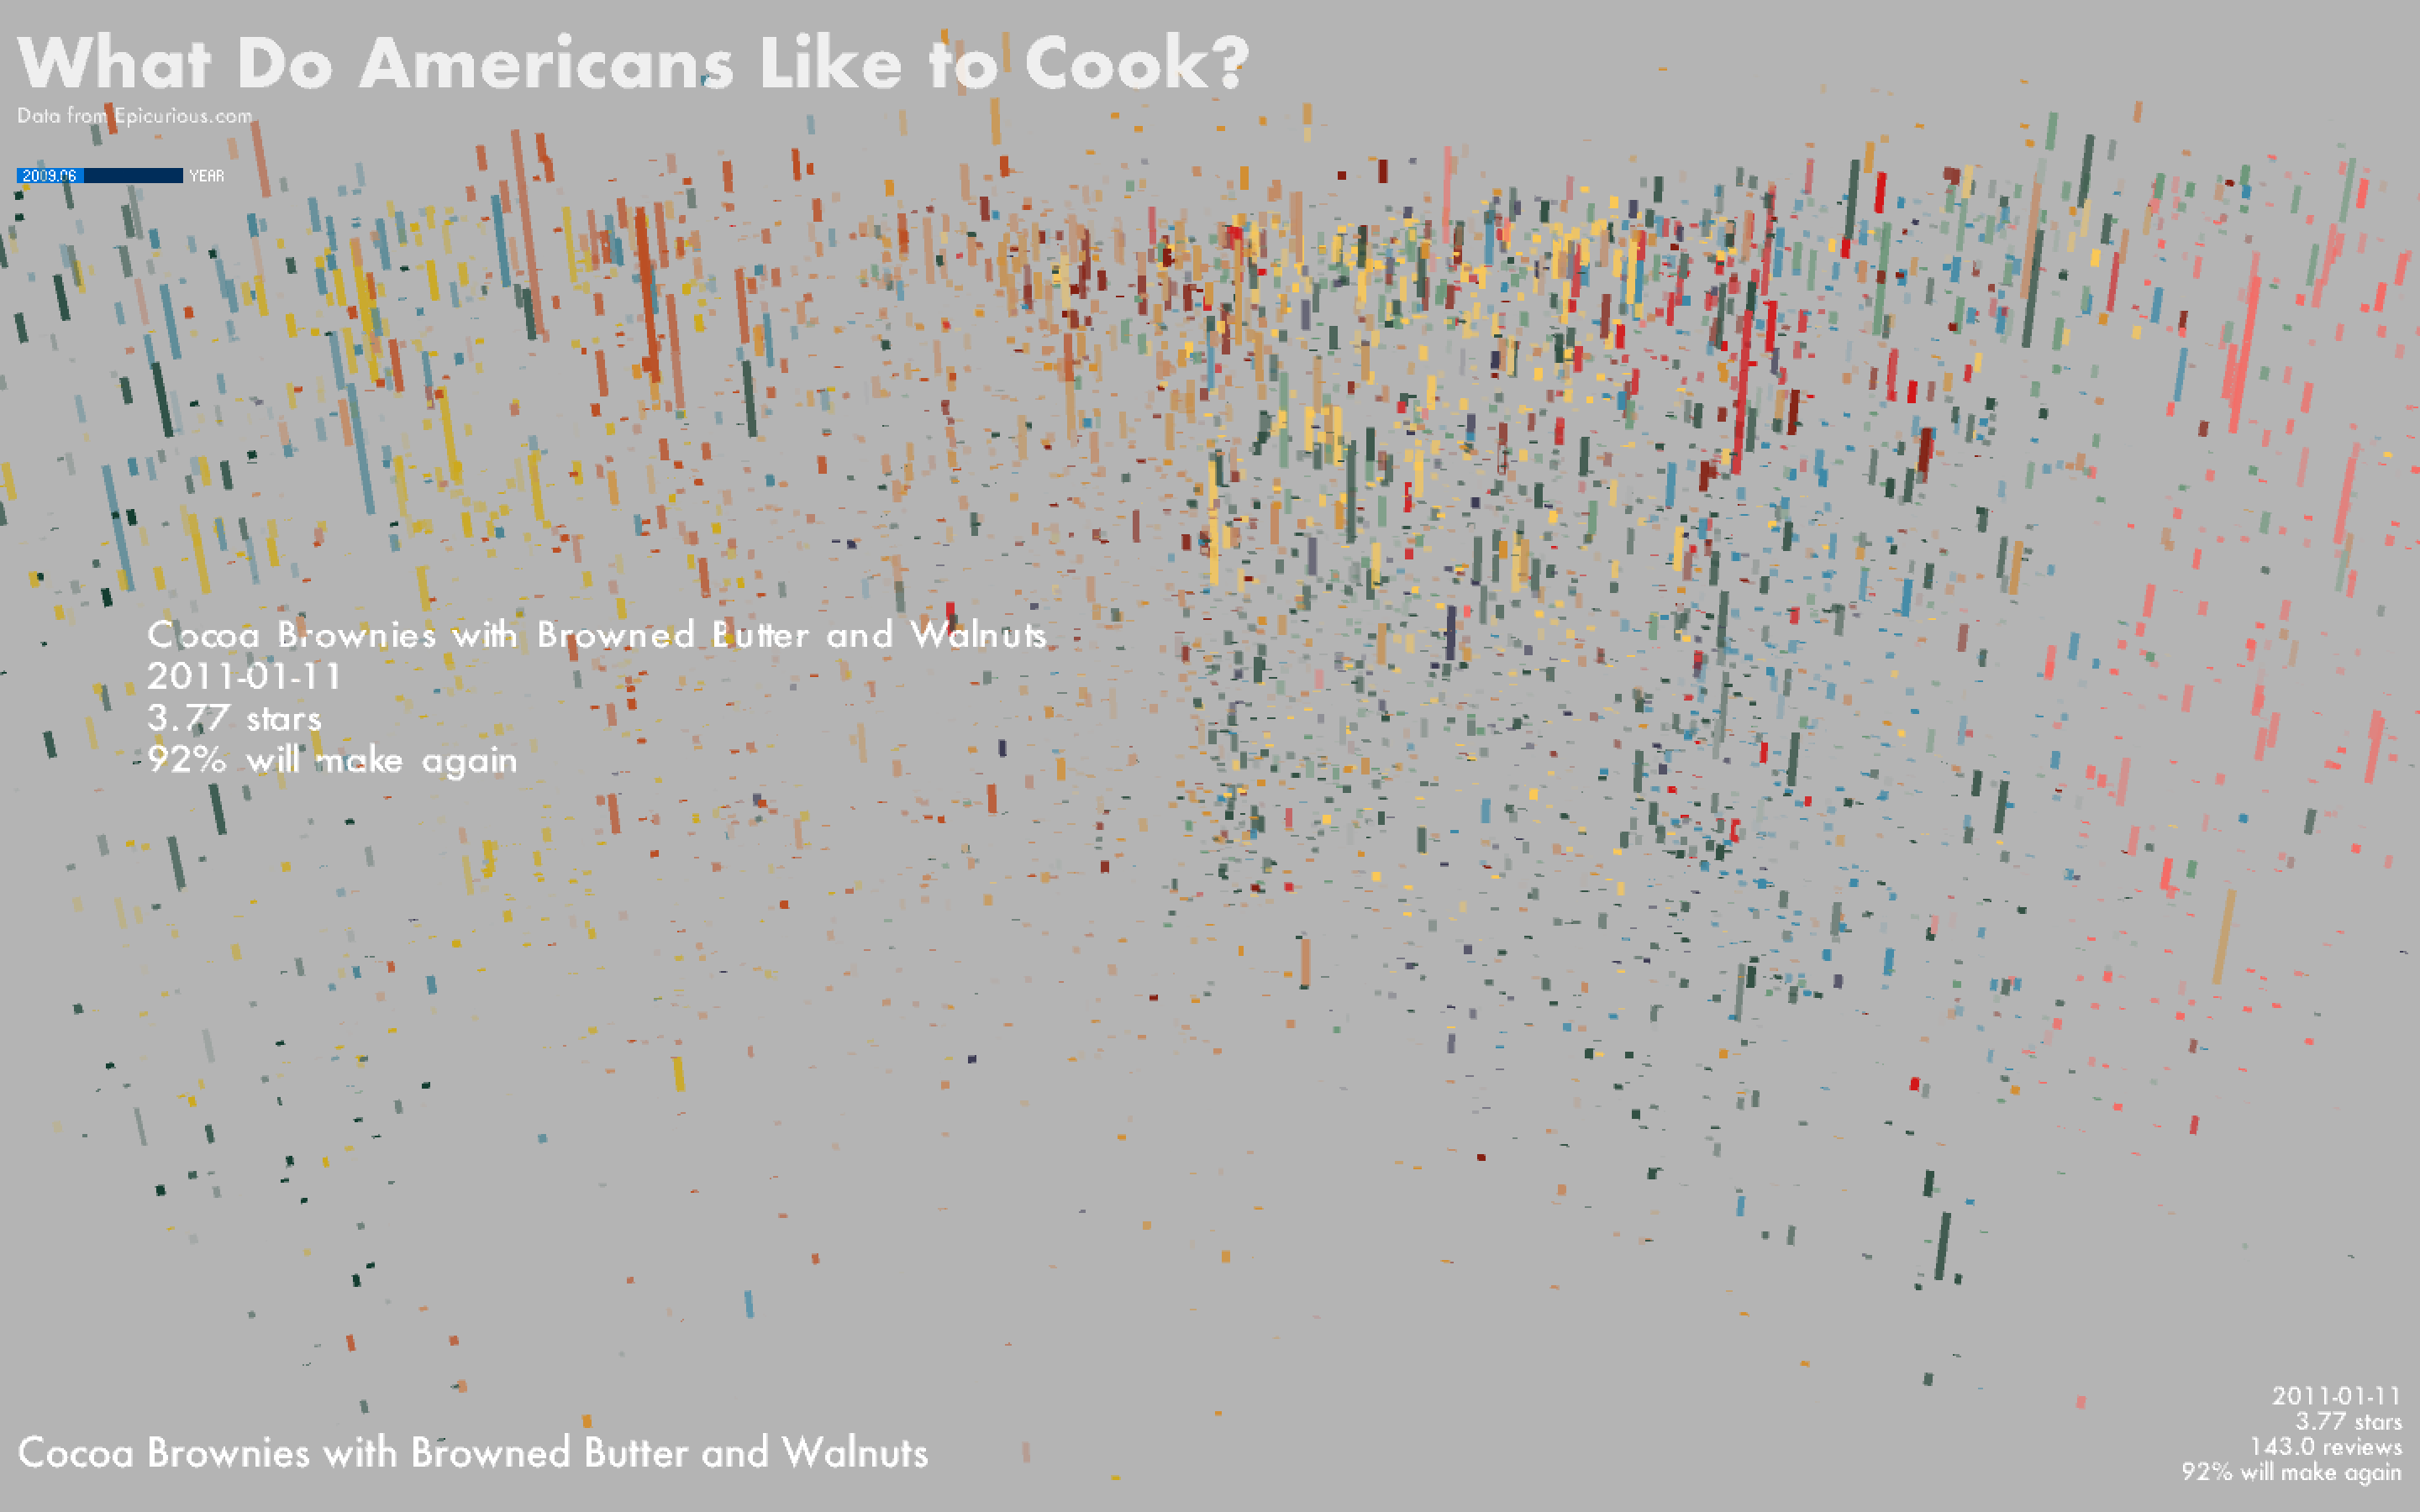
The k-means clustering resolved some clusters that make intuitive sense -- one cluster contains a lot of Asian recipes, another contains baked goods, and another contains predominantly chocolate-based desserts. Other clusters lack an immediately obvious theme connecting their constituents. The clustering was performed on ingredient lists, and as such there can be considerable overlap in the ingredients of recipes within a cluster.
Future work could involve performing the clustering on ingredients + instructions to determine similarities based on cooking methods. I might also need to refine the stopwords I used in doing the tf-idf vectorization to potentially extract more salient clustering. The stopwords I used included common English stopwords ("and", "the", etc.) plus those related to measurement quantities ("cups", "tablespoons", etc.). I did not exclude words related to the preparation of ingredients ("diced", "minced", etc.), but I would be interested in seeing how the results change with these words excluded. I am also interested in examining interest in different recipes as a function of geographical location. Some reviewers include their location as part of their comments on recipes. It could also be possible to integrate location data from Google Trends.
Code
Vectorization, clustering, and dimensionality reduction were done in Python, and the visualization was developed in Processing.
Source Code + Data
Source Code + Data