Food and Drink Words
MAT 259, 2019
Chantal Nguyen
Concept
I obtain the most common words found in the titles of Dewey number 641 (food and drink) media and use t-SNE for dimensionality reduction in order to explore the data in 3D space. I also generate a network that links words co-occurring in the same title and extract its community structure.
Query
I queried the titles of all Dewey 641 media that were checked out between 2006 and 2018. I noticed that there was a text encoding problem with the database - special characters were encoded incorrectly, for instance I would get 'caf‚' instead of 'café'. I was unable to find a solution, but the following code mitigates this somewhat (the words with special characters are still wrong, but they aren't as gnarly).
Next, I vectorized the titles using word2vec. To map each word into a location in 3D space, I performed dimensionality reduction with t-SNE and extracted each word's x, y, and z coordinates. (Note: I only kept words that occurred at least 3 times amongst the whole set of titles). The Python code for these steps was largely borrowed from this very detailed blog post by Andy Patel. A Jupyter notebook detailing these steps is included at the bottom of hte page.
I also generated a simplistic word co-occurrence network by defining words as nodes with edges between two words that occur in the same title. The weight of an edge represents how many times those two words have occurred in the same title. I also obtained the community structure of the word network in Matlab, using a community detection algorithm from the GenLouvain package. The community detection algorithm determines clusters (communities) of nodes that are relatively densely connected with each other and sparsely connected with the rest of the network.
SELECT
    CONVERT( CAST(CONVERT( title USING LATIN1) AS BINARY) USING UTF8) AS fixedTitle,
    COUNT(bibNumber) AS Counts
FROM
    spl_2016.inraw
WHERE
    deweyClass >= 641 AND deweyClass < 642
        AND YEAR(cout) BETWEEN 2006 AND 2018
GROUP BY fixedTitle
ORDER BY Counts DESC
LIMIT 20000
The query took 32 seconds.
Next, I vectorized the titles using word2vec. To map each word into a location in 3D space, I performed dimensionality reduction with t-SNE and extracted each word's x, y, and z coordinates. (Note: I only kept words that occurred at least 3 times amongst the whole set of titles). The Python code for these steps was largely borrowed from this very detailed blog post by Andy Patel. A Jupyter notebook detailing these steps is included at the bottom of hte page.
I also generated a simplistic word co-occurrence network by defining words as nodes with edges between two words that occur in the same title. The weight of an edge represents how many times those two words have occurred in the same title. I also obtained the community structure of the word network in Matlab, using a community detection algorithm from the GenLouvain package. The community detection algorithm determines clusters (communities) of nodes that are relatively densely connected with each other and sparsely connected with the rest of the network.
Process
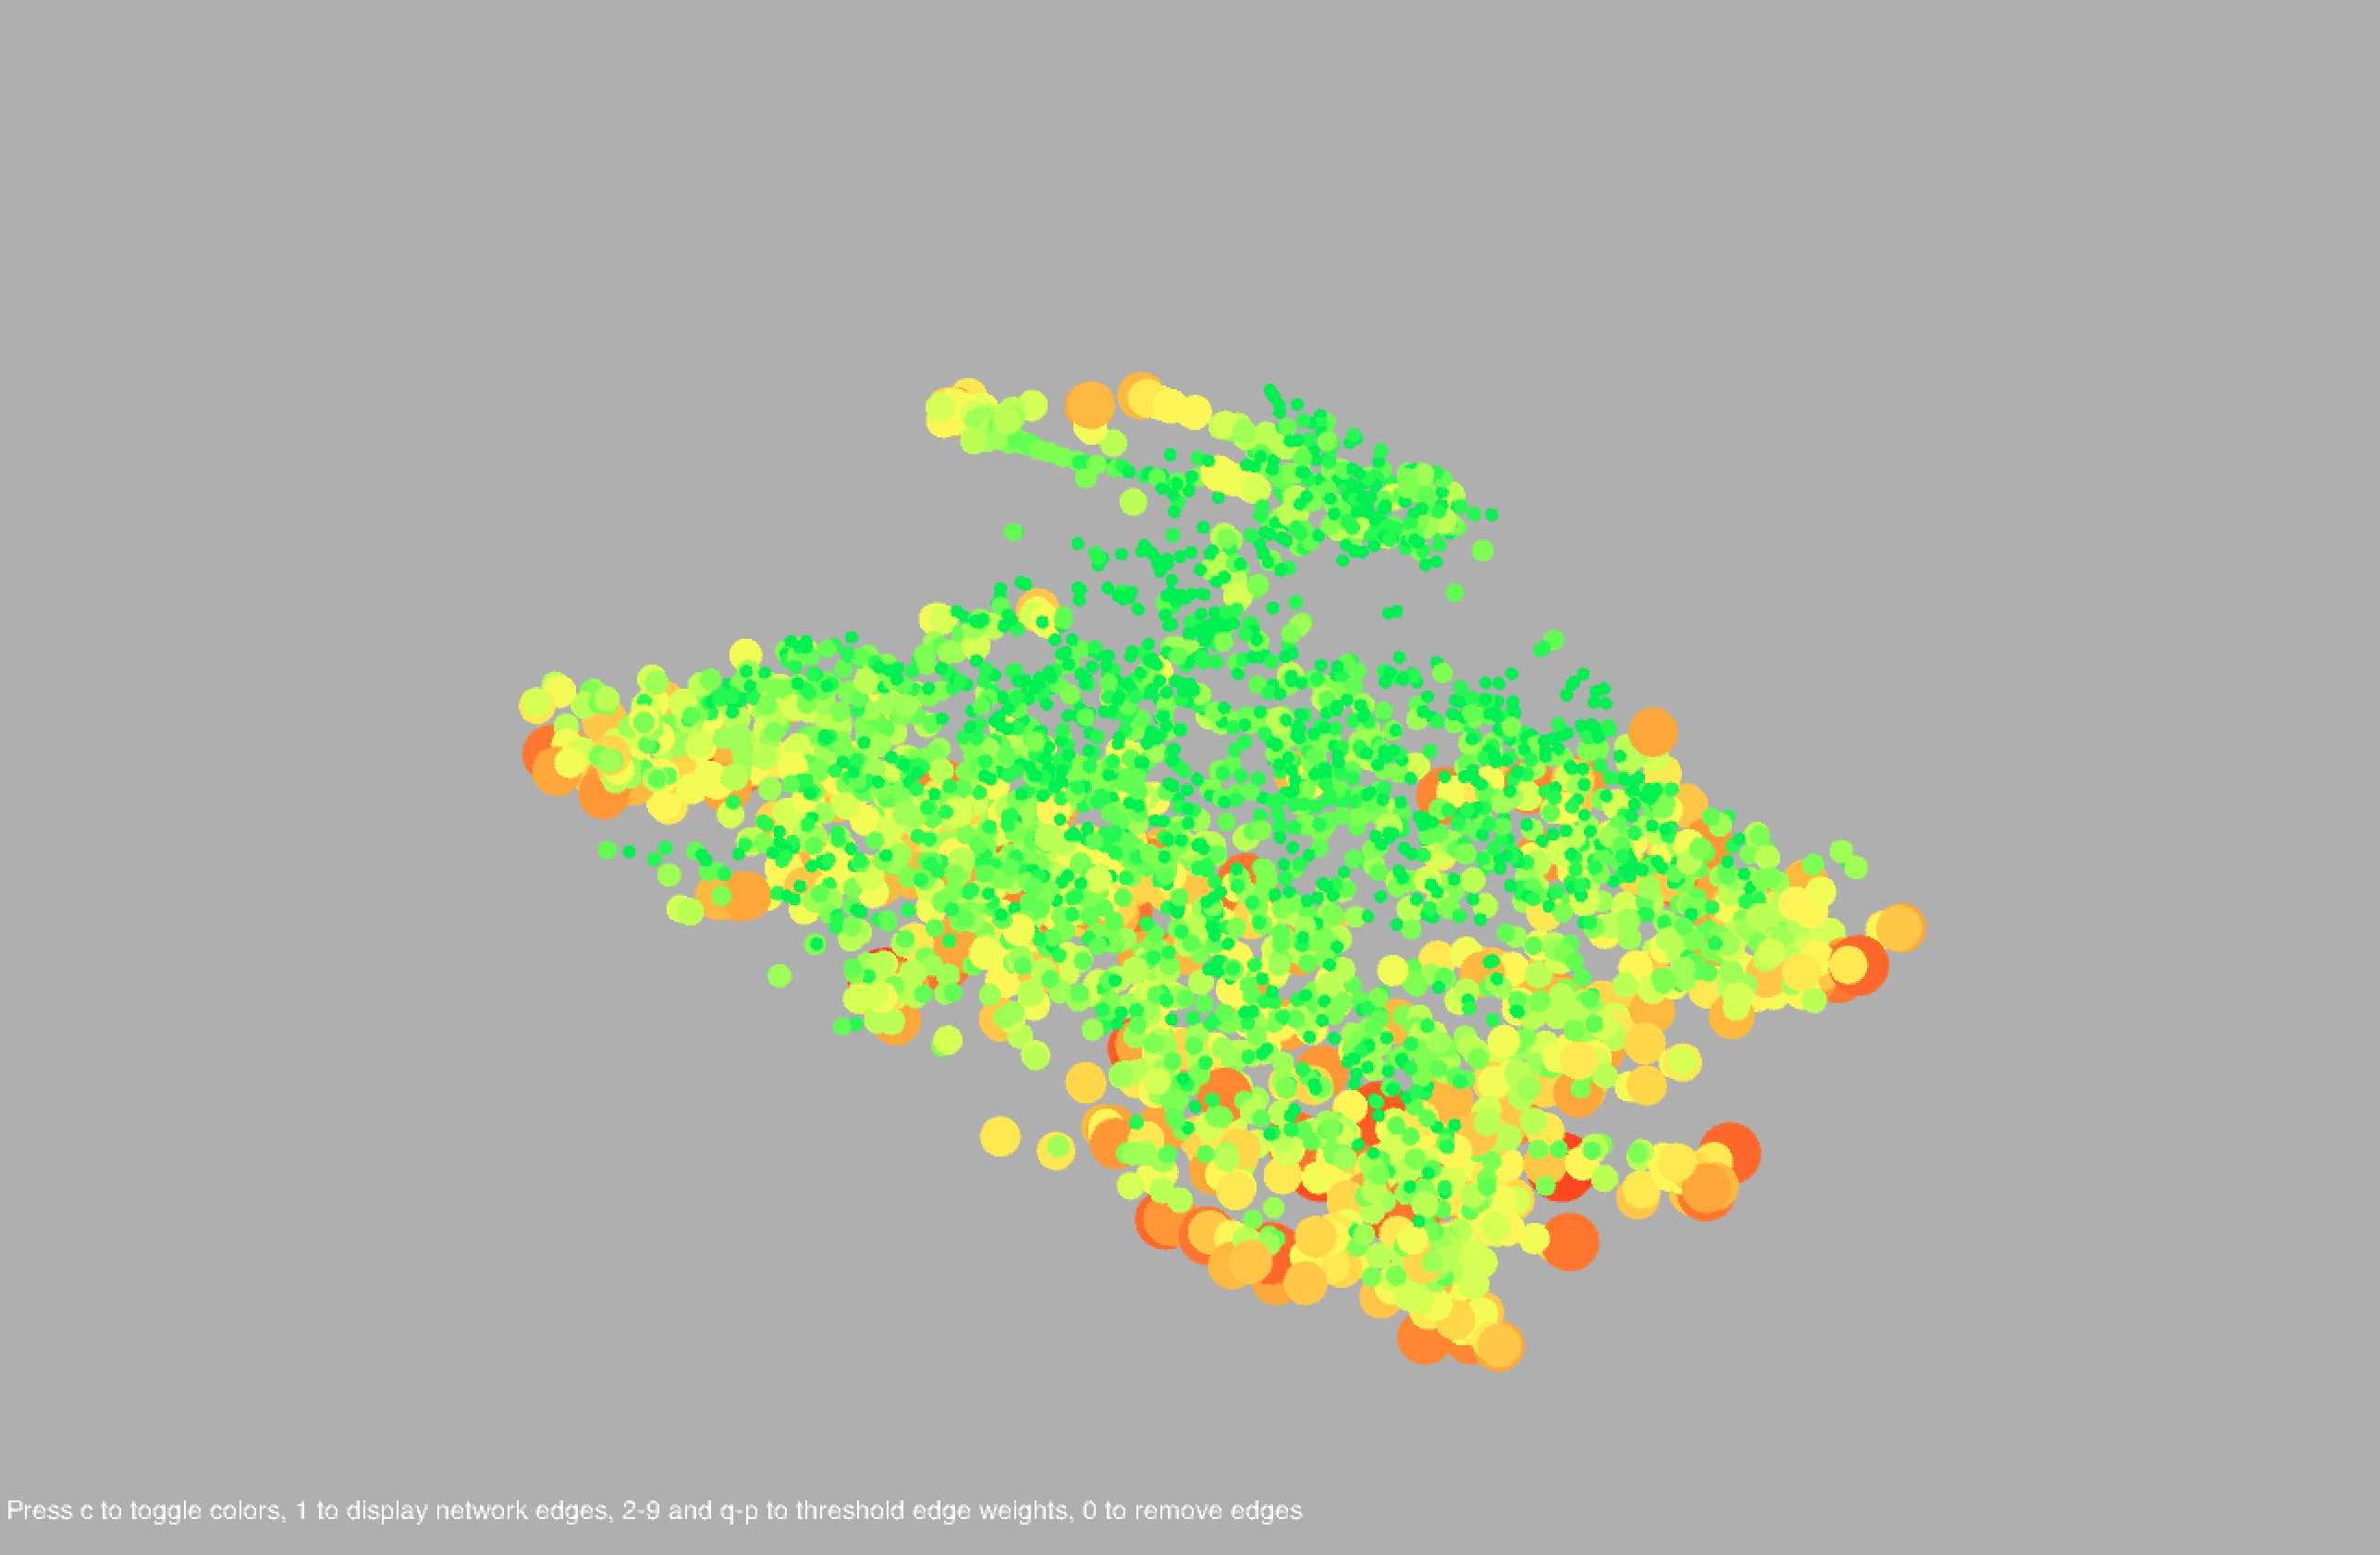
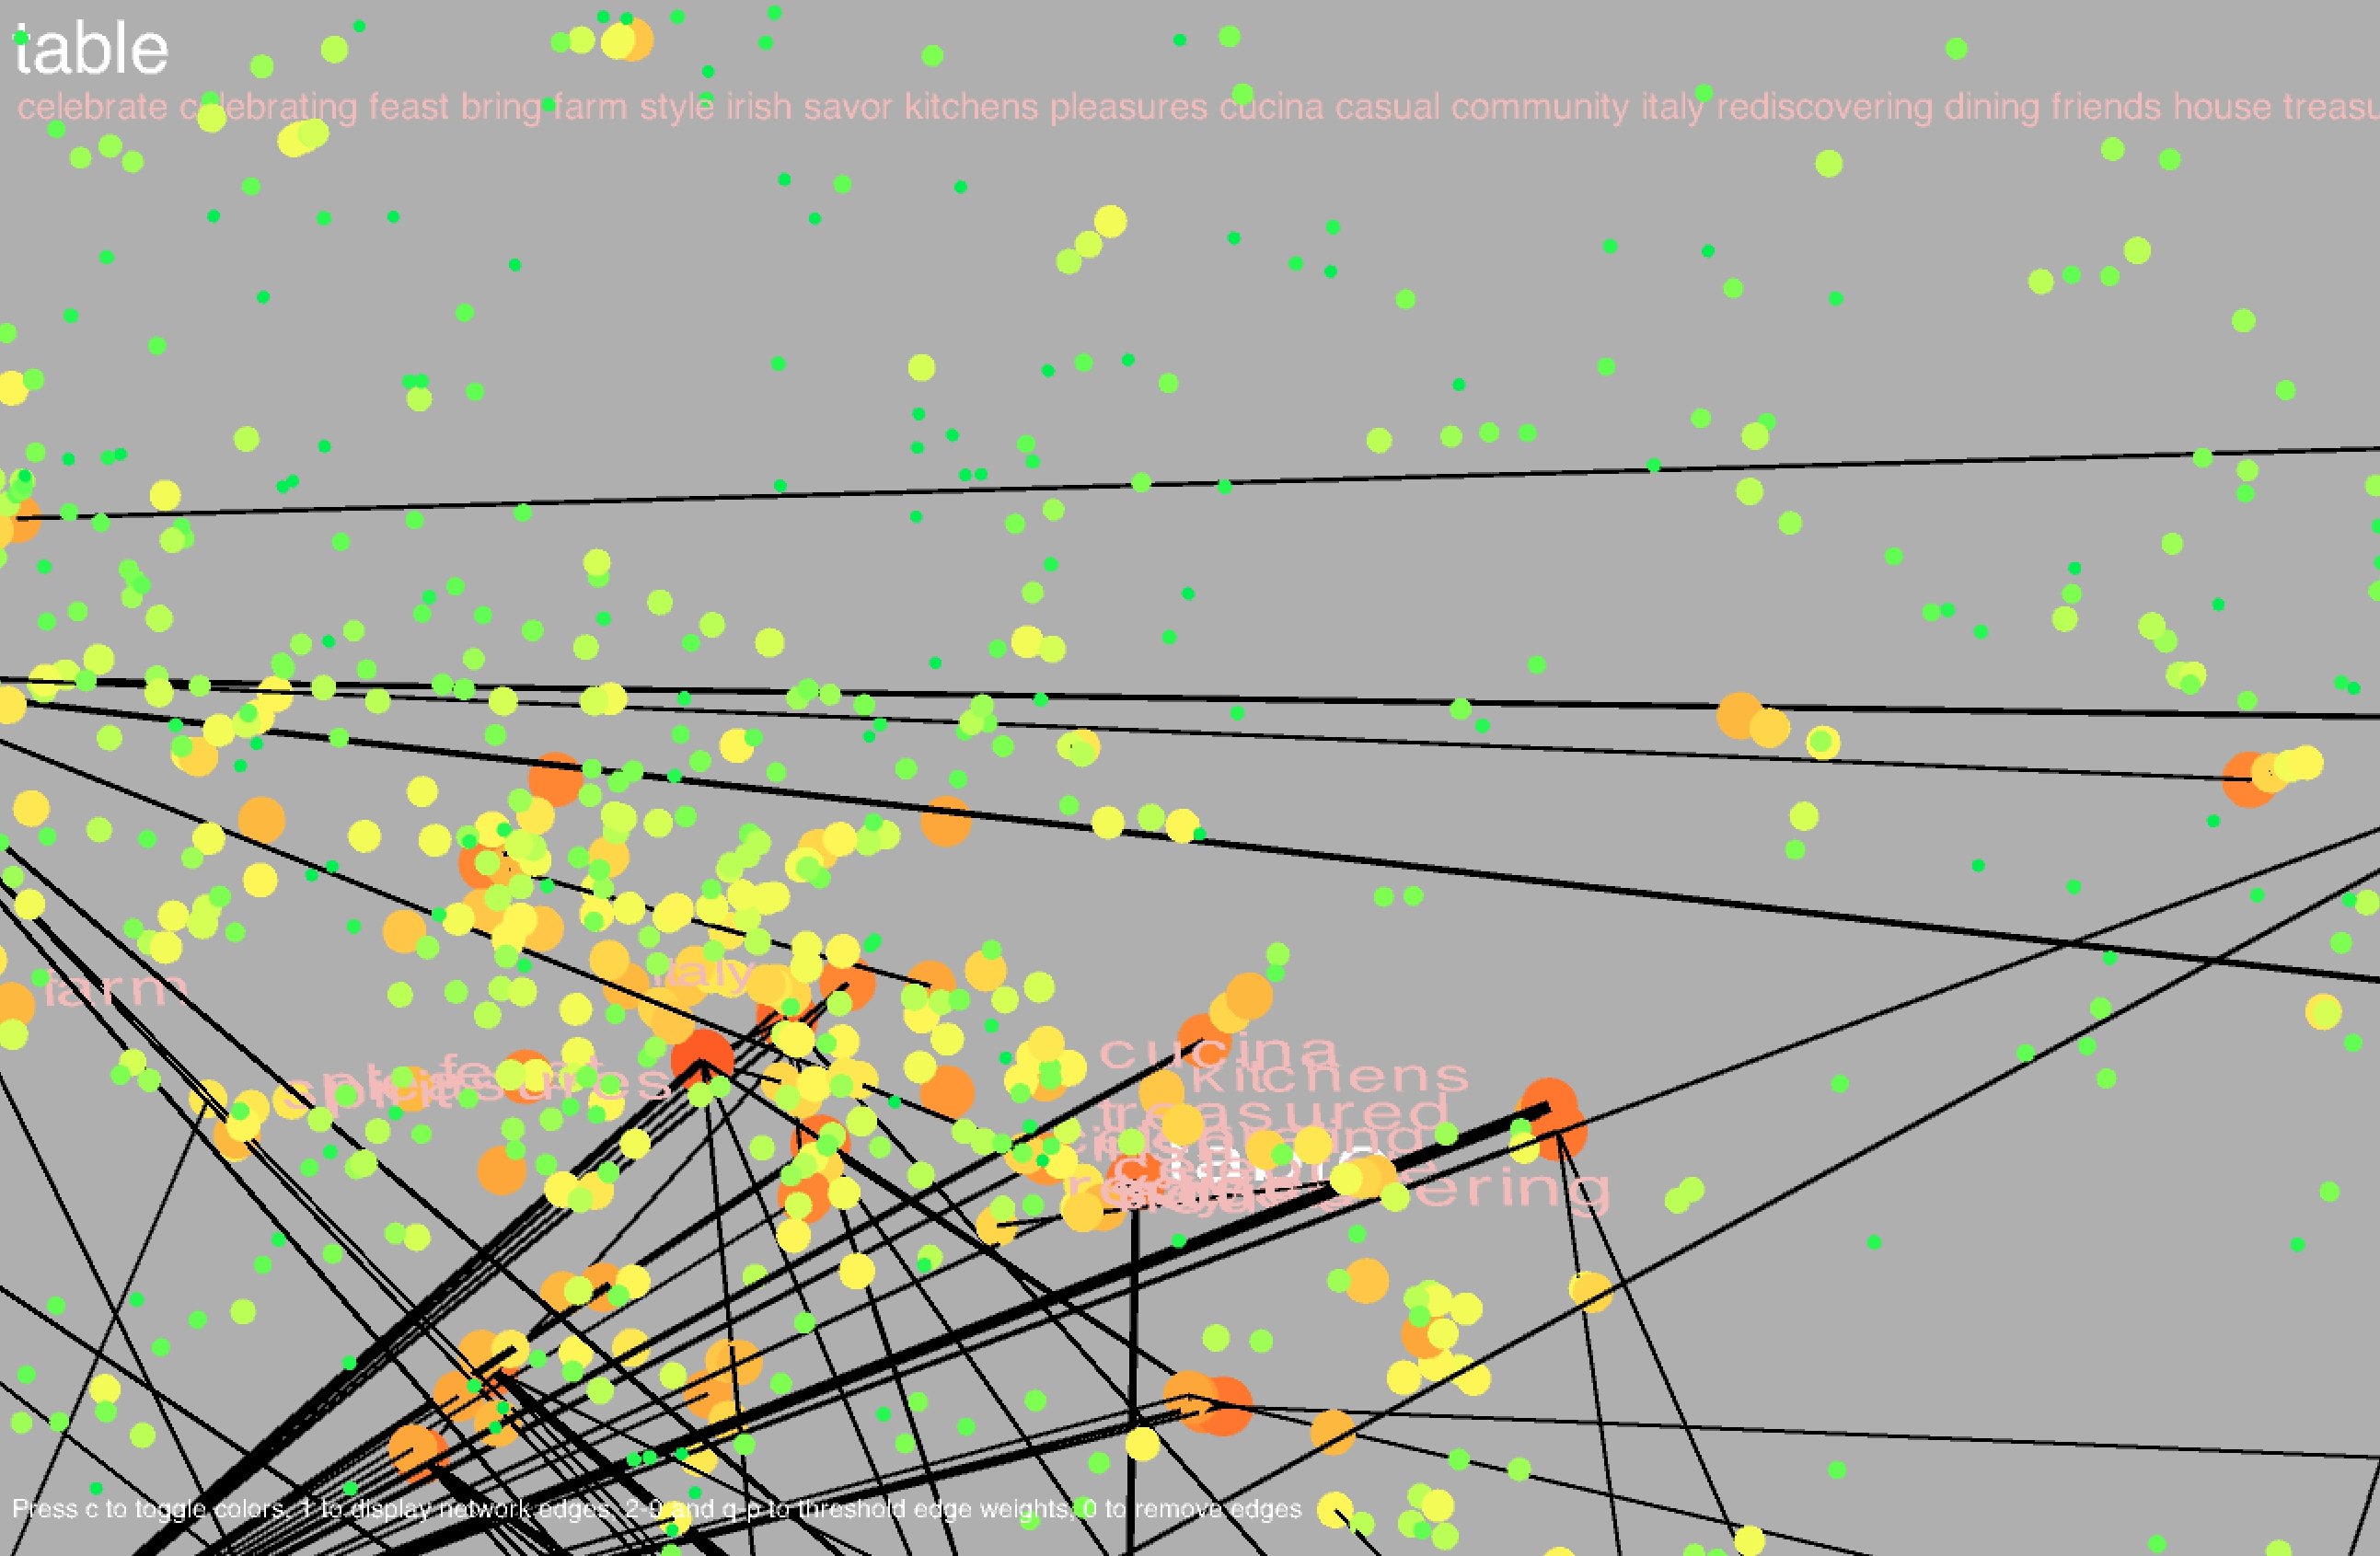
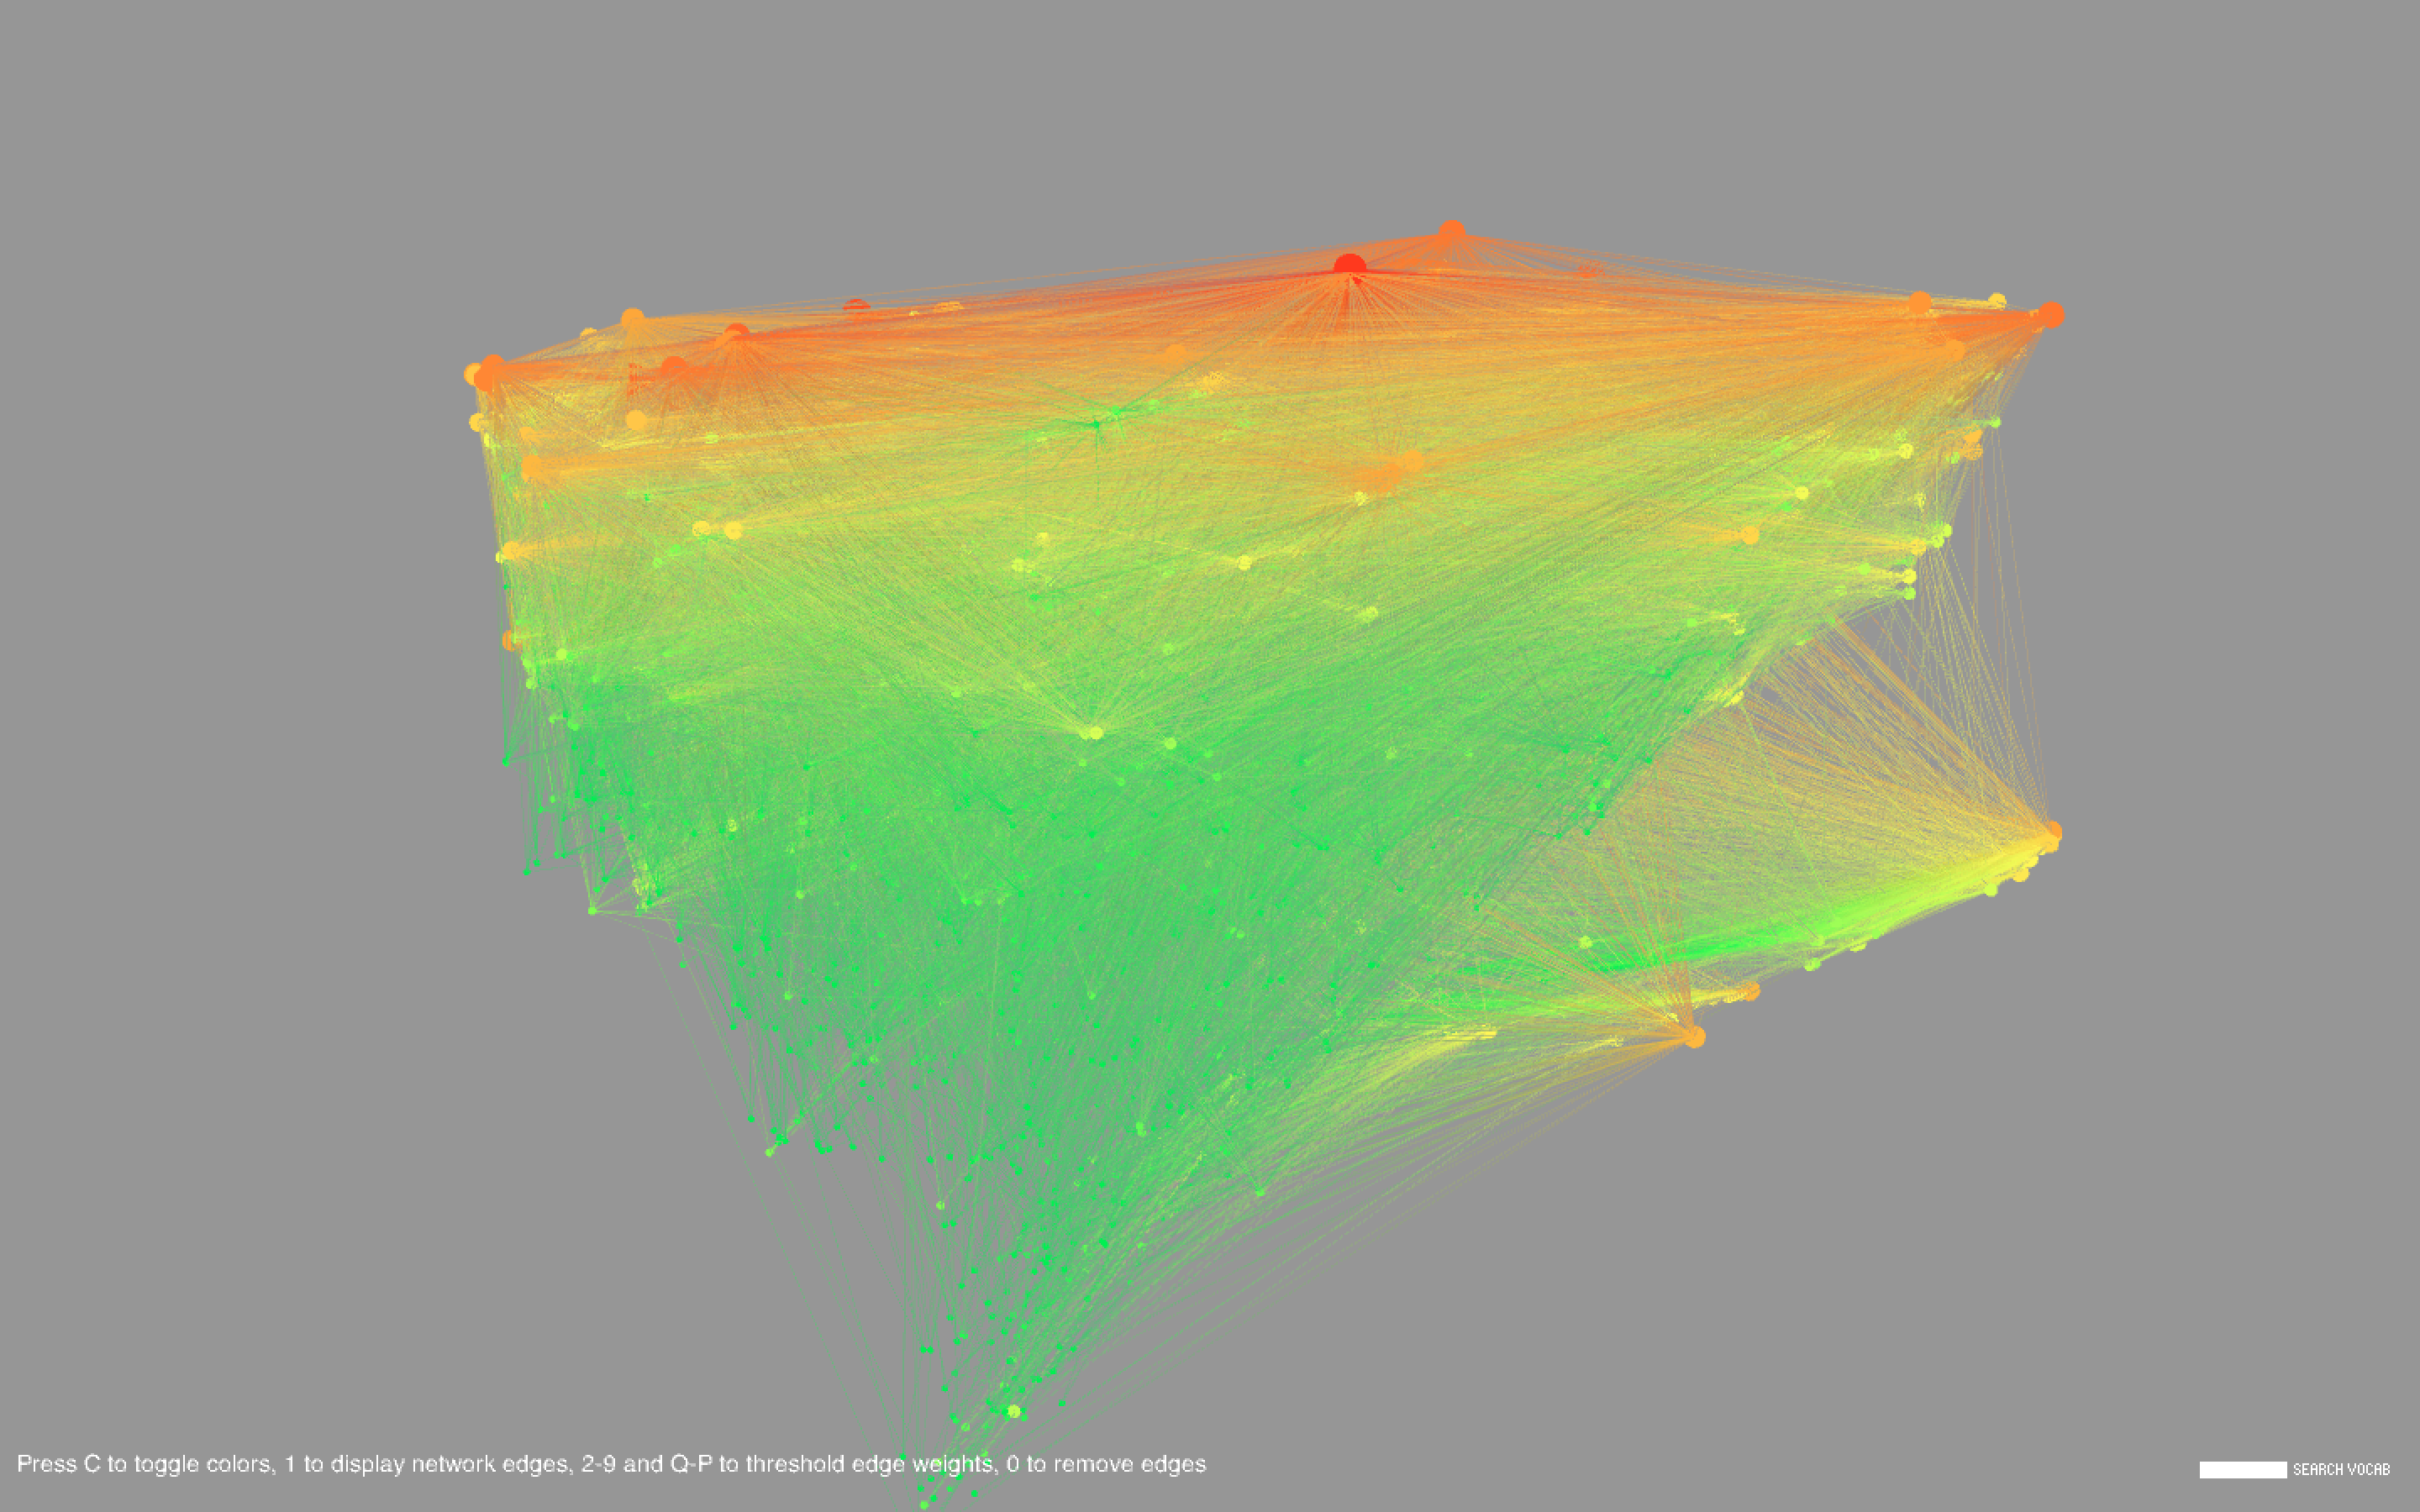
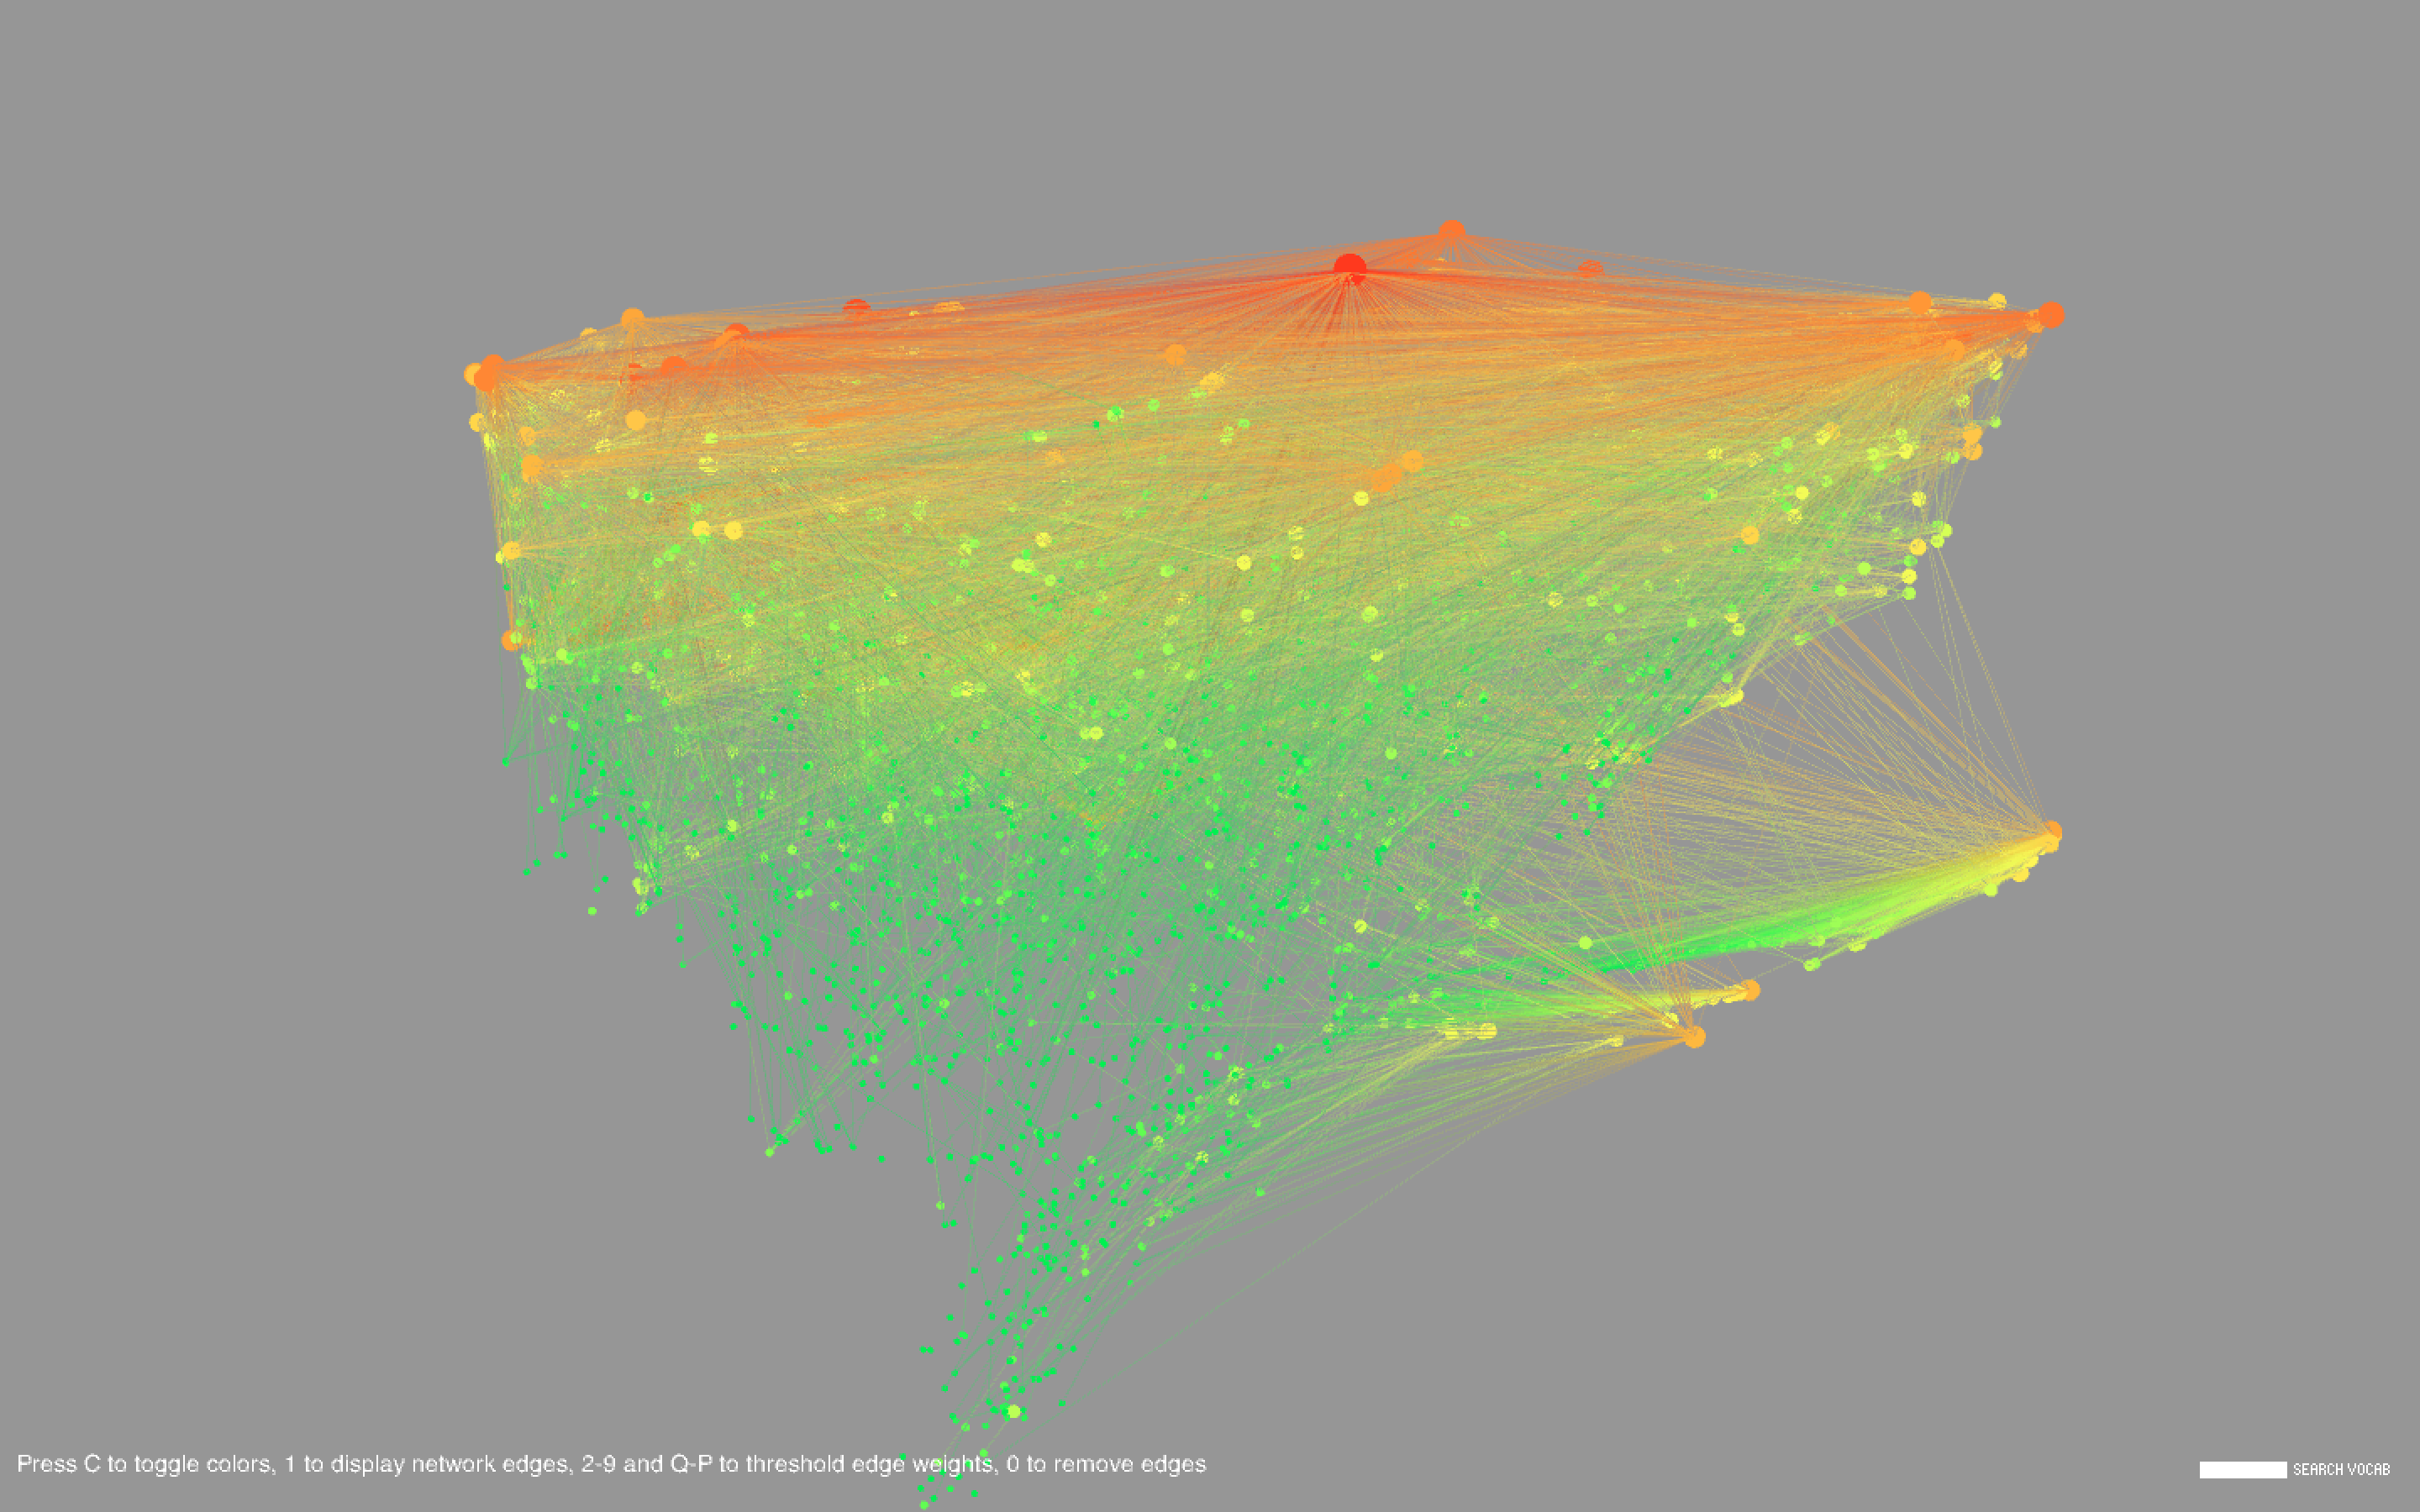
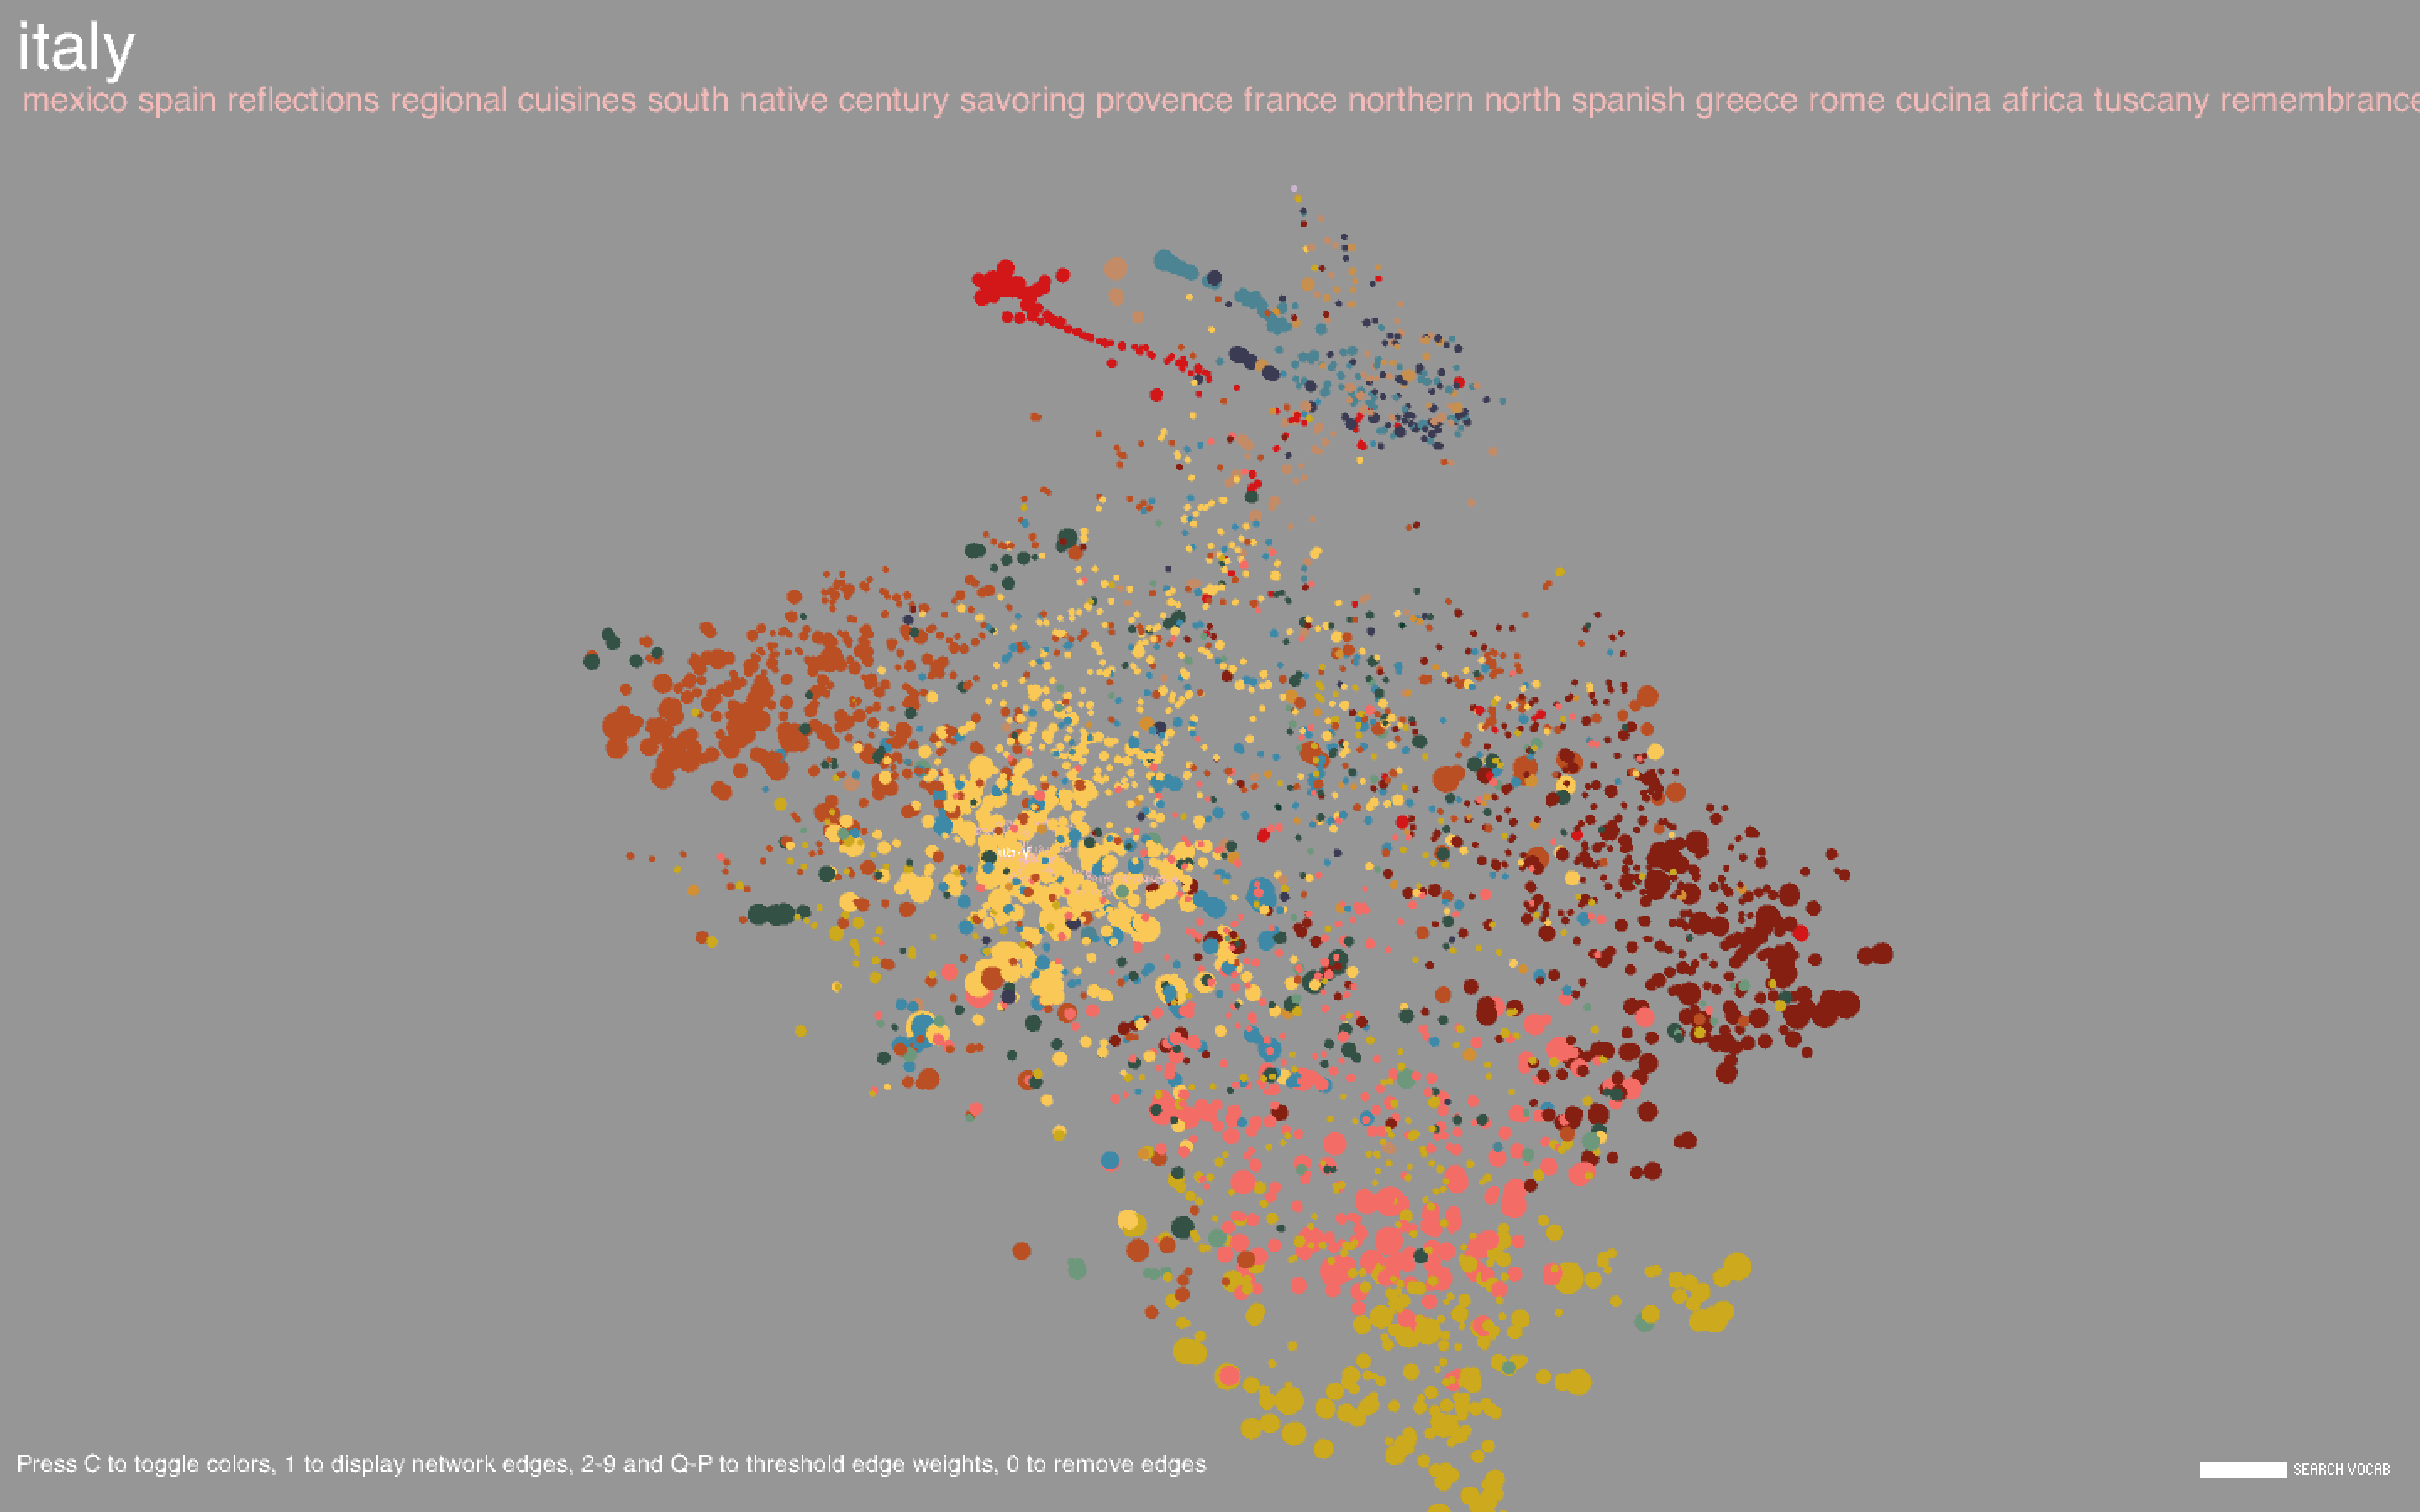
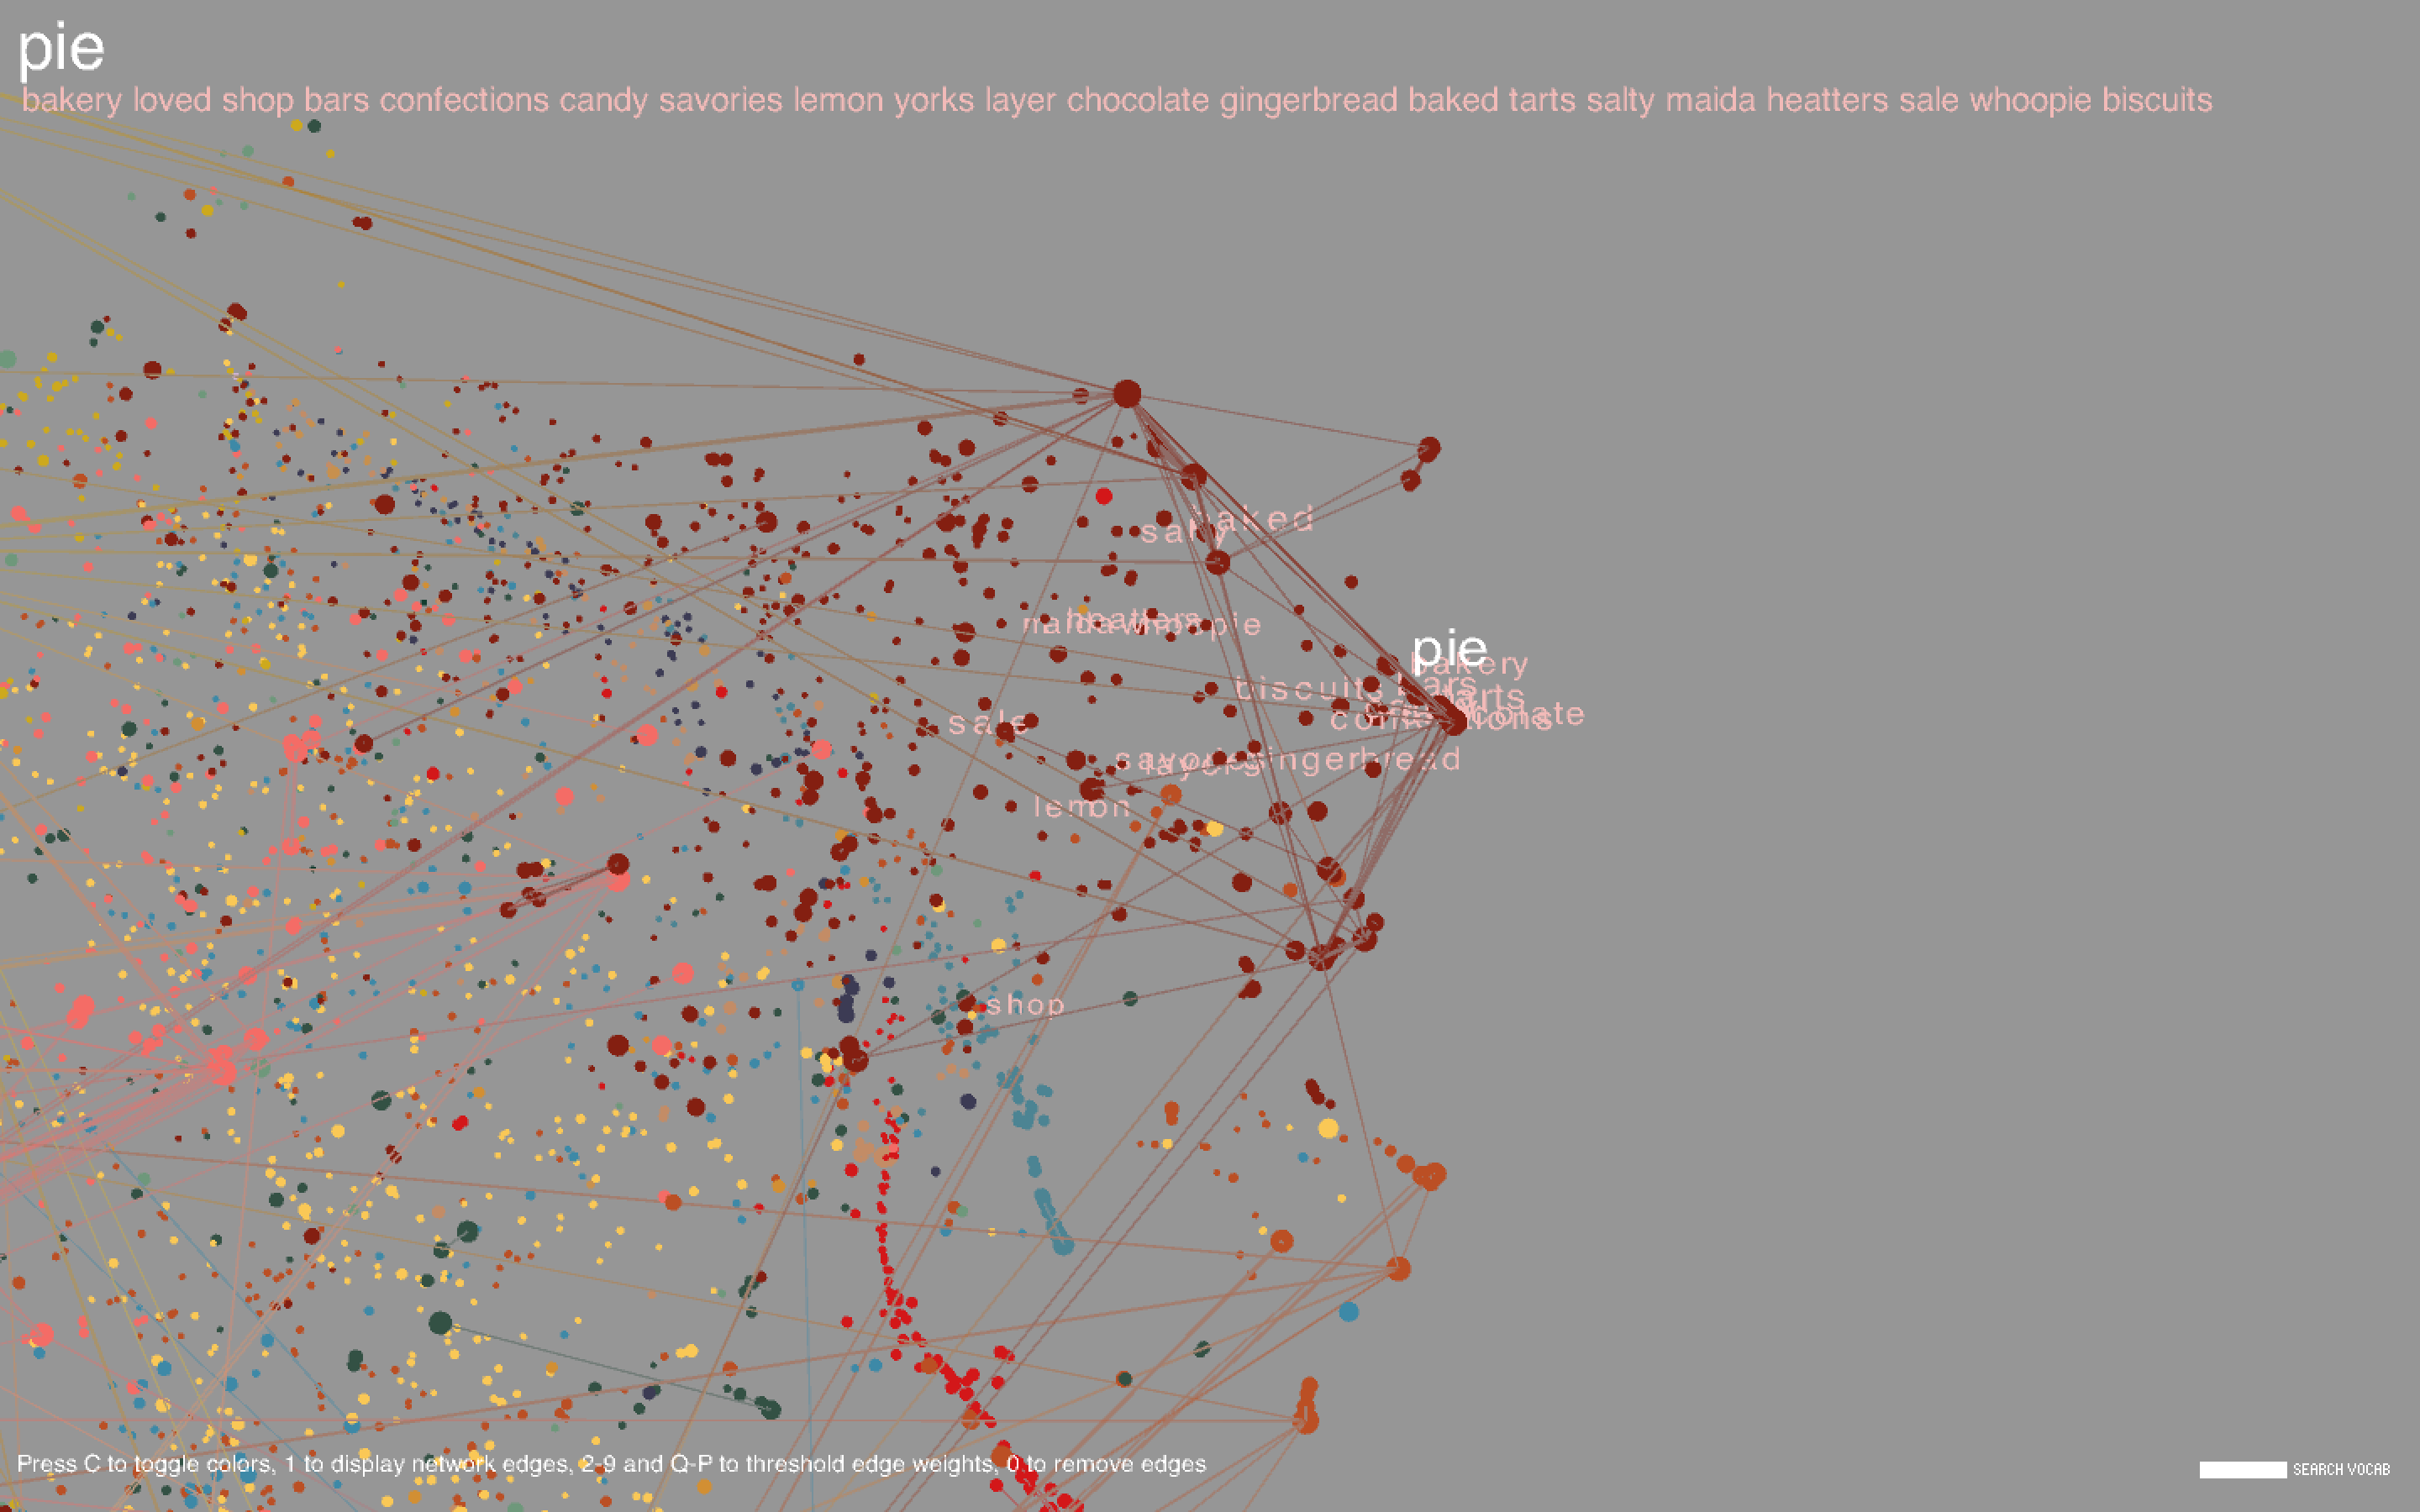
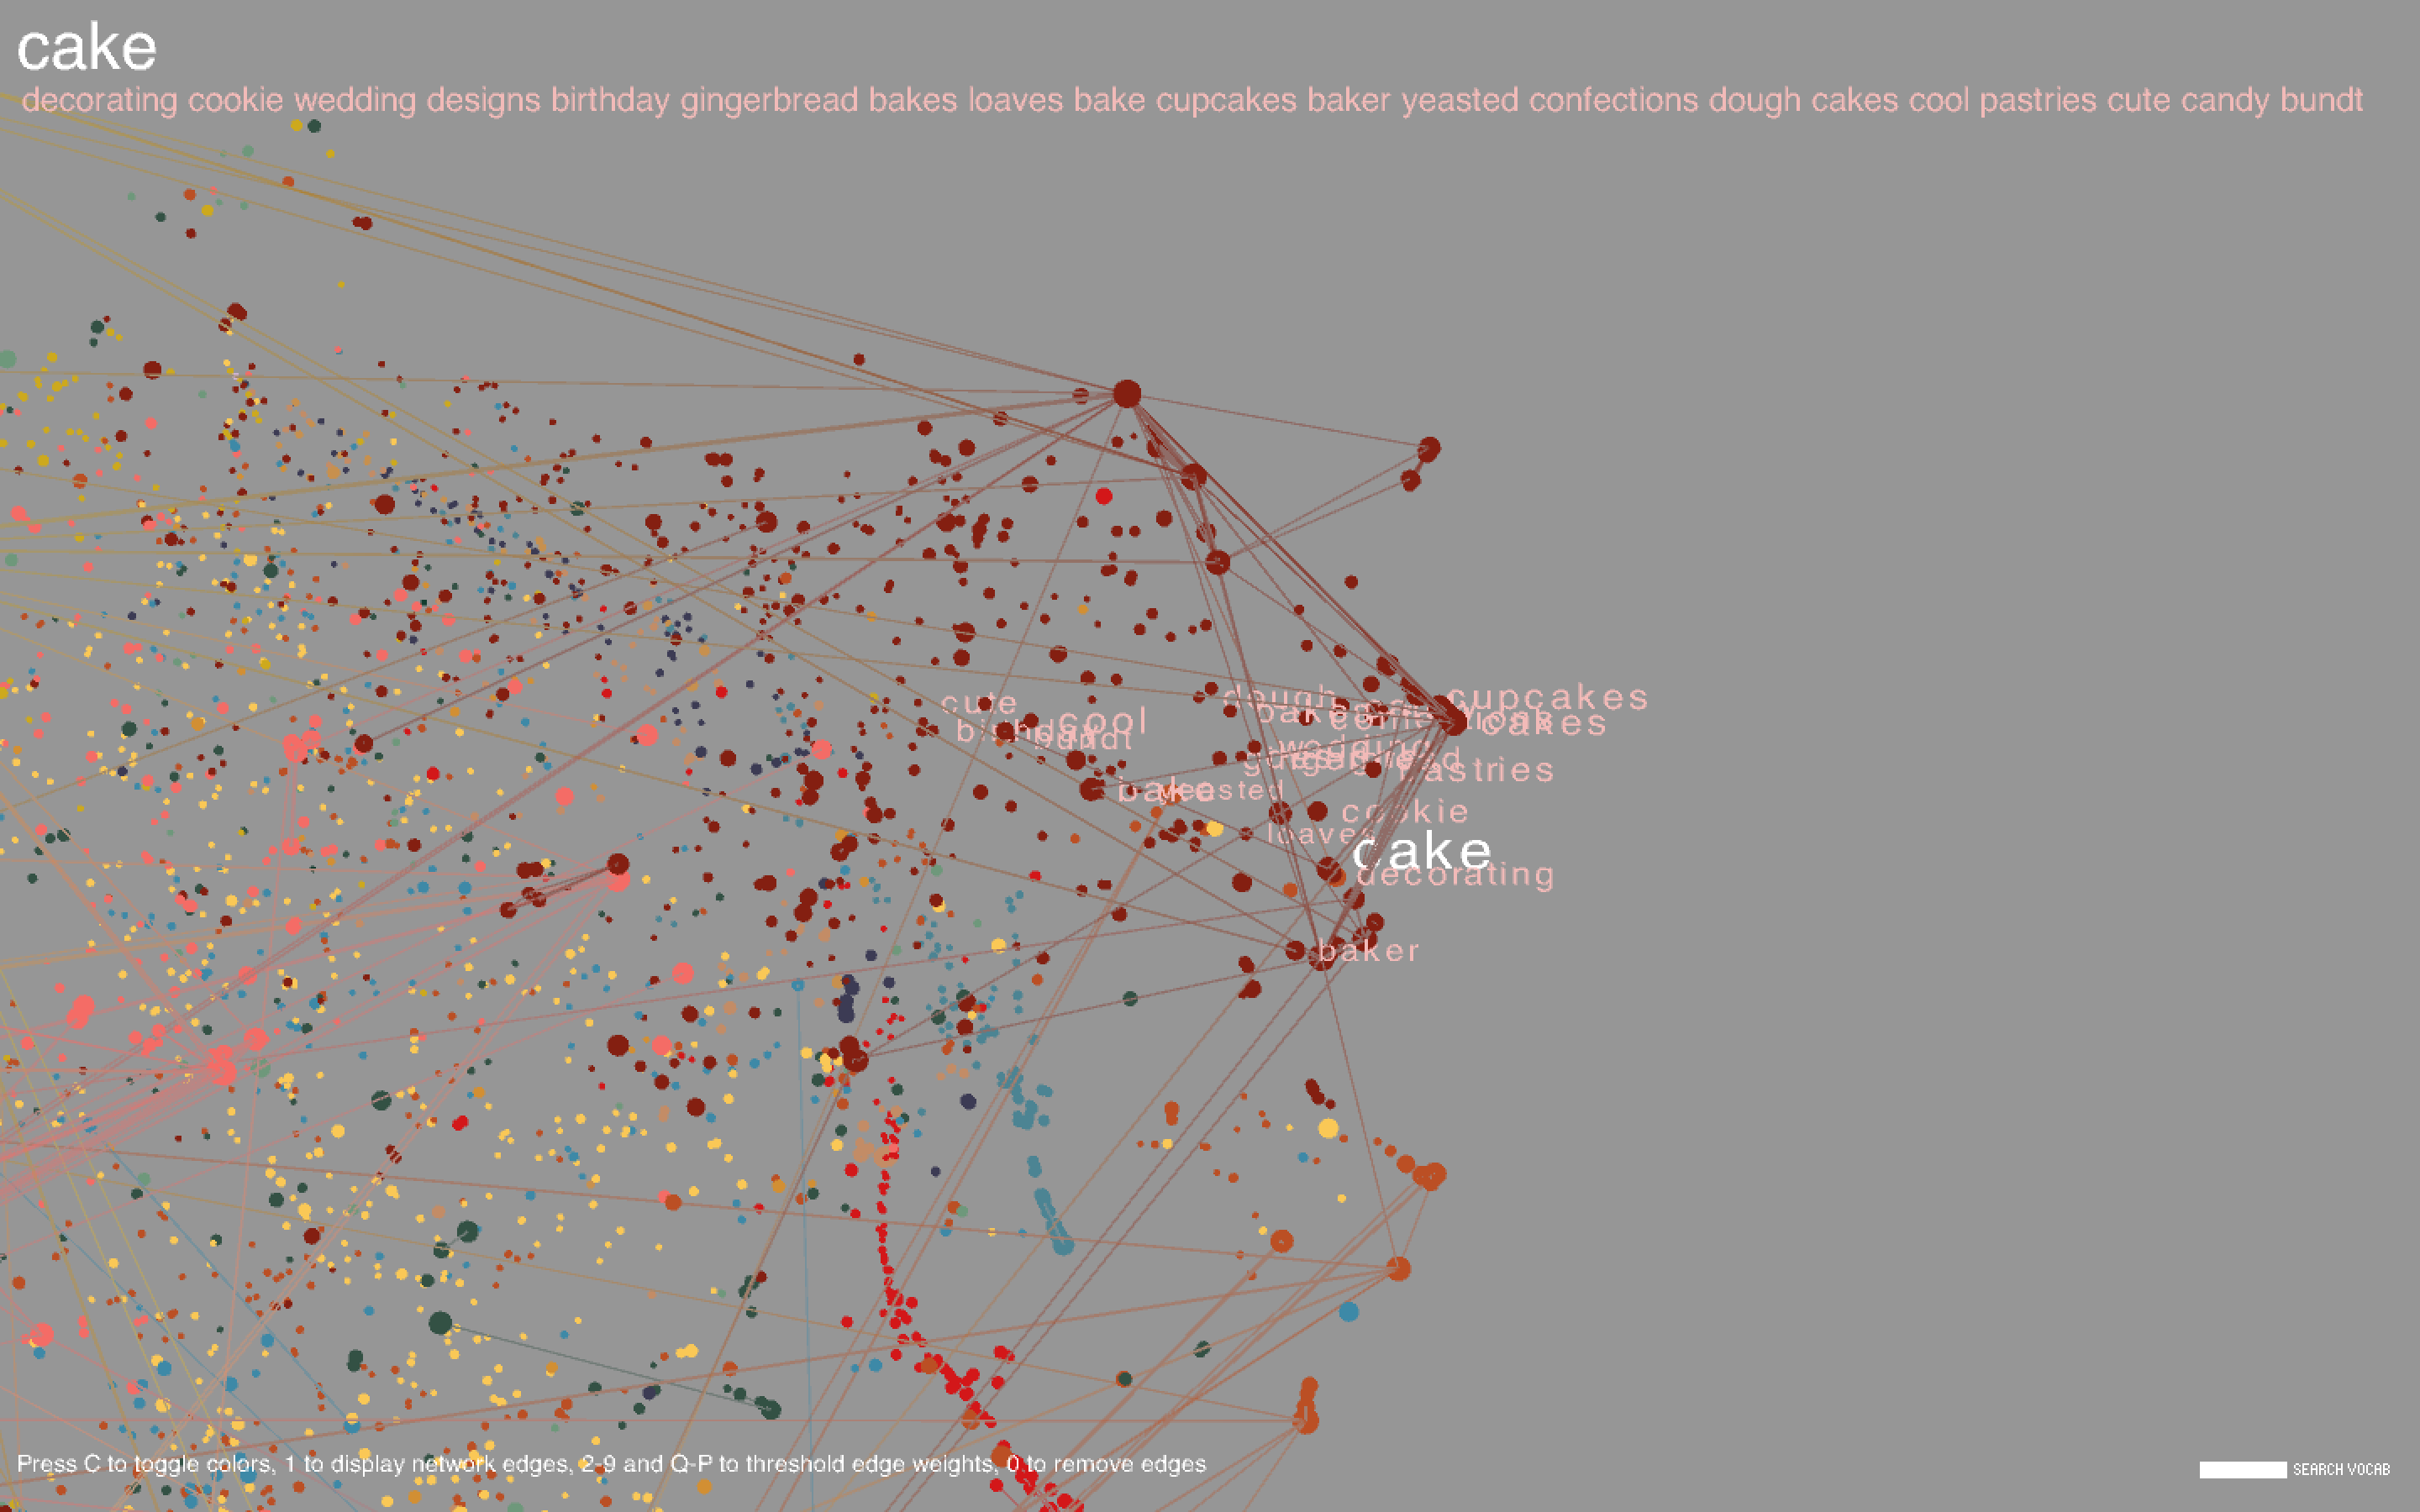
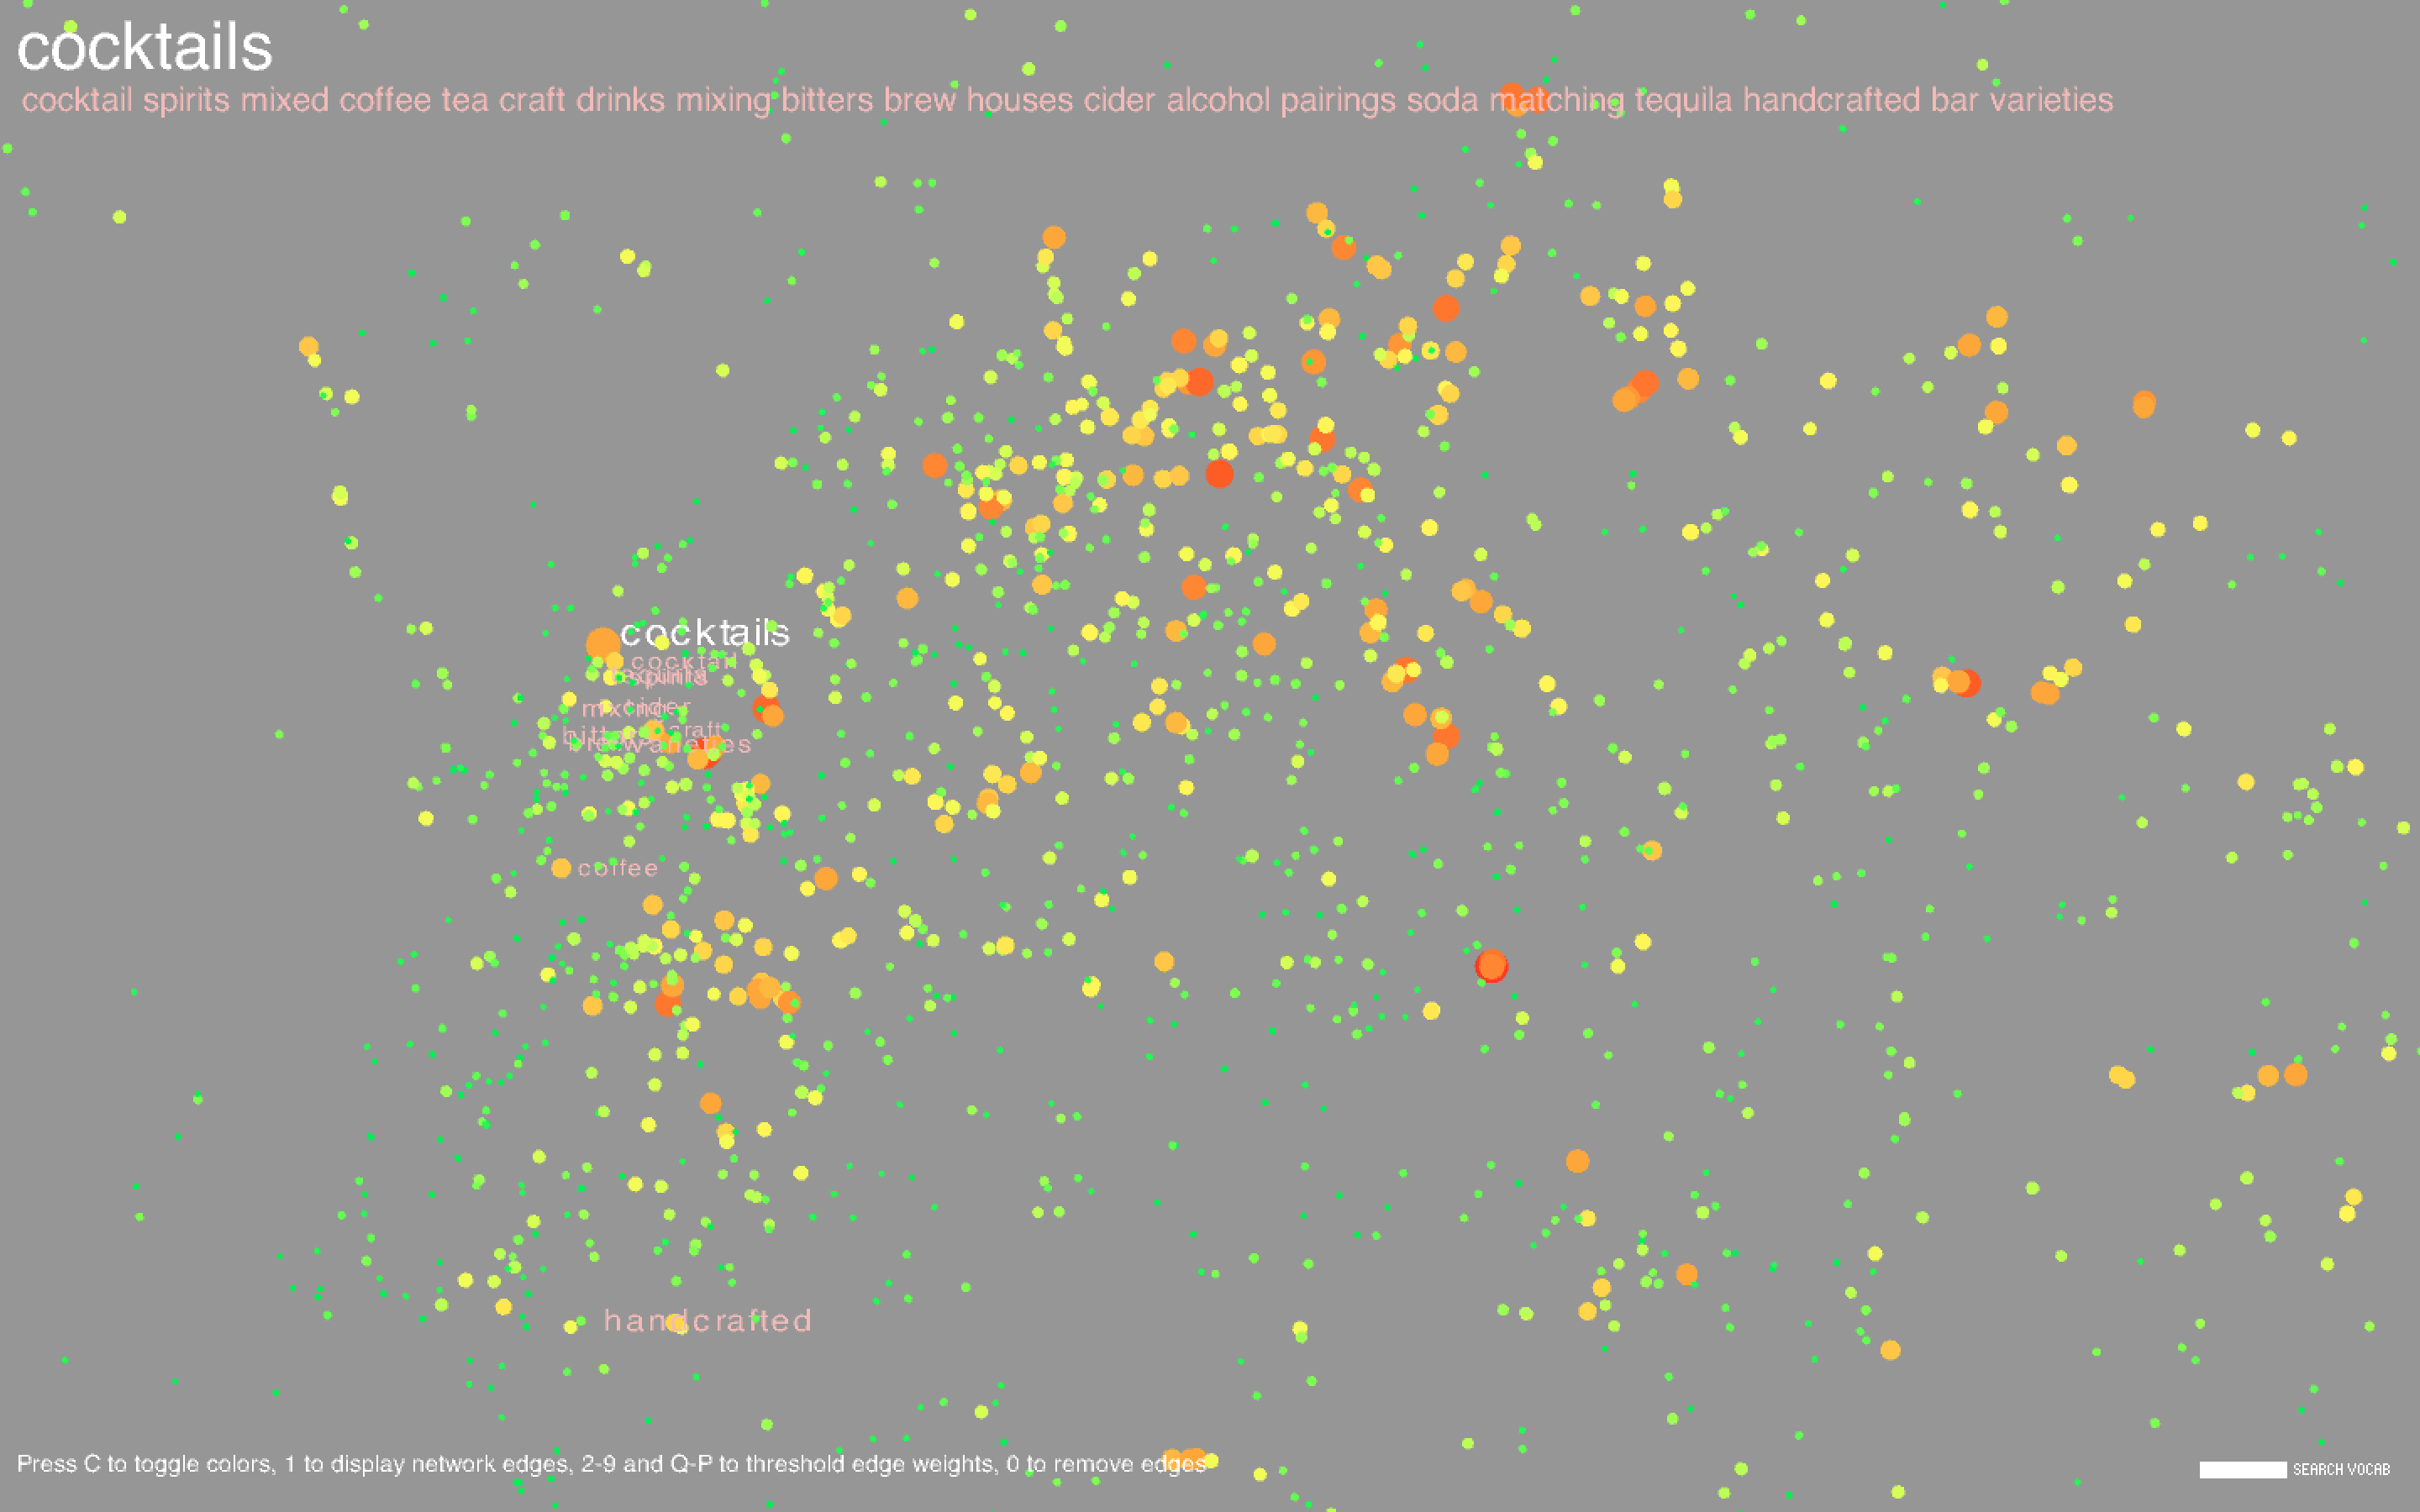
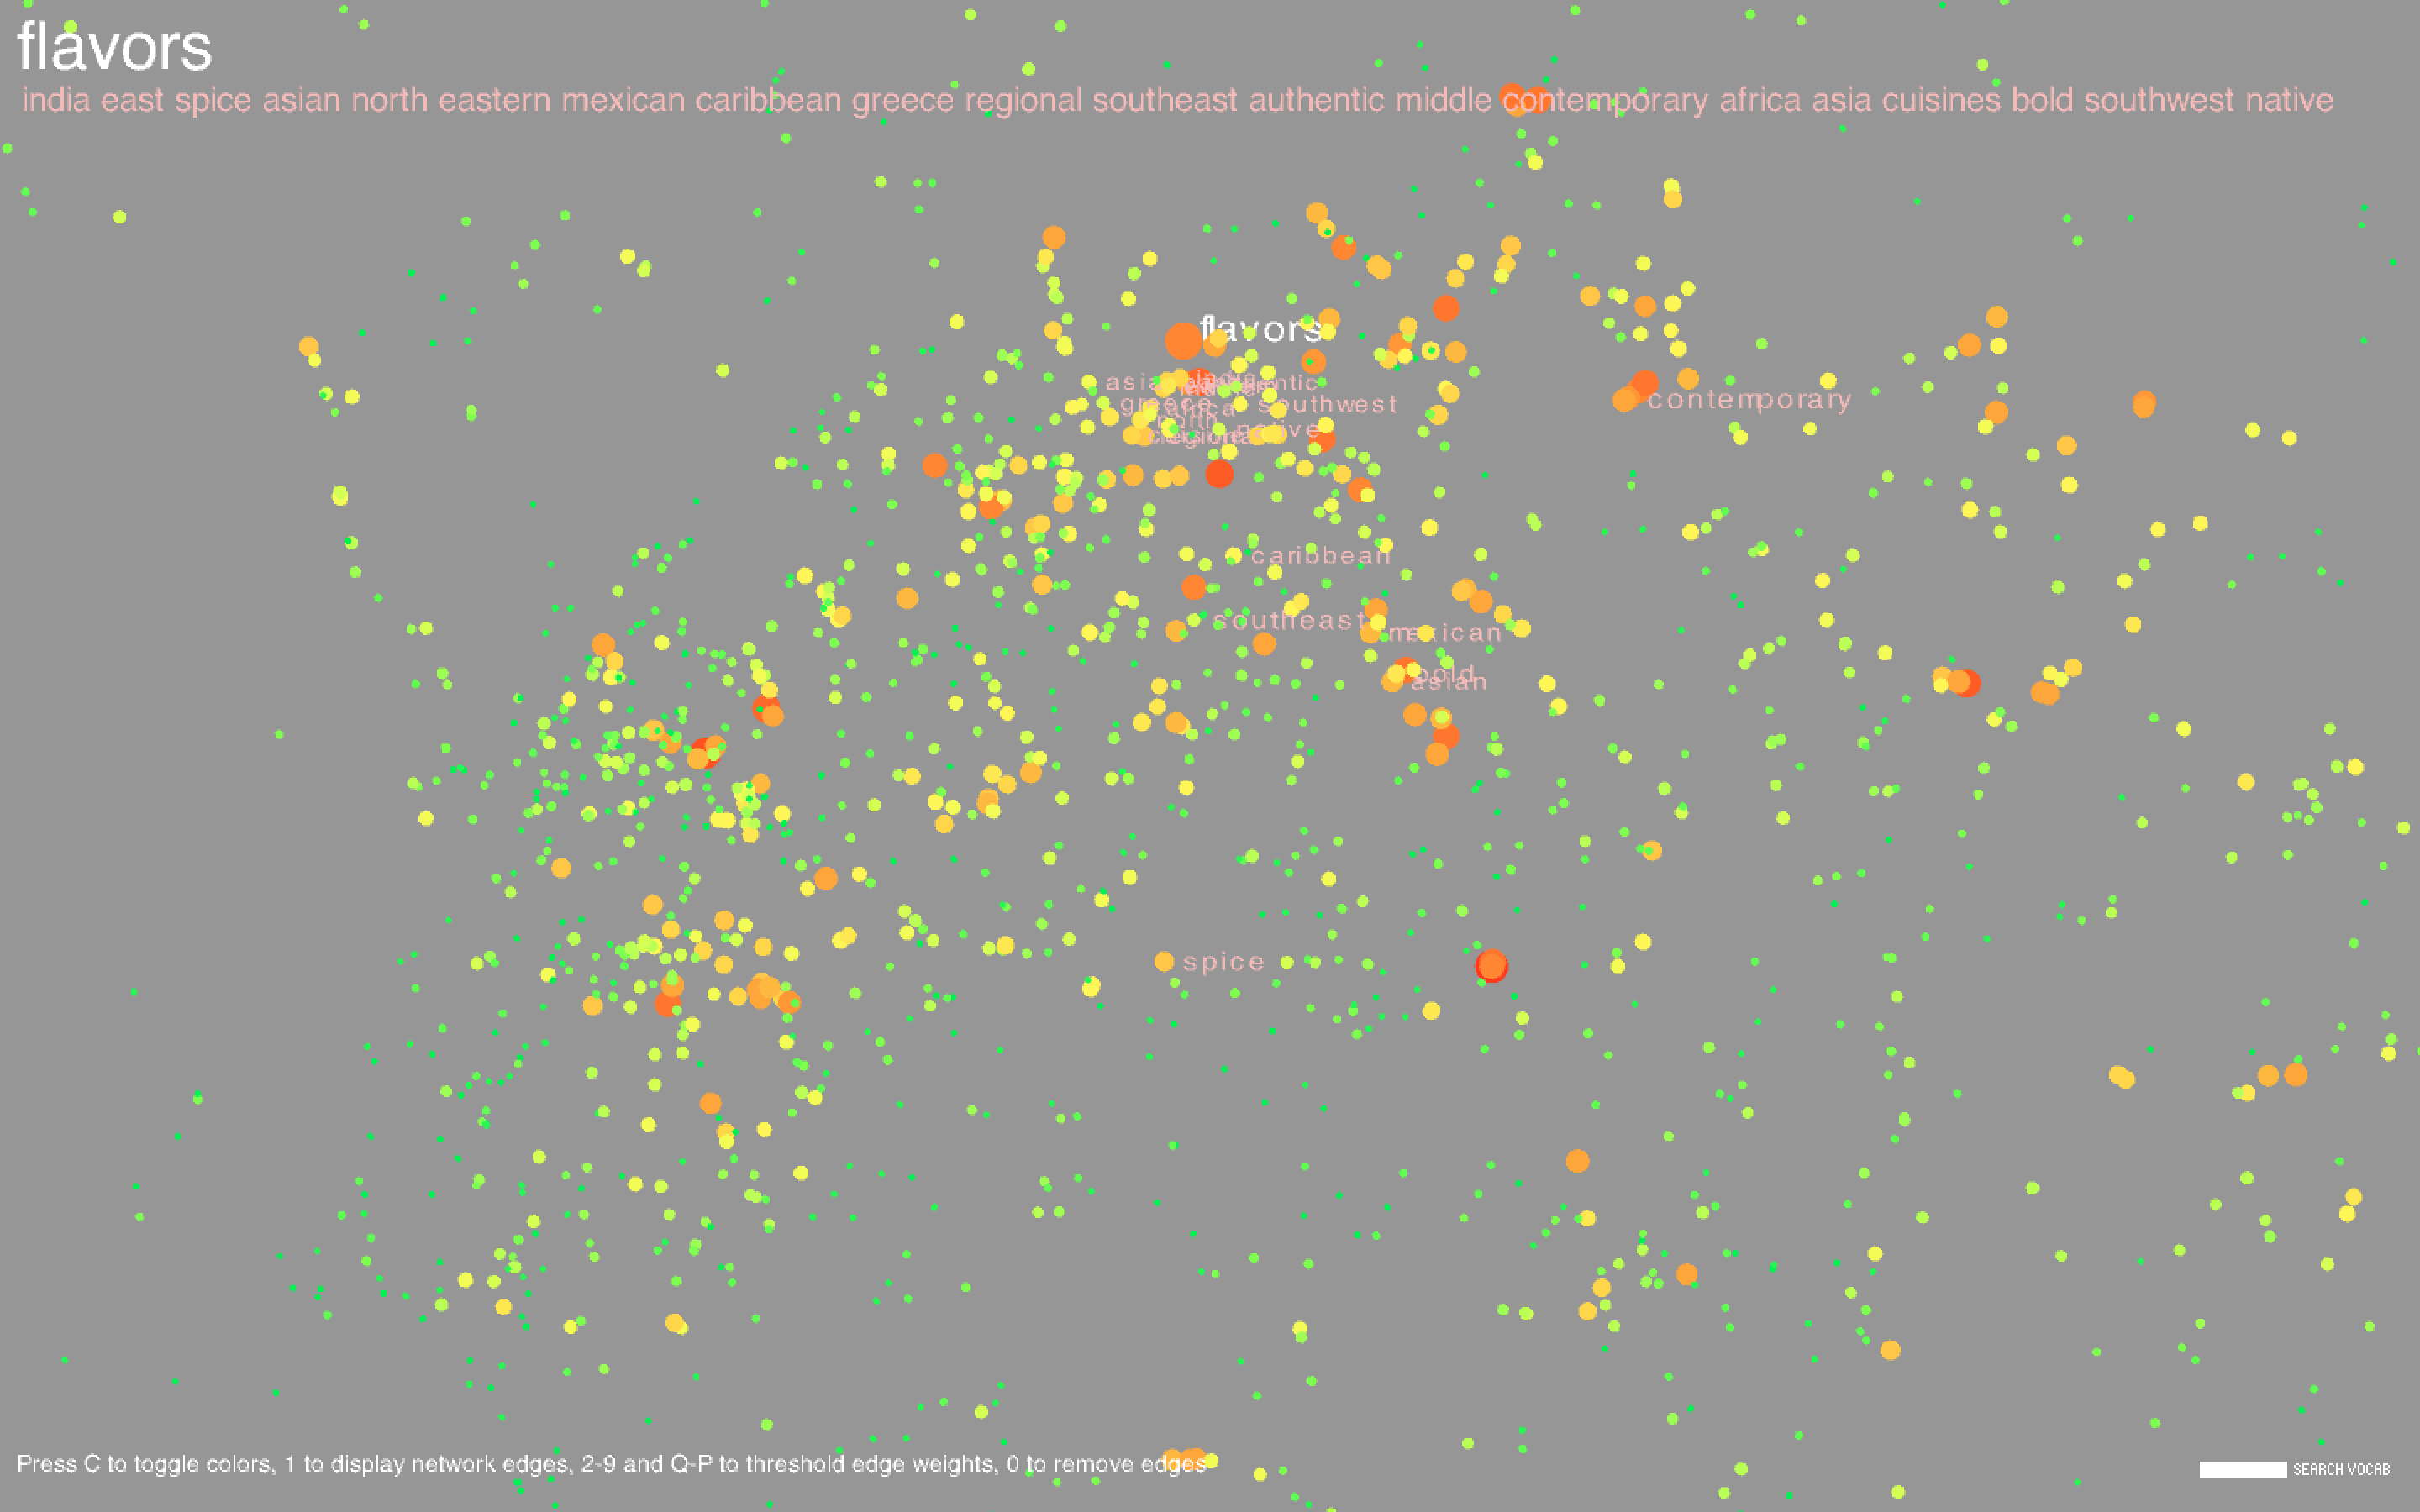
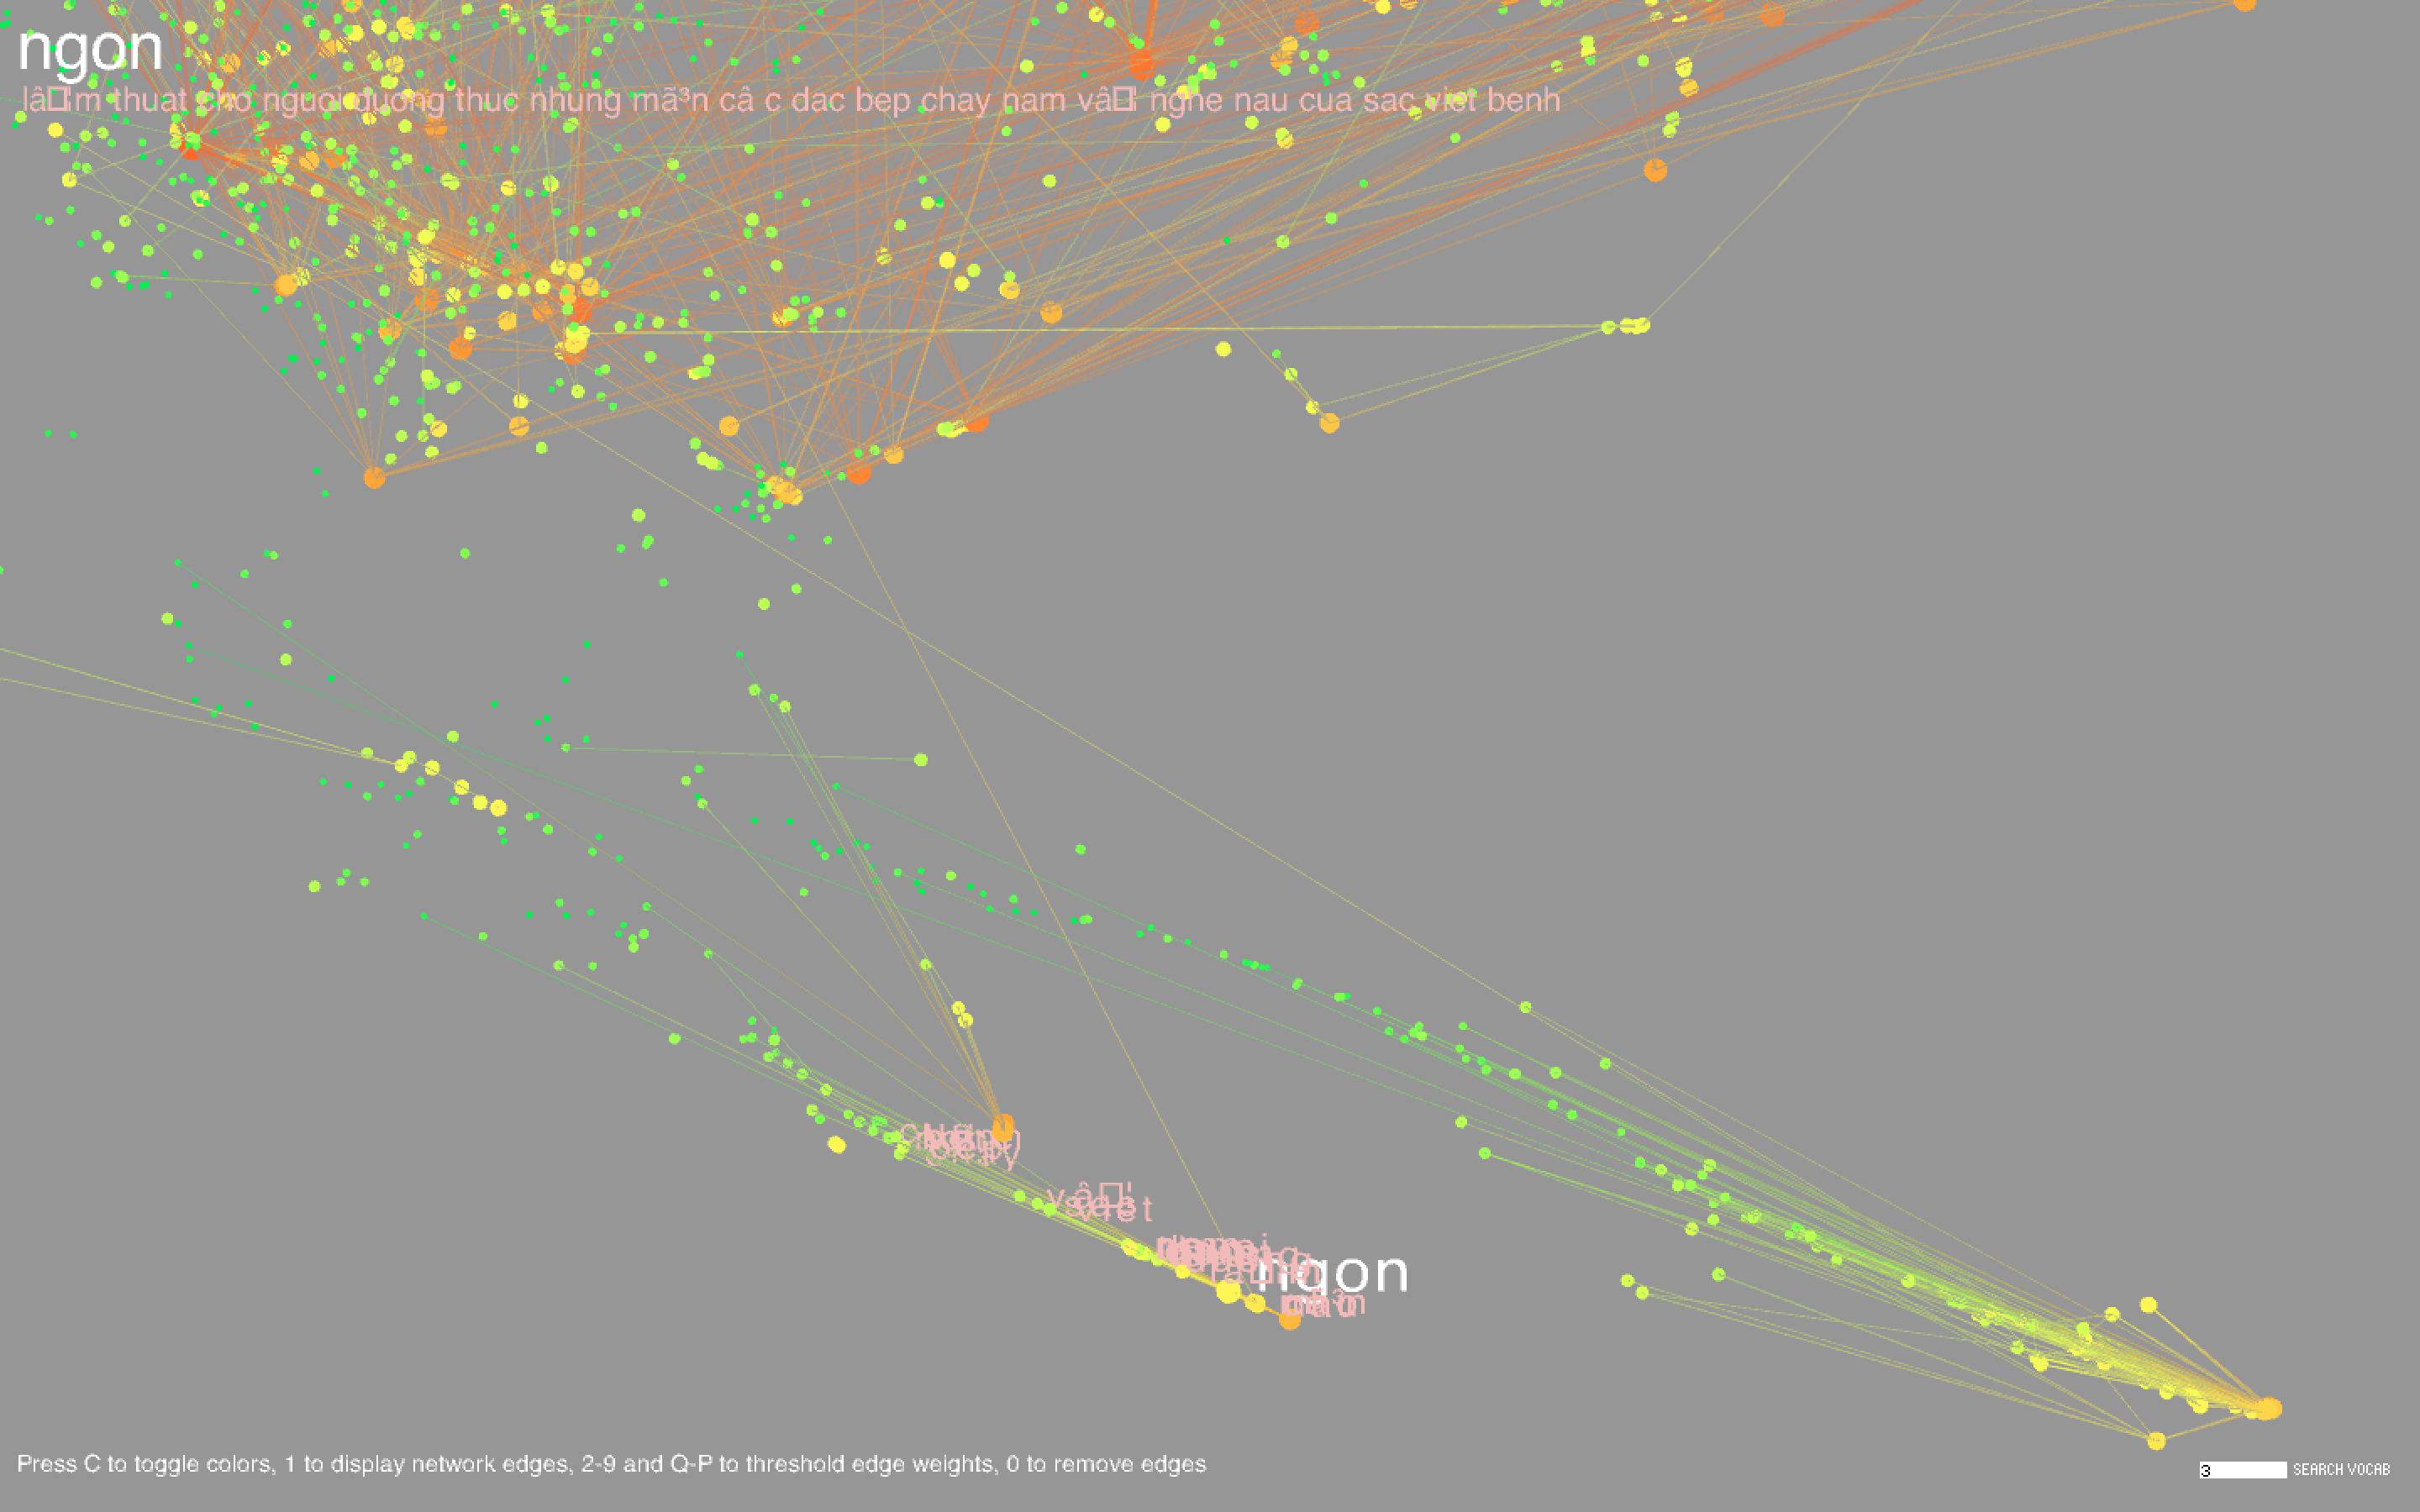
I plotted each word, represented as a circle, using the coordinates obtained in t-SNE. The size of the circle is proportional to the frequency of the word in the body of titles. I also showed the network edges, but the network is pretty dense, so by default they are hidden; pressing keys 1-9 or Q-P will show the edges where the corresponding key is an edge weight threshold (e.g. pressing 3 shows all edges with weight greater than or equal to 3, where the weight of an edge represents the number of co-occurrences of the two words connected by the edge, and Q-P represent threshold values of 10-19). Pressing 0 will hide the edges. Pressing C will toggle the color scheme between the frequency-based color mode, in which the colors are proportional to the respective frequencies of the words amongst the entire set of titles, and the community-based color mode, where nodes of the same color indicate that they belong to the same community.
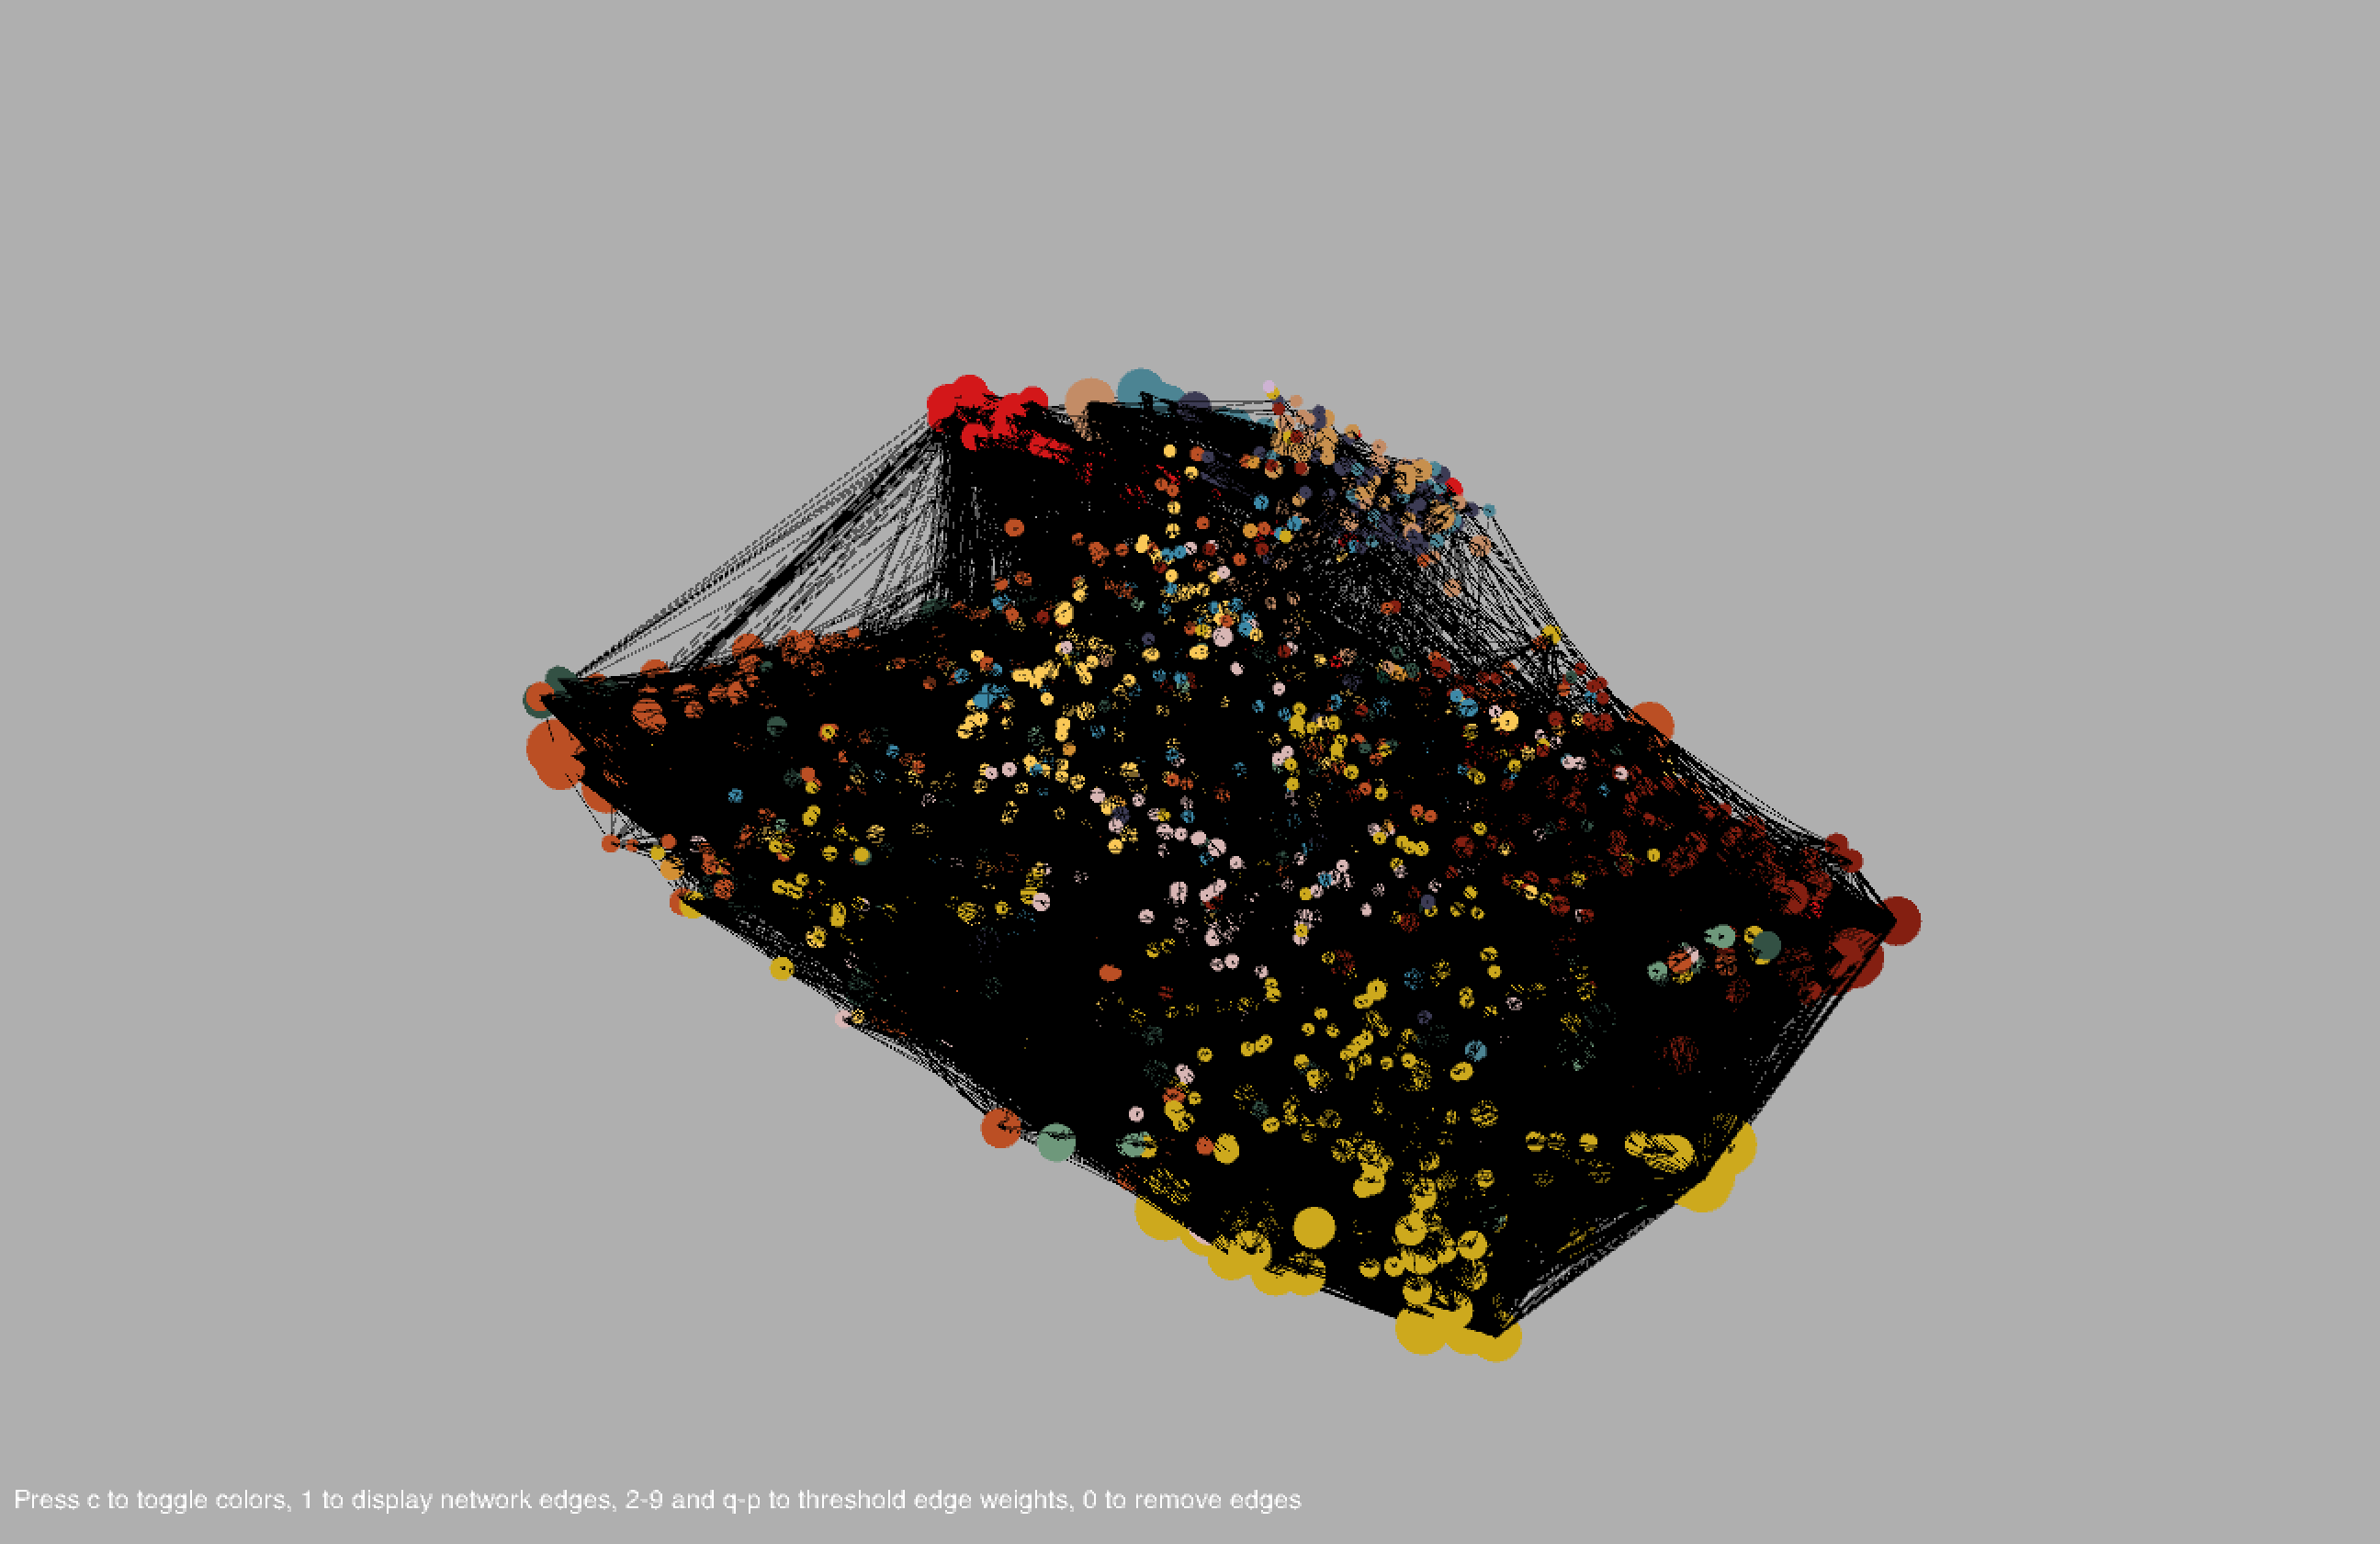
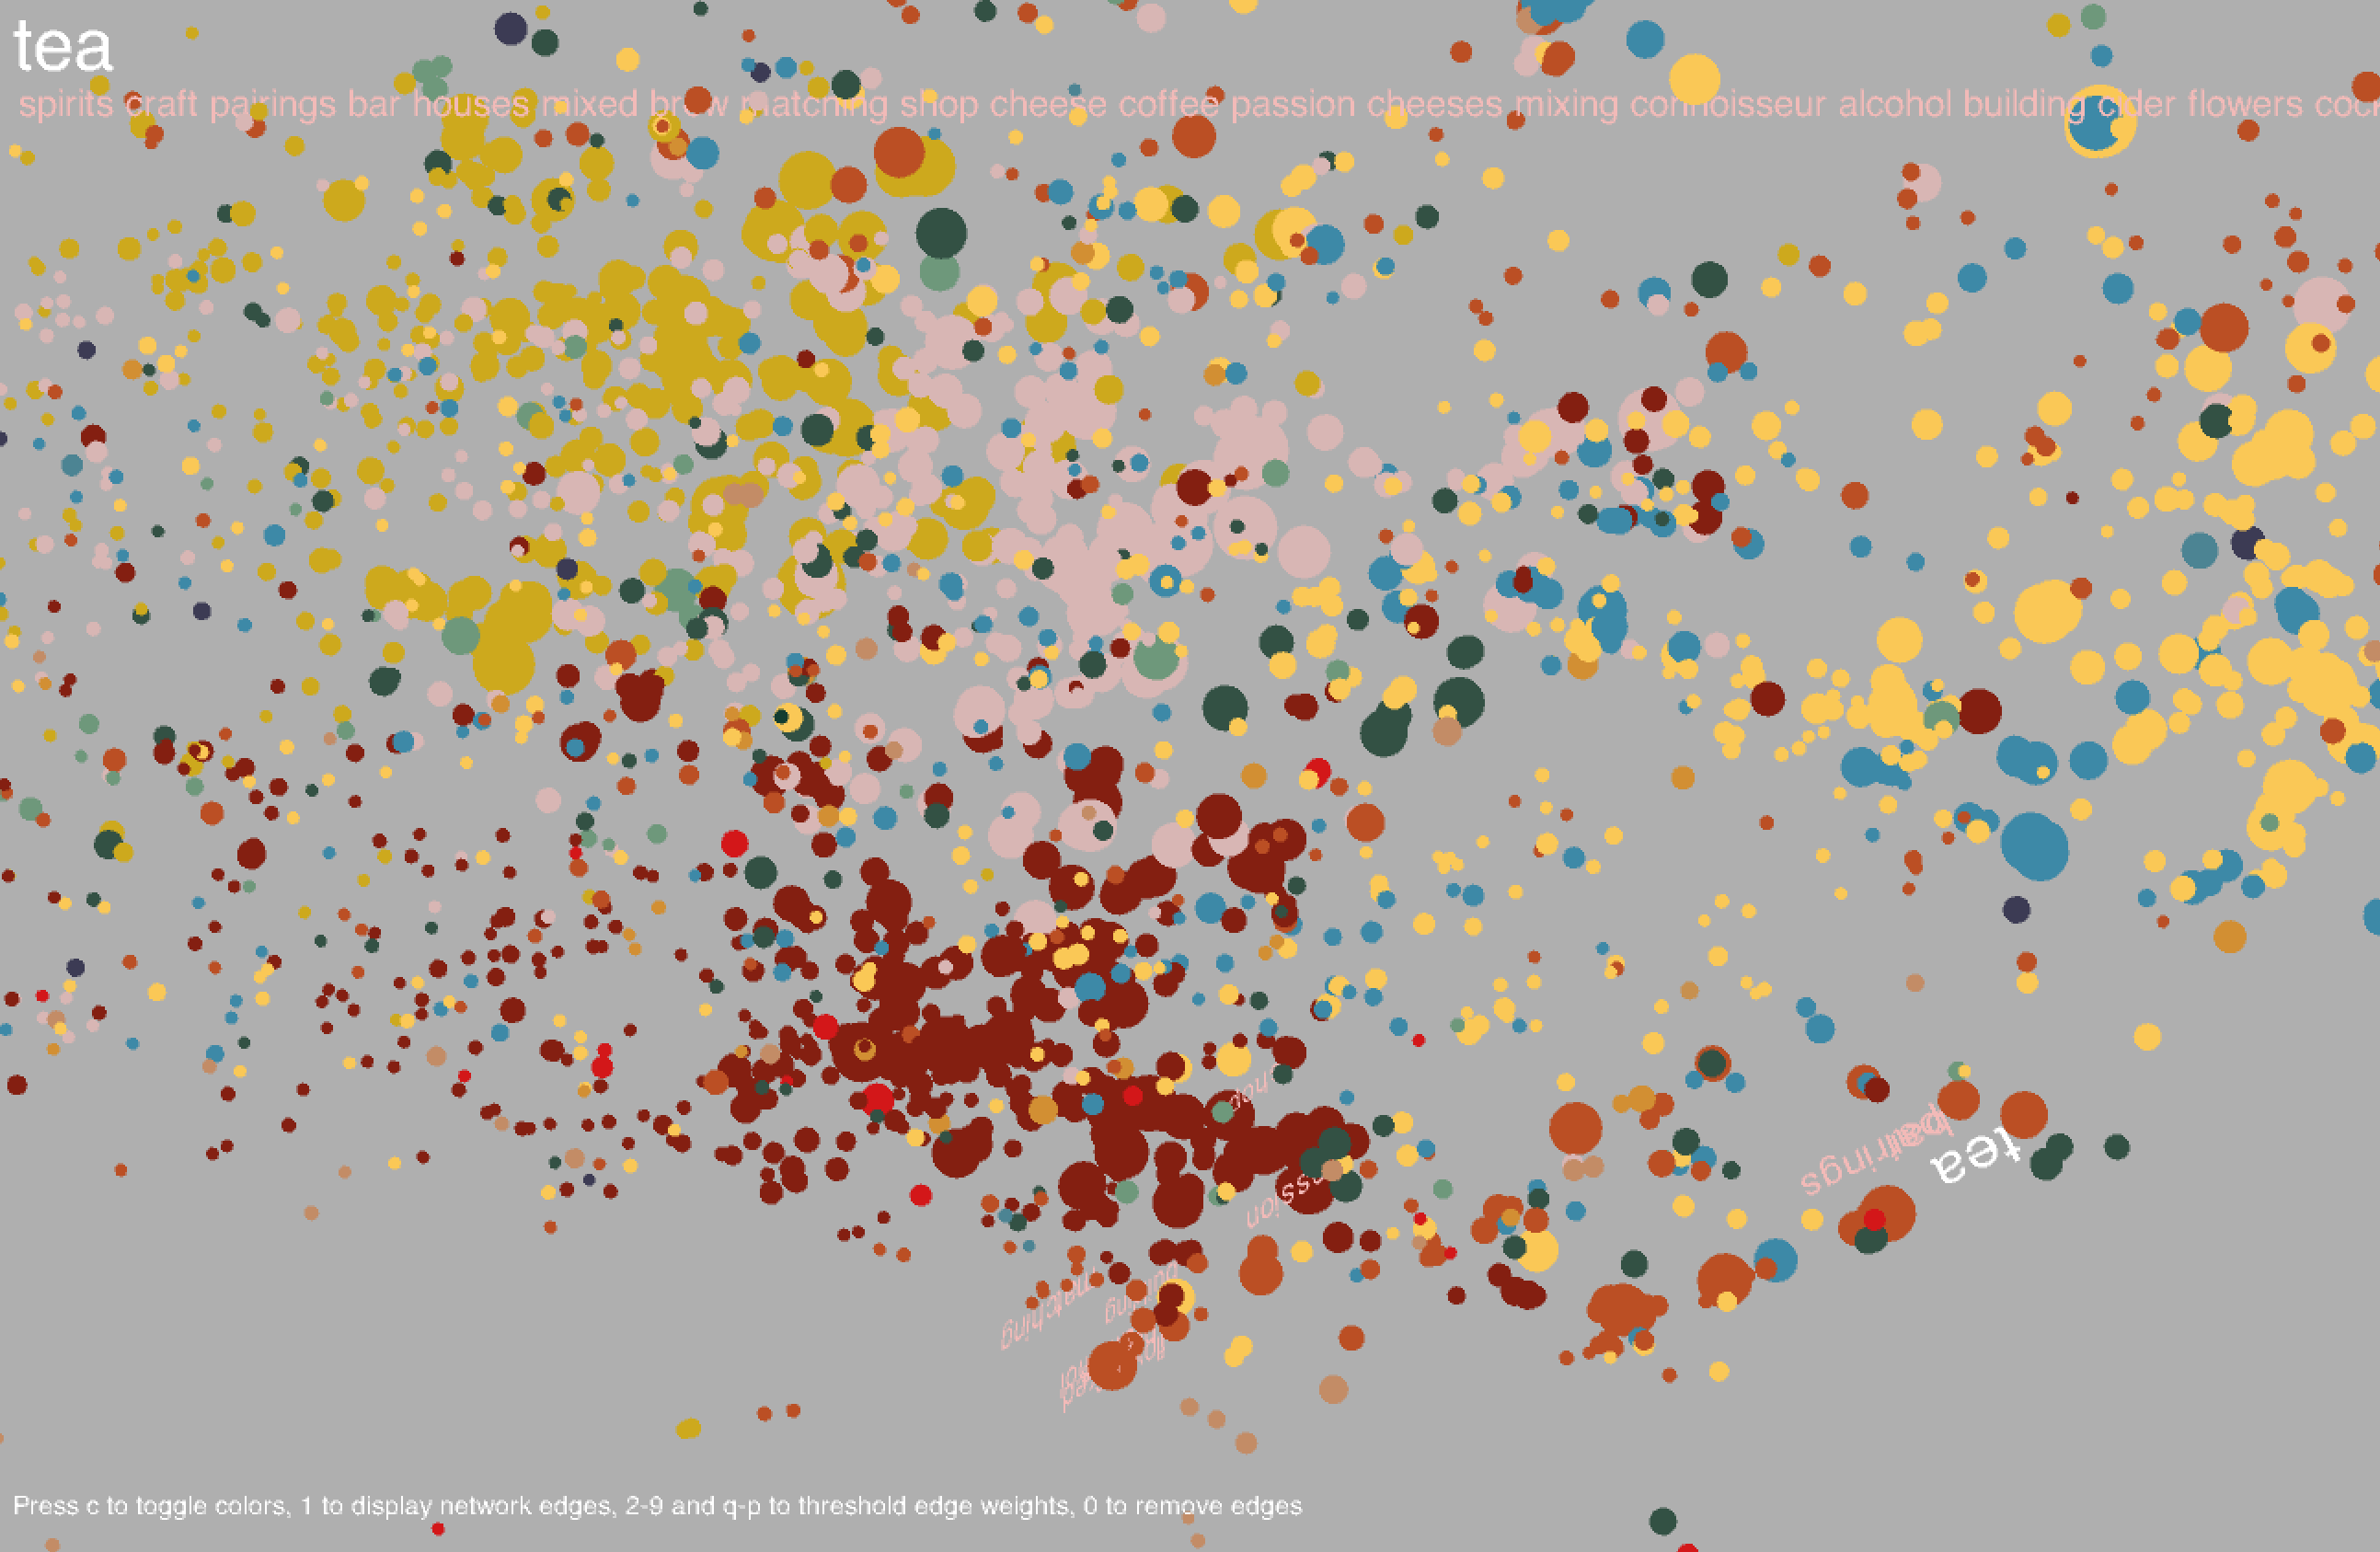
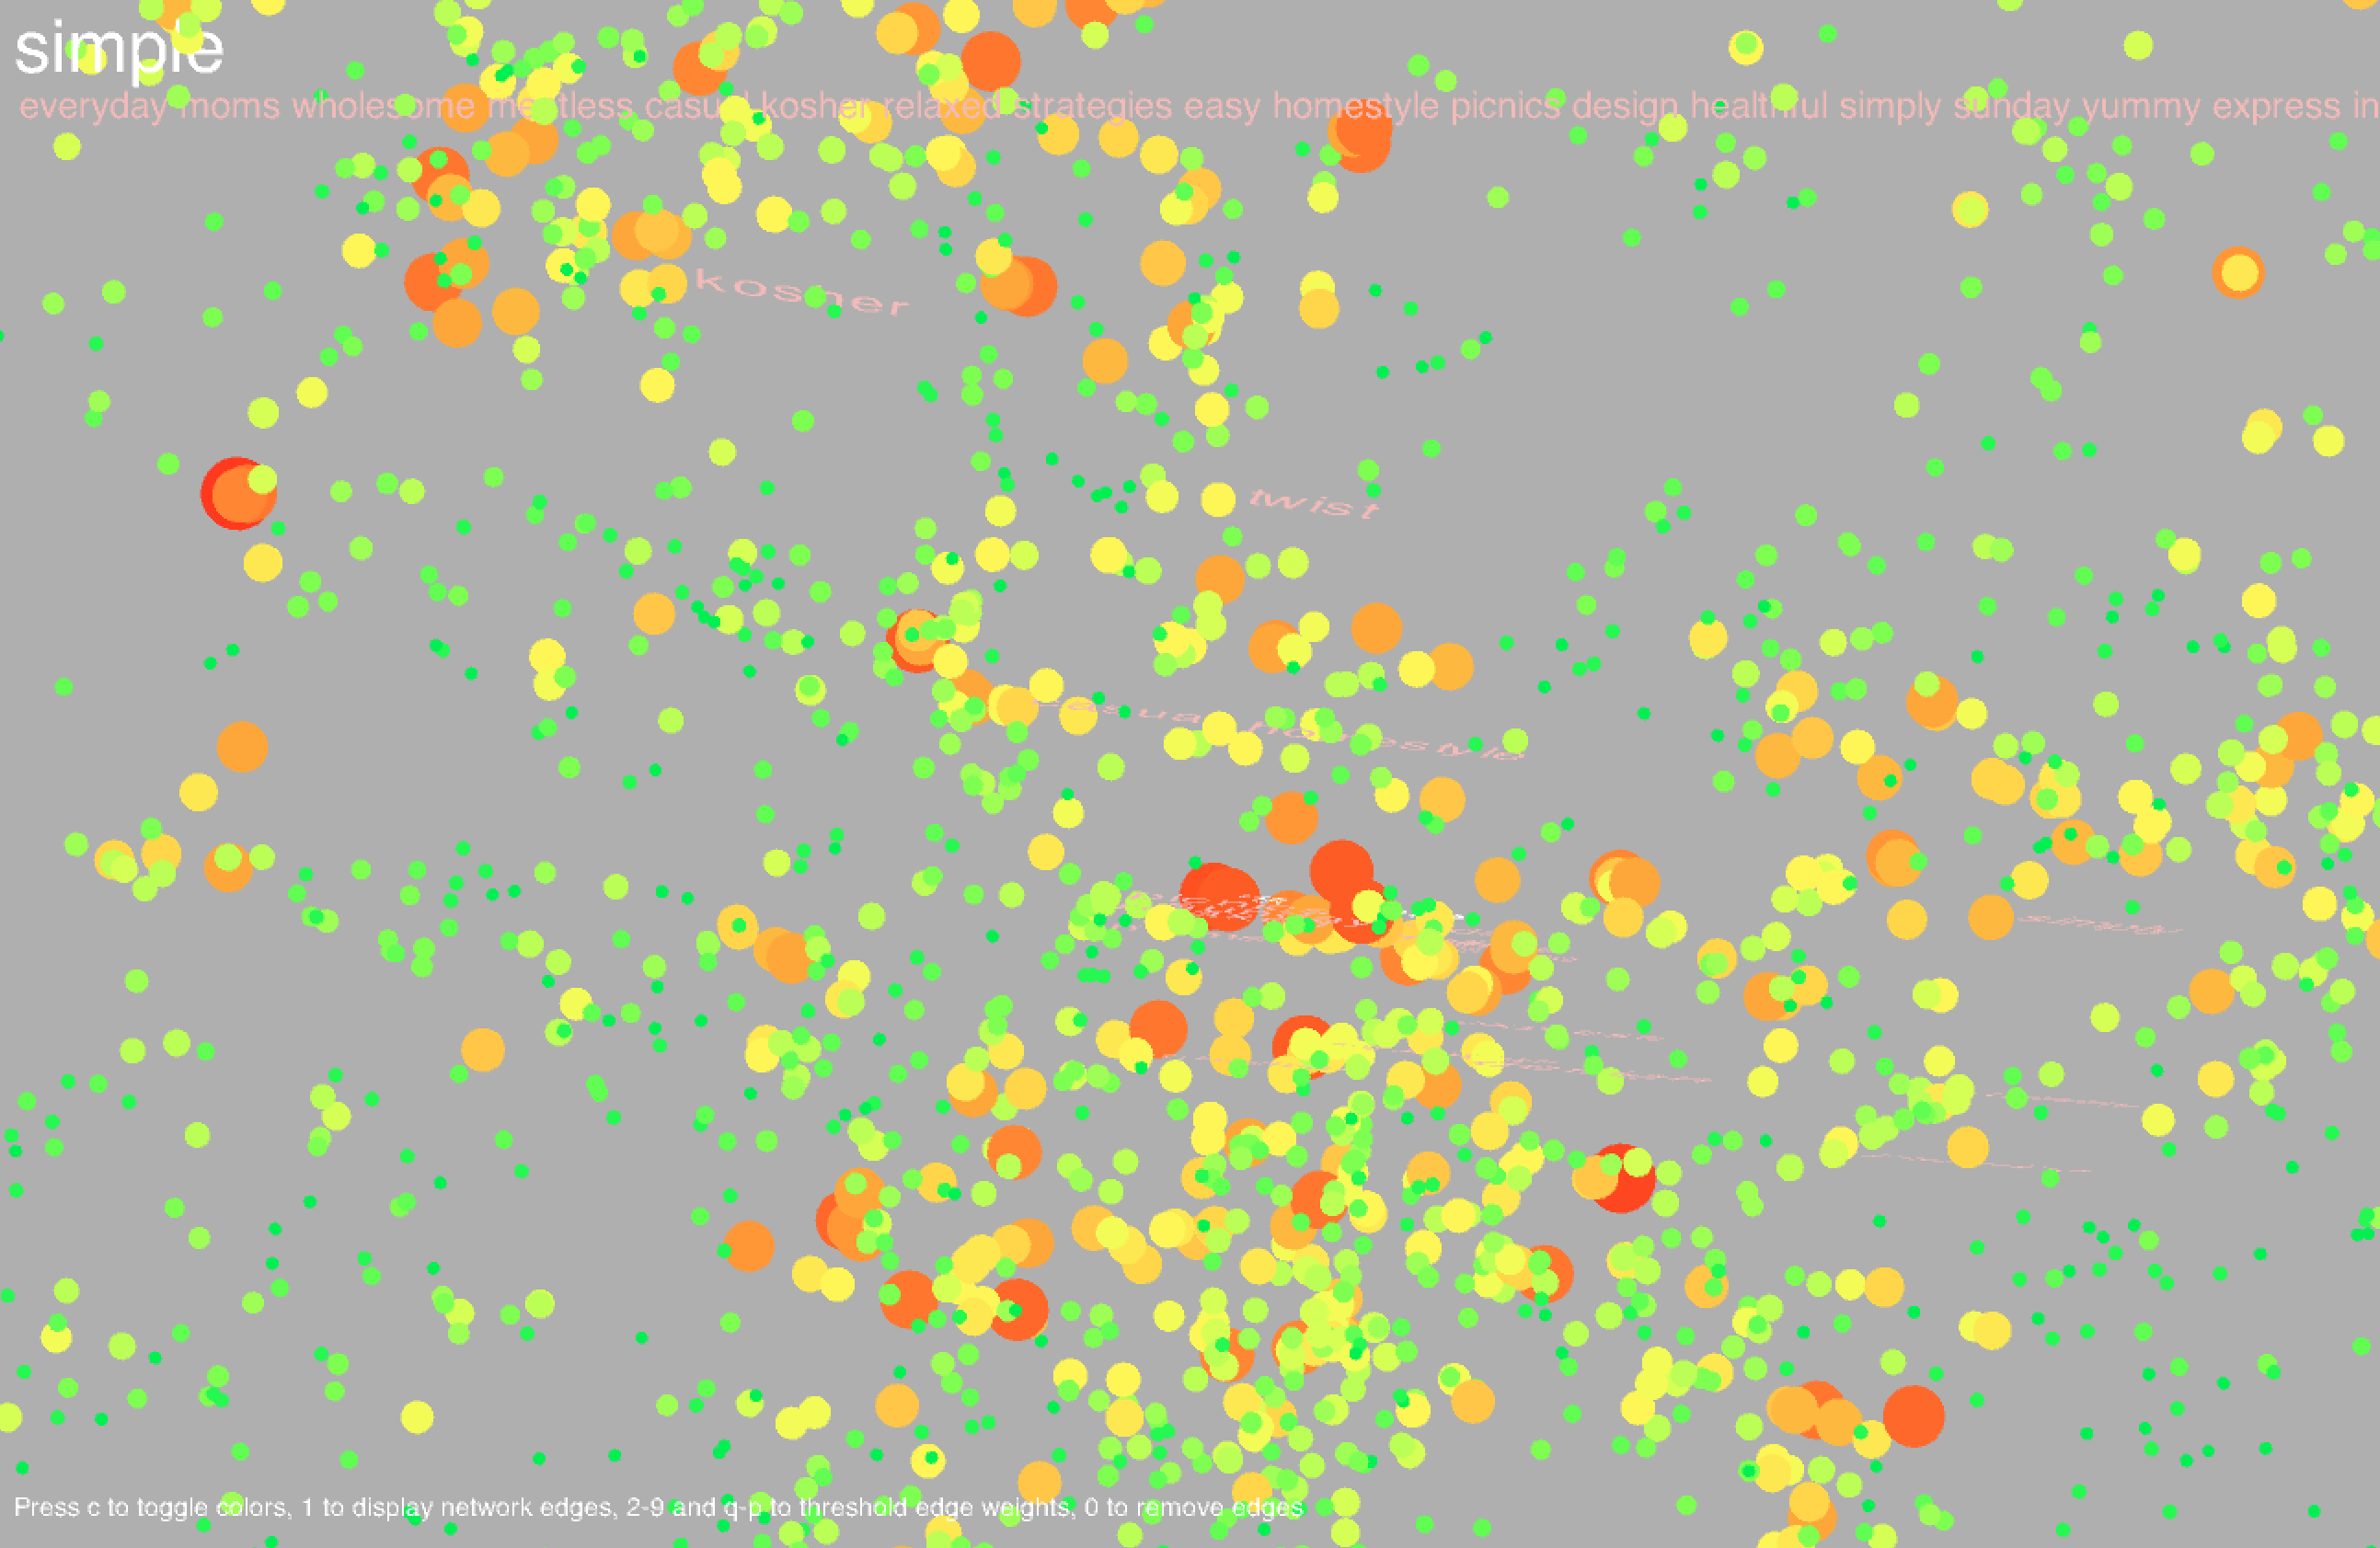
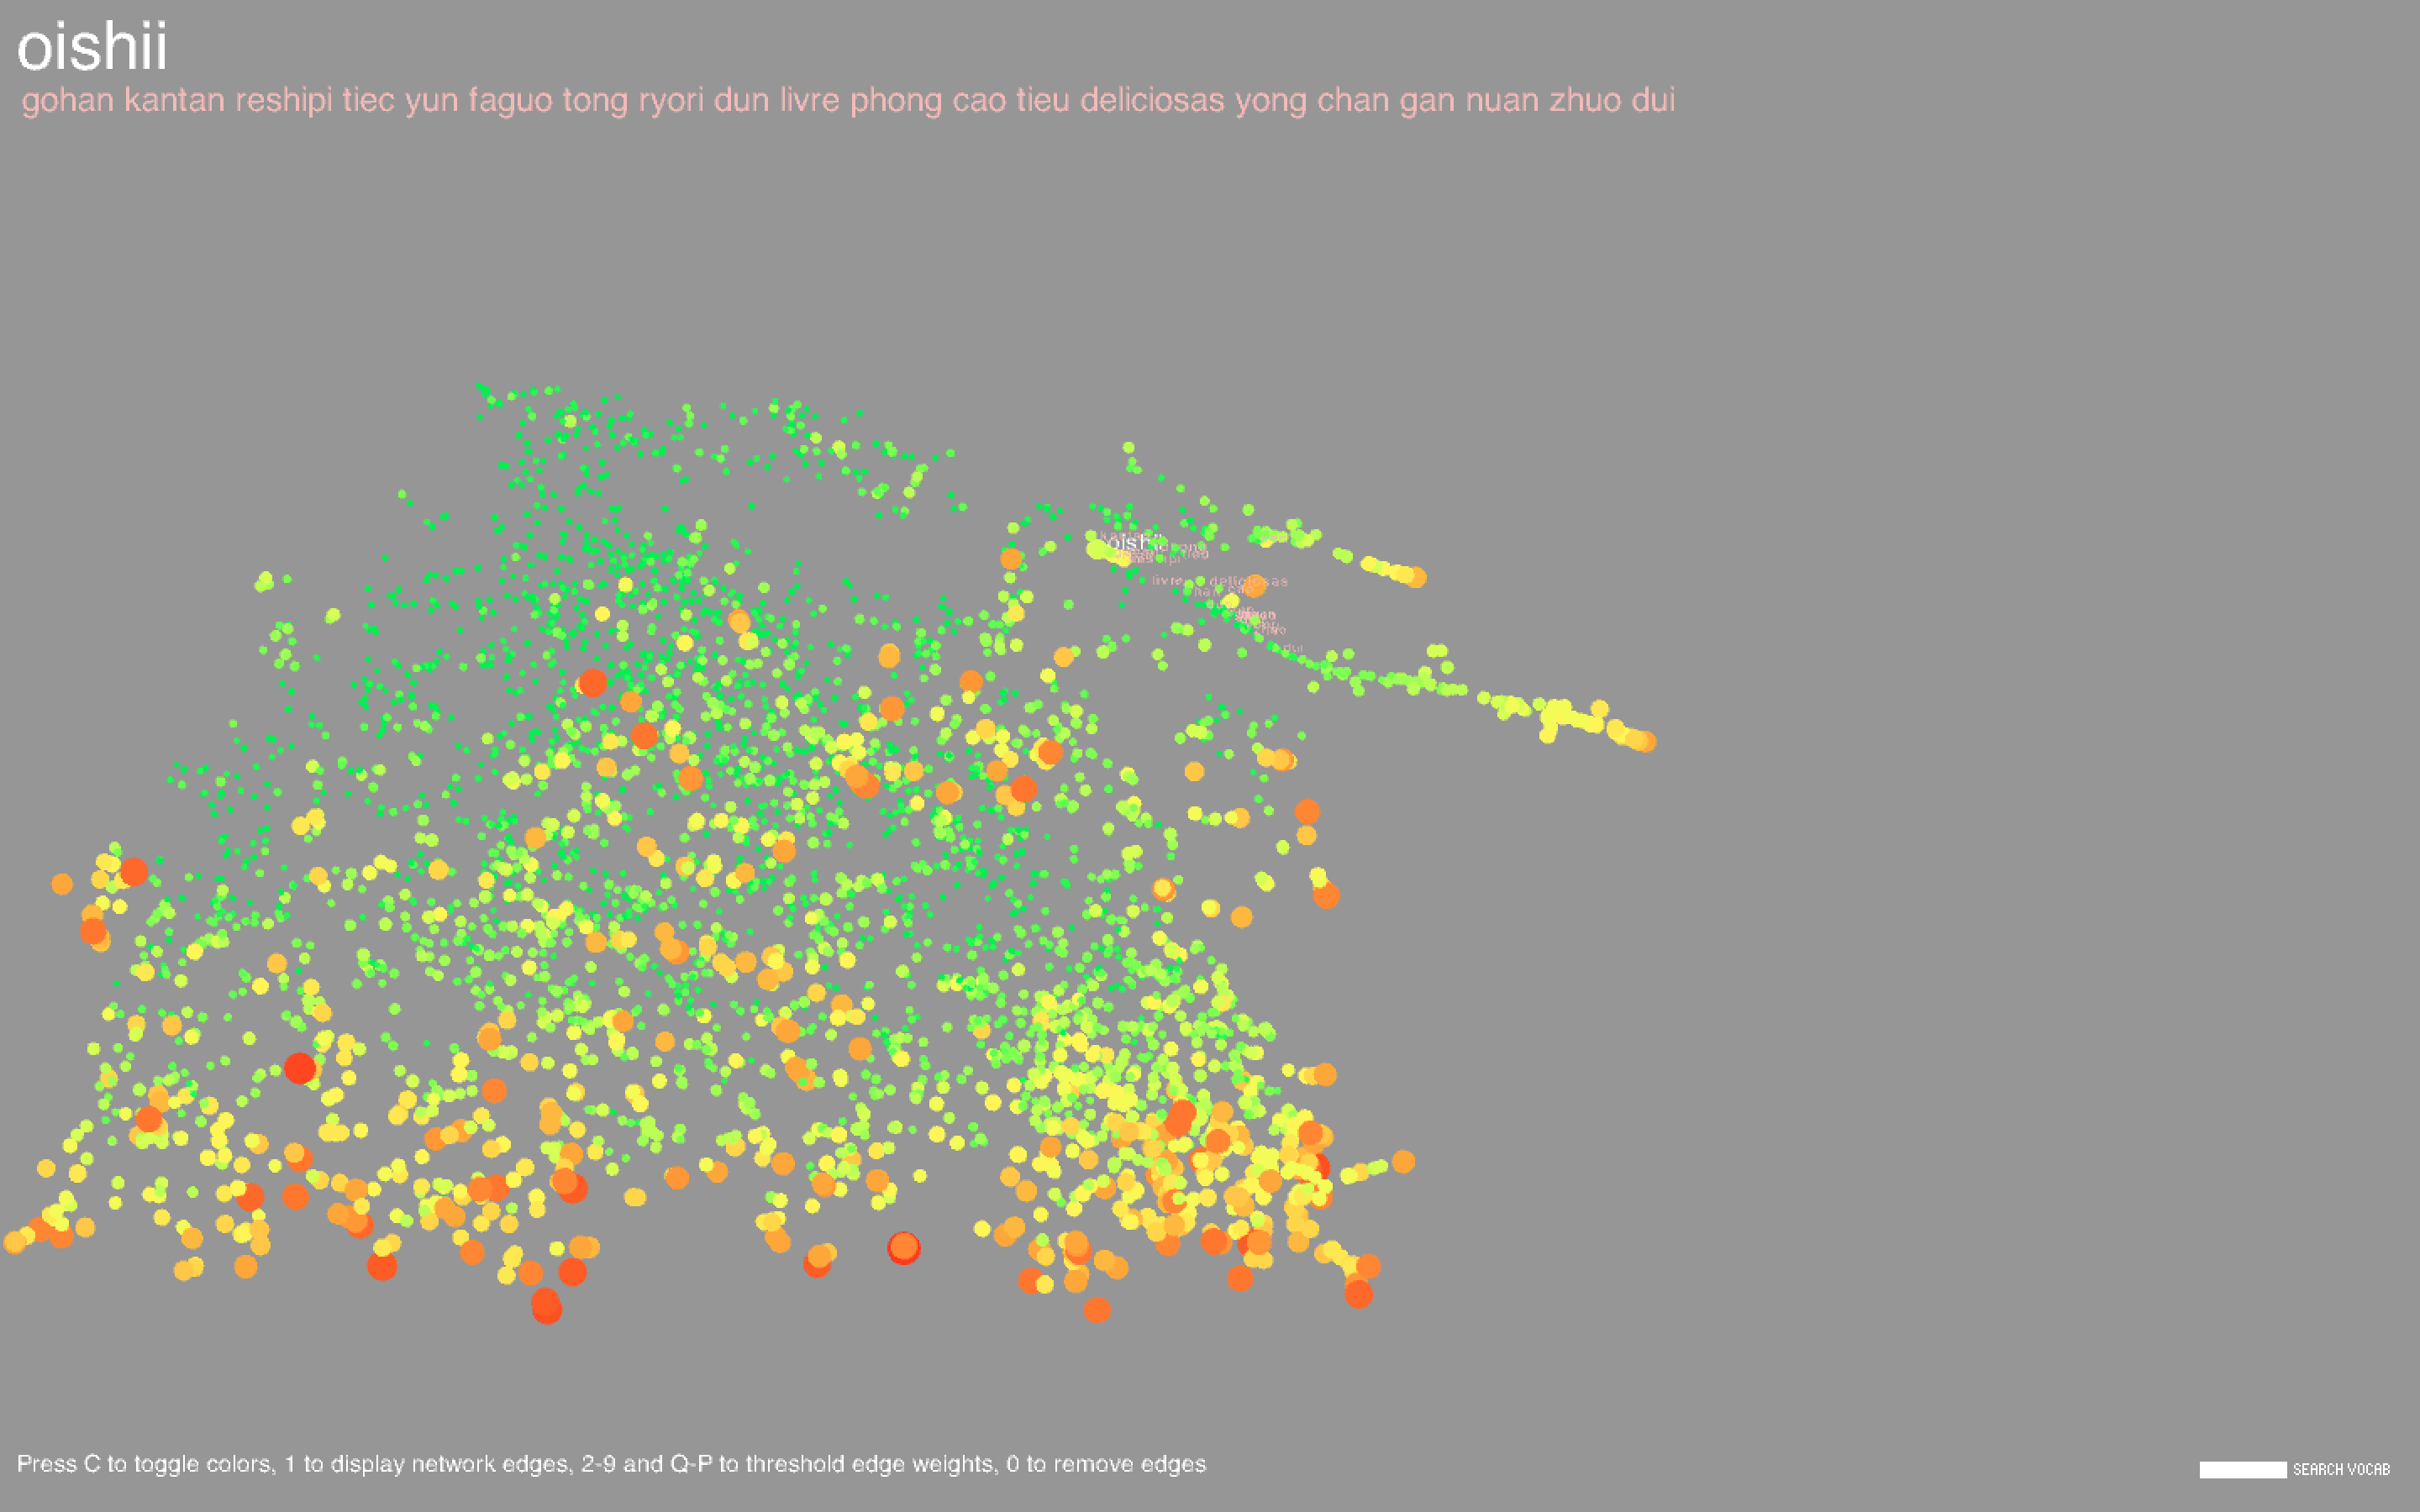
Hovering over a point will highlight the corresponding label along with the 20 most similar words. Similarity is determined from word2vec and is contextually based - hence, "Italy" and "Mexico" are similar because even though it may be unlikely for a cookbook to be about both Italian and Mexican food, Italy and Mexico may occur separately in similar contexts (for example, there may be a title like "The Rich Cuisine of Italy" and another like "The Rich Cuisine of Mexico"). Note that this is not the way relationships between words are determined in the co-occurrence network; for two words to be connected by an edge, the words must necessarily occur in the same title. Likewise, words in a community tend to co-occur with each other more often than with other words in the network. In community-based color mode, it is evident that words in the same community are in large part clustered closely together in space, but this does not necessarily have to happen, and there are nodes of different colors scattered all about the space.
Hovering over a point will highlight the corresponding label along with the 20 most similar words. Similarity is determined from word2vec and is contextually based - hence, "Italy" and "Mexico" are similar because even though it may be unlikely for a cookbook to be about both Italian and Mexican food, Italy and Mexico may occur separately in similar contexts (for example, there may be a title like "The Rich Cuisine of Italy" and another like "The Rich Cuisine of Mexico"). Note that this is not the way relationships between words are determined in the co-occurrence network; for two words to be connected by an edge, the words must necessarily occur in the same title. Likewise, words in a community tend to co-occur with each other more often than with other words in the network. In community-based color mode, it is evident that words in the same community are in large part clustered closely together in space, but this does not necessarily have to happen, and there are nodes of different colors scattered all about the space.
Final result
In my final visualization, I added a search bar in the lower right corner; the user can type in a word (and hit enter) upon which the corresponding node will be highlighted if the word exists in the dictionary. To clear the highlighted node, type "clear" in the search bar and hit enter.
I also made the lines that represent network edges more transparent to improve visibility, and colored them such that each end is the same color as the color of connected node, and if the ends are different colors, the line will be colored with a gradient that joins the two colors.
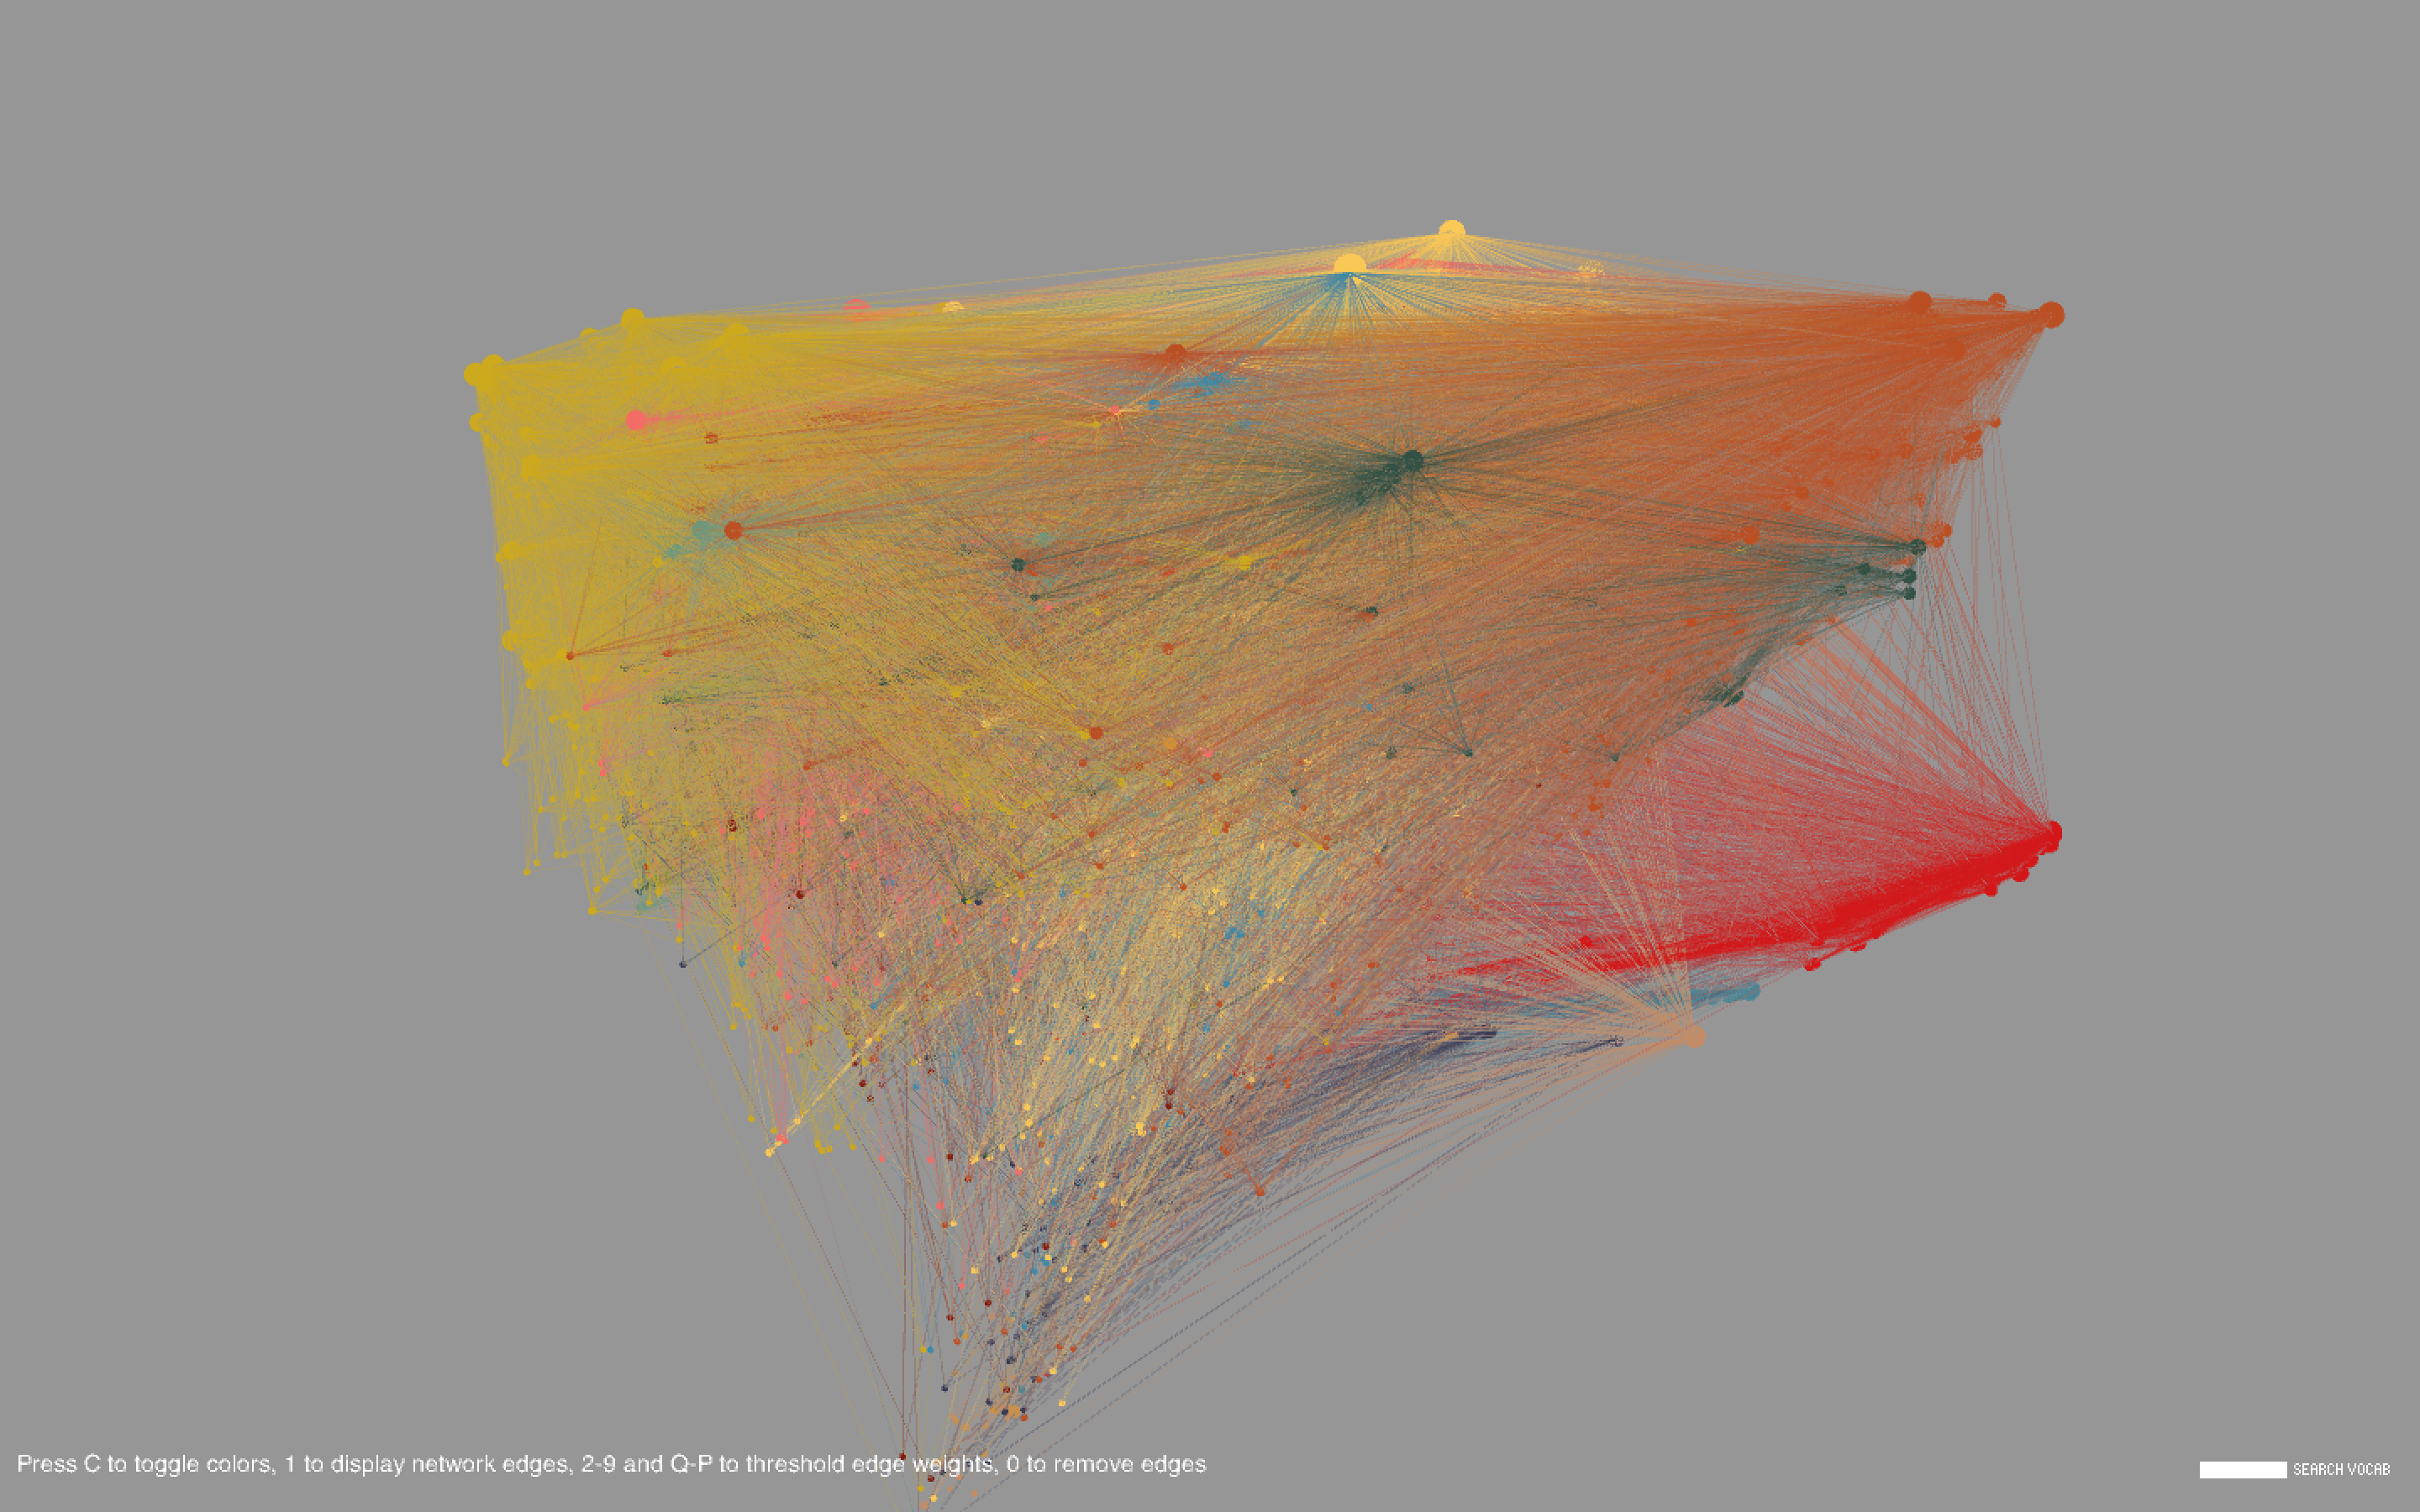
Common words include types of dishes (cake, pie), ingredients (sugar, egg), drinks (wine, cocktails), locations (France, China), special diets (vegan, gluten), and other concepts (flavors, stories, farms, family, tradition). There are a large number of cookbooks in foreign languages including Chinese, Vietnamese, Spanish, and Japanese. Foreign words formed long strand-like clusters that were noticeably separated from the English words.
Common words include types of dishes (cake, pie), ingredients (sugar, egg), drinks (wine, cocktails), locations (France, China), special diets (vegan, gluten), and other concepts (flavors, stories, farms, family, tradition). There are a large number of cookbooks in foreign languages including Chinese, Vietnamese, Spanish, and Japanese. Foreign words formed long strand-like clusters that were noticeably separated from the English words.
Code
Vectorization and dimensionality reduction were done in Python, community detection in Matlab, and the visualization was developed in Processing. (Note: the attached source code does not include the GenLouvain package required to run the community detection Matlab script.)
Source Code + Data
Source Code + Data