Exploration of A Series of Unfortunate Events
MAT 259, 2019
Sarah Wells
Concept
For this project I explored the popularity of a favorite childhood book series: A Series of Unfortunate Events by Lemony Snicket.
The new Netflix series was released in three parts from 2017 to 2019, so I was curious the relationship between this releases and the series checkouts. I also was interested to see the proportional number of checkouts of each book in the 13 book series.
Query
SELECT
title,
DATE_FORMAT(cout, '%Y-%m') AS yearmonth,
COUNT(*) AS count
FROM
spl_2016.outraw
WHERE
title IN ('austere academy' , 'bad beginning',
'carnivorous carnival',
'end',
'ersatz elevator',
'grim grotto',
'hostile hospital',
'miserable mill',
'penultimate peril',
'reptile room',
'slippery slope',
'vile village',
'wide window')
AND callnumber IN ('J SNICKET' , 'DVD J LEMONY')
AND YEAR(cout) > 2018
GROUP BY title , DATE_FORMAT(cout, '%Y-%m')
ORDER BY DATE_FORMAT(cout, '%Y-%m');
Process
I created a pivot table in google sheets for the desired 2D data format. "TitleYearMonth Pivot Table 1.csv"
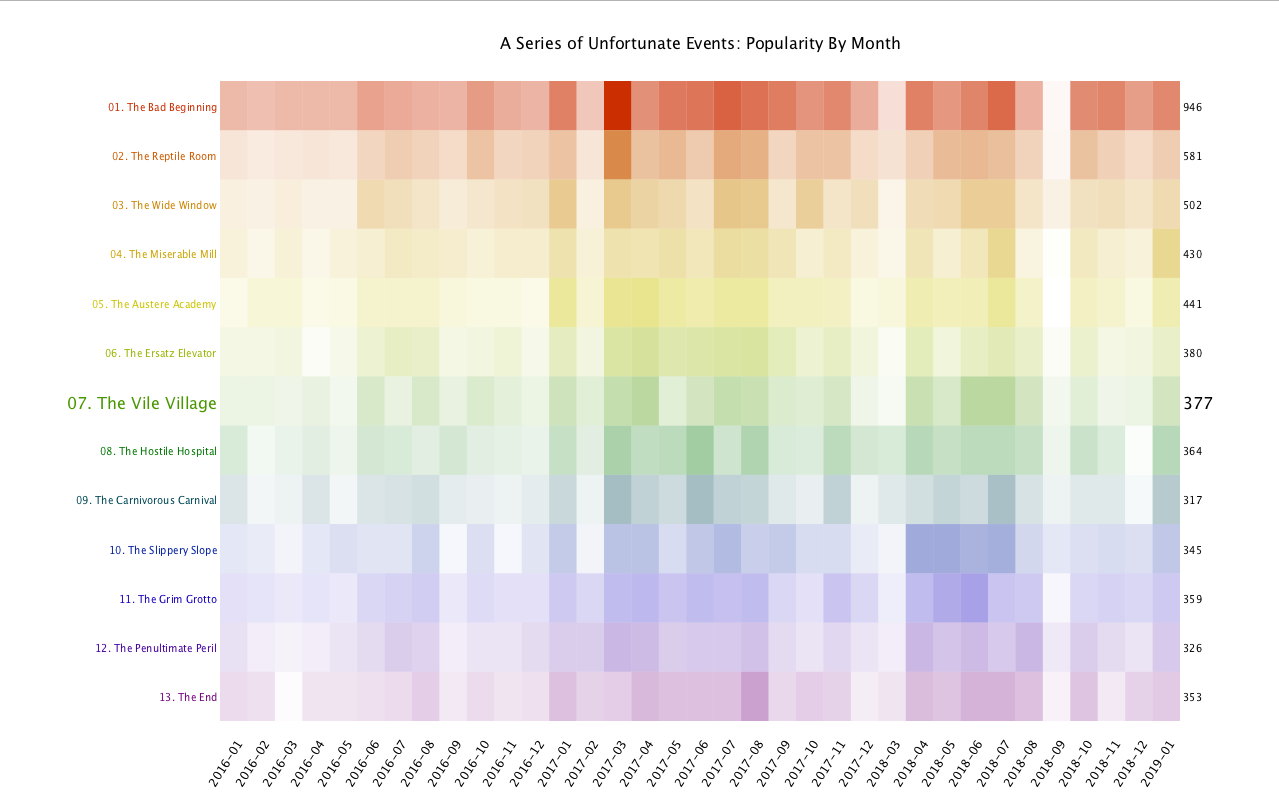
Then the first display I made showed Titles vs Months and represents popularity with shading and different colors for each title. I experimented with a number of color schemes but ended up using a rainbow to indicate the series progression pleasantly "darkerrainbow.jpg". [You can get back to this view by pressing 'o']

Final result
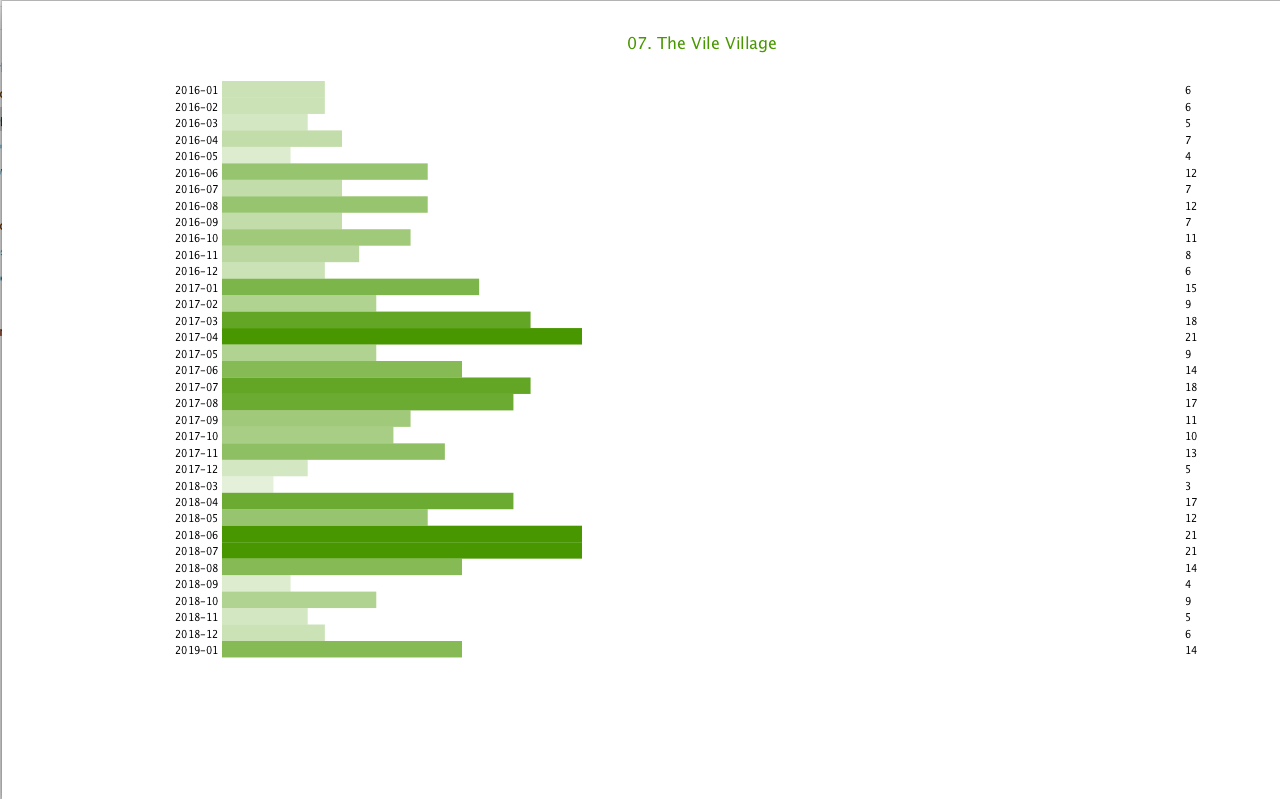
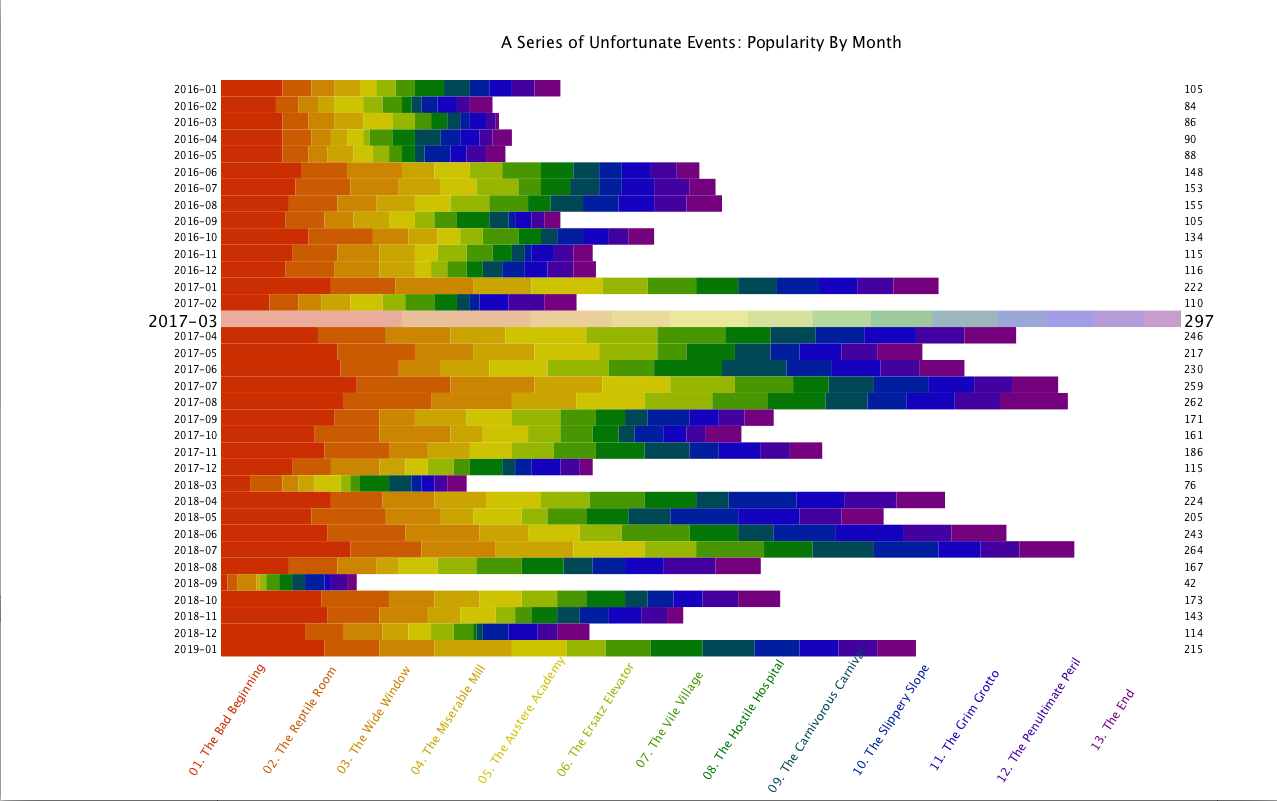
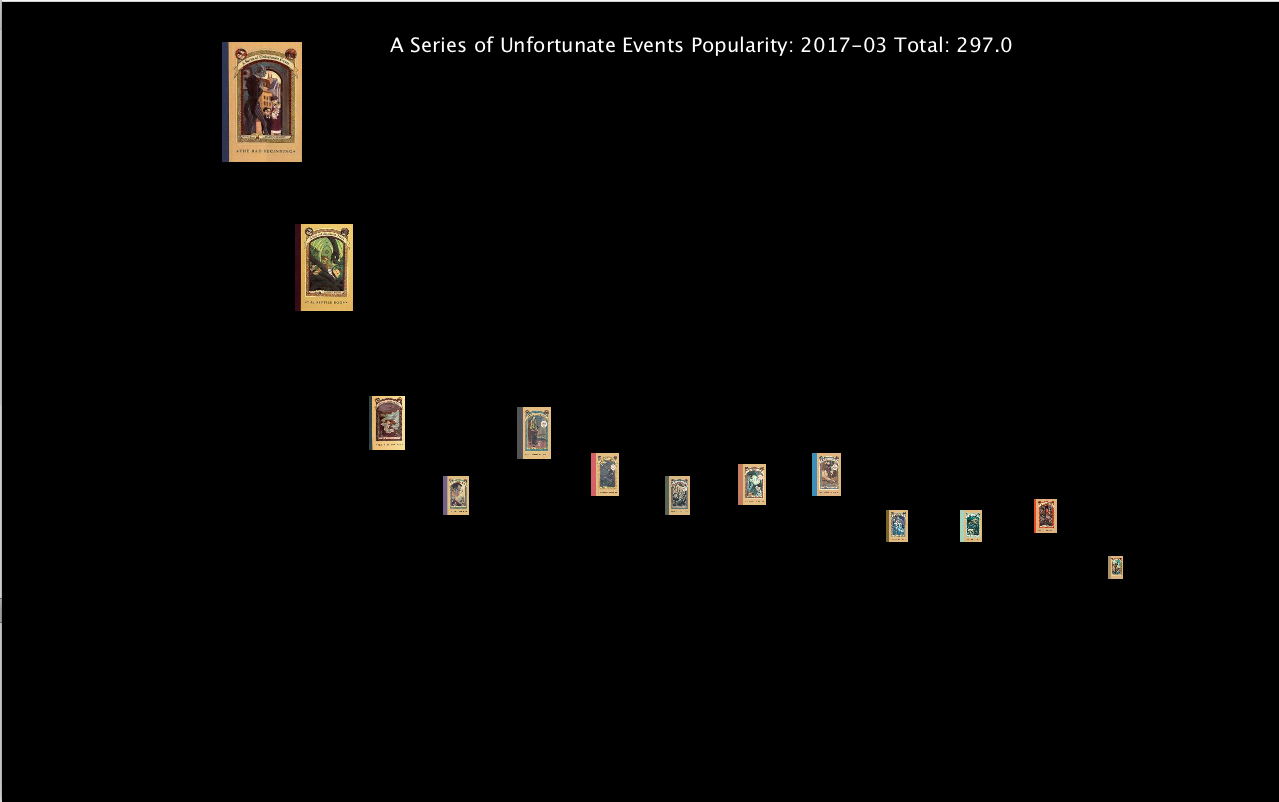
For the final version I included the first view and a variety of others. From the first screen, you can highlight a title and click to see the behavior of that specific title over the months. Here we see the Vile Village with the bar length normalized to the largest month count for any title and the shading indicative of popularity proportion for that specific title. One can use the arrows to navigate the different books in order from this view. [You can get back to this view by pressing 'a-m' representing books 1-13 respectively]. I was also interested in seeing the total trends and how much each title affected them. So I made a new table using the month total count and representing the portion provided by each title in the appropriate color. Here we can see the leap on/after release dates clearer. Those release dates being January 13th, 2017, March 30th, 2018, and January 1st, 2019. [You can get back to this view by pressing 't'] From here we can highlight a month, such as the most popular month, March 2017. This will give us the data on this month using the book cover images from SPL website as the marks and using size and height to indicate popularity.
Code