Language Learning Interest at Seattle Public Library
MAT 259, 2019
Meilin Shi
Concept
I’m interested in the checkouts within Dewey Class 400 – Language. For this project, I focused on 10 languages listed below and would like to see if there is a relative popularity in language learning at Seattle Public Library. To measure popularity, I used total checkouts number and average keep time of language related items from 2006 to 2018.
| Dewey | Language |
| 420 | English |
| 430 | German and related |
| 440 | French and related |
| 450 | Italian and related |
| 460 | Spanish and related |
| 491.7 | Russian |
| 492.7 | Arabic |
| 495.1 | Chinese |
| 495.6 | Japanese |
| 495.7 | Korean |
Query
Query #1 On total checkouts (27.002 sec)
SELECT
    YEAR(cout) AS years,
    MONTH(cout) AS months,
    COUNT(IF(deweyClass >= 420 AND deweyClass < 430,1,NULL)) AS 'English',
    COUNT(IF(deweyClass >= 430 AND deweyClass < 440,1,NULL)) AS 'German & related',
    COUNT(IF(deweyClass >= 440 AND deweyClass < 450,1,NULL)) AS 'French & related',
    COUNT(IF(deweyClass >= 450 AND deweyClass < 460,1,NULL)) AS 'Italian & related',
    COUNT(IF(deweyClass >= 460 AND deweyClass < 470,1,NULL)) AS 'Spanish & related',
    COUNT(IF(deweyClass >= 491.7 AND deweyClass < 491.8,1,NULL)) AS 'Russian',
    COUNT(IF(deweyClass >= 492.7 AND deweyClass < 492.8,1,NULL)) AS 'Arabic',
    COUNT(IF(deweyClass >= 495.1 AND deweyClass < 495.2,1,NULL)) AS 'Chinese',
    COUNT(IF(deweyClass >= 495.6 AND deweyClass < 495.7,1,NULL)) AS 'Japanese',
    COUNT(IF(deweyClass >= 495.7 AND deweyClass < 495.8,1,NULL)) AS 'Korean'
FROM
    spl_2016.outraw
WHERE
    deweyClass >= 420 AND deweyClass < 495.8 AND YEAR(cout) BETWEEN 2006 AND 2018
GROUP BY MONTH(cout),YEAR(cout)
ORDER BY YEAR(cout), MONTH(cout);
SELECT
    class, years, AVG(TIMESTAMPDIFF(DAY, cout, cin)) AS AVG_TIME
FROM
    (SELECT
        #SUBSTRING(deweyClass, 1, 5) AS class,
        SUBSTRING(deweyClass, 1, 2) AS class, #for deweyClass 420 to 470
            YEAR(cout) AS years,
            cin,
            cout,
            TIMESTAMPDIFF(DAY, cout, cin)
    FROM
        spl_2016.inraw
    WHERE
        YEAR(cout) BETWEEN 2006 AND 2018
            AND TIMESTAMPDIFF(DAY, cout, cin) > 0
            AND deweyClass >= 420 AND deweyClass < 470
    #         AND (deweyClass >= 491.7 AND deweyClass < 491.8
    #         OR deweyClass >= 492.7 AND deweyClass < 492.8
    #         OR deweyClass >= 495.1 AND deweyClass < 495.2
    #         OR deweyClass >= 495.6 AND deweyClass < 495.7
    #         OR deweyClass >= 495.7 AND deweyClass < 495.8)
    GROUP BY years , class , cin , cout) AS aTable
GROUP BY class , years
Preliminary sketches
I was trying to show the checkouts number by matrix and use color to convey the change in pattern. With time on x-axis and language on y axis, I put keeping time as another layer of data overlaid on the checkouts matrix.
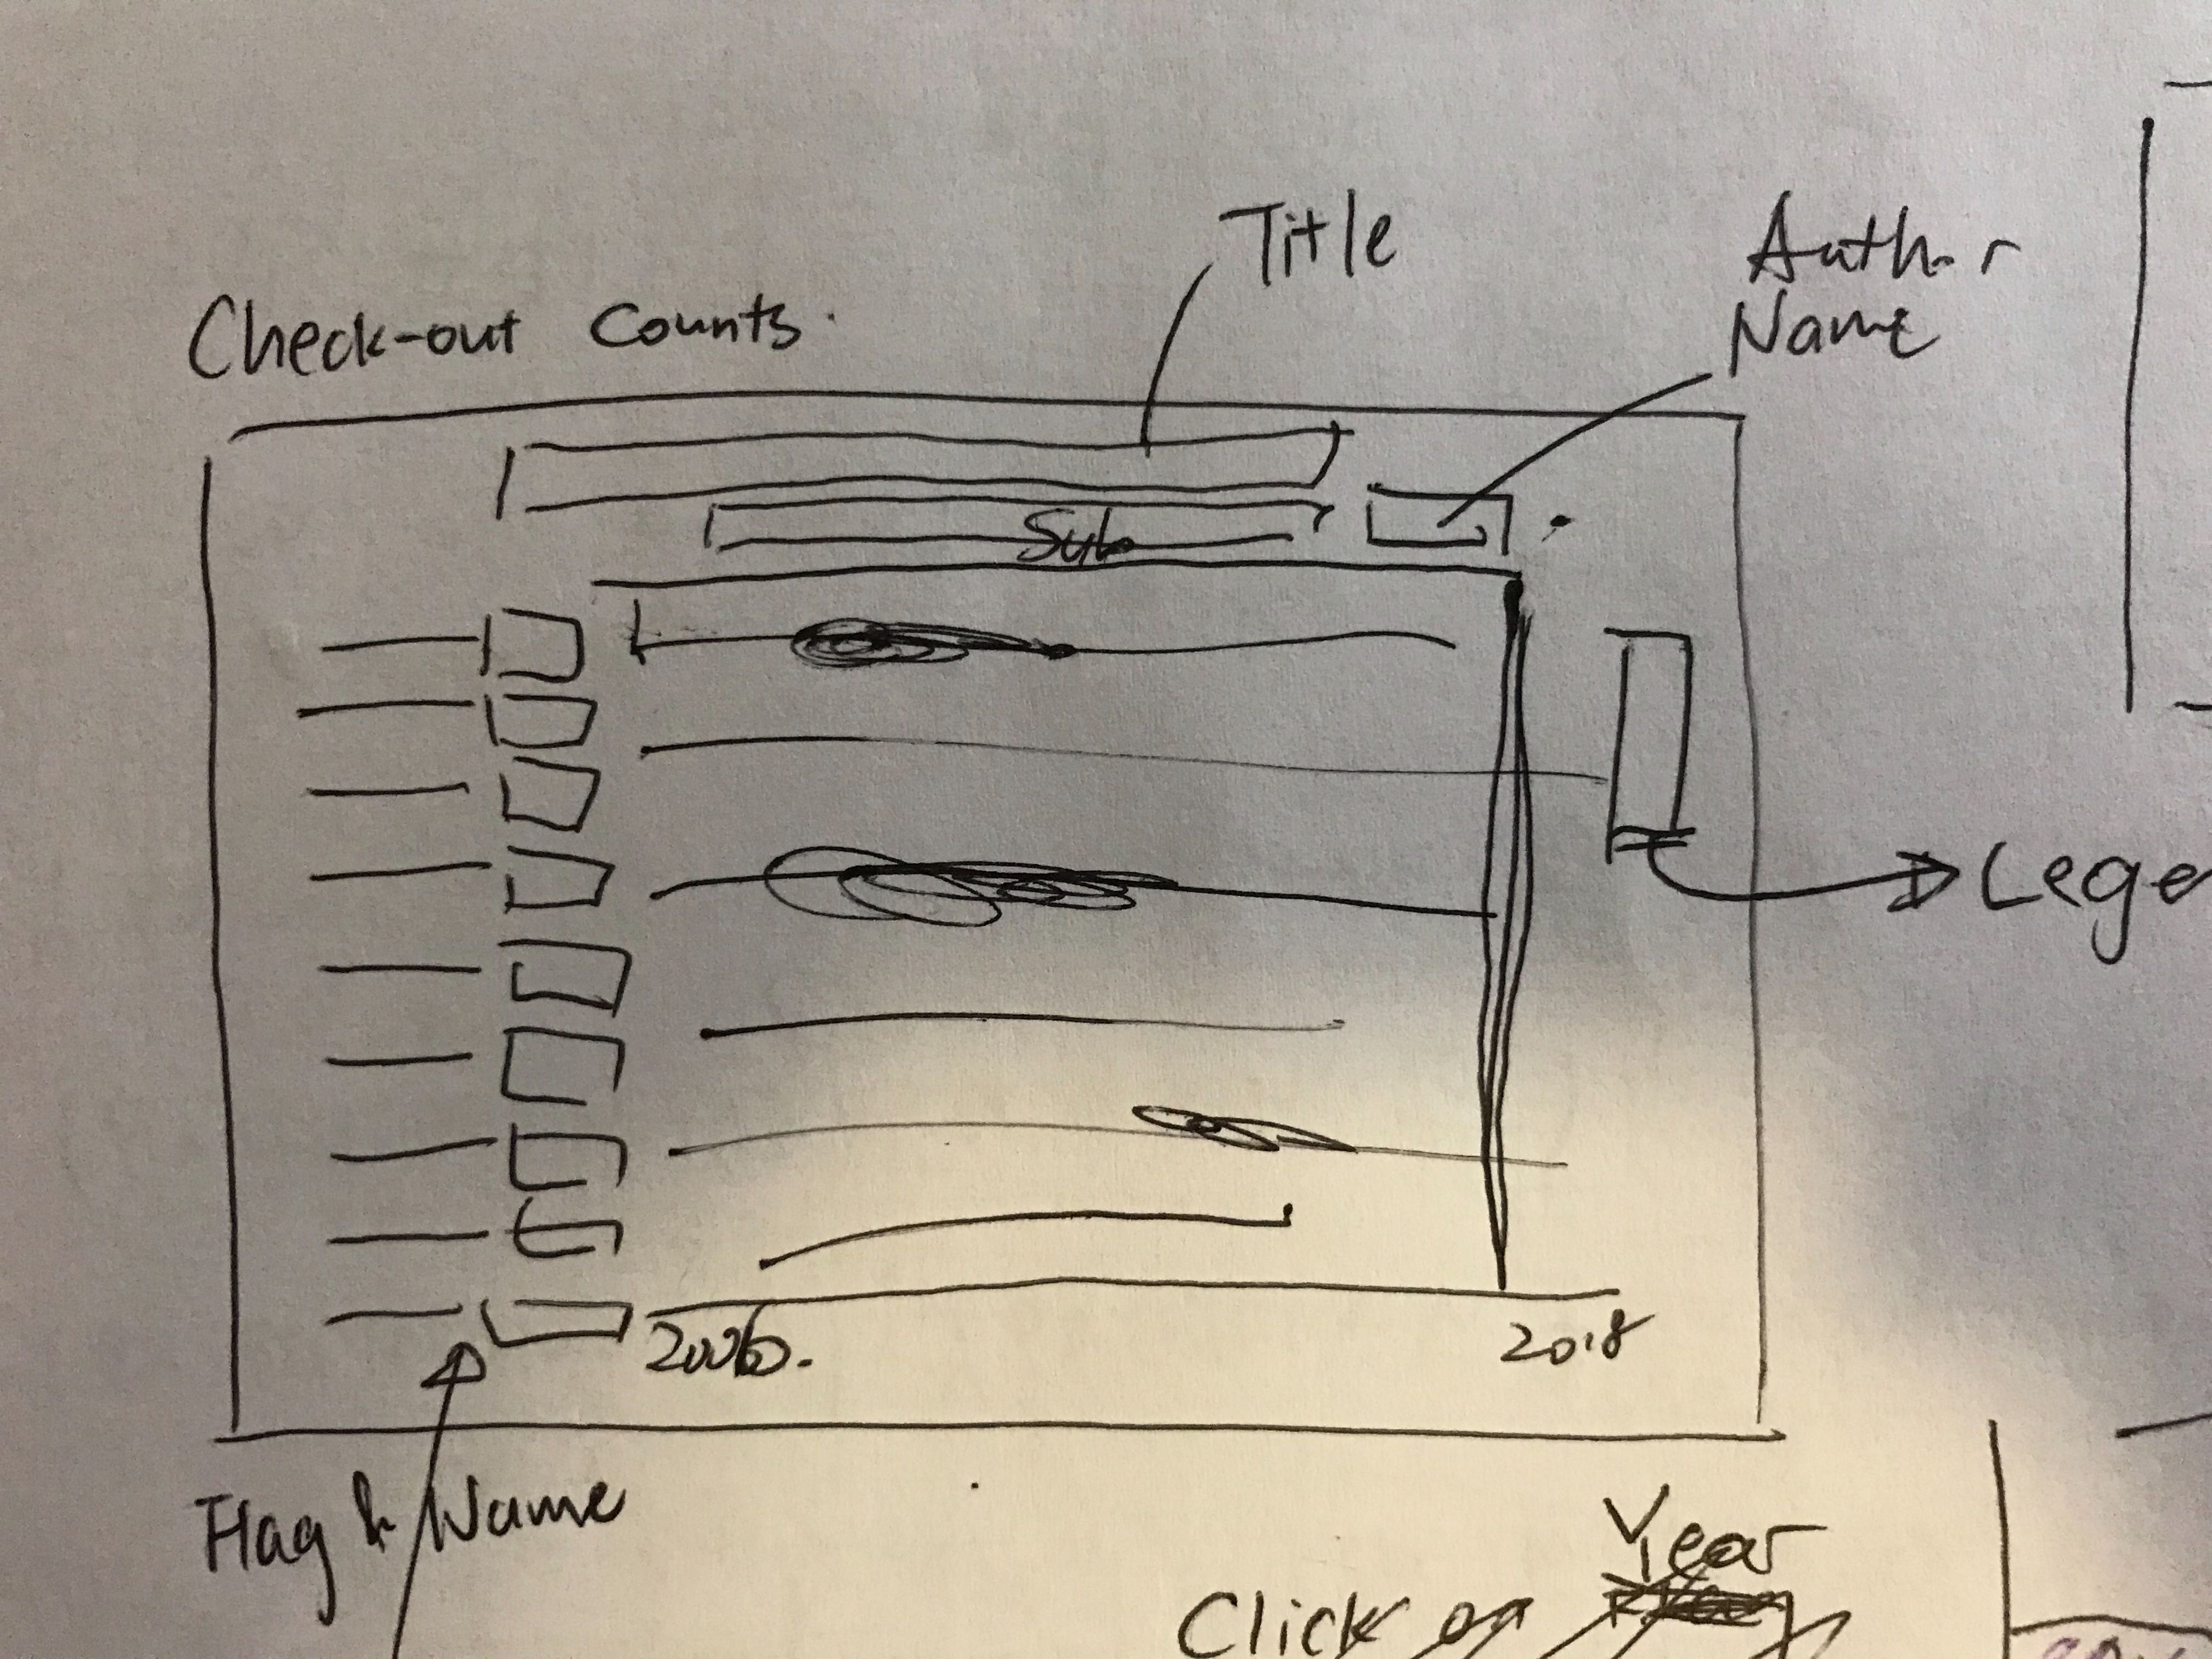
Process
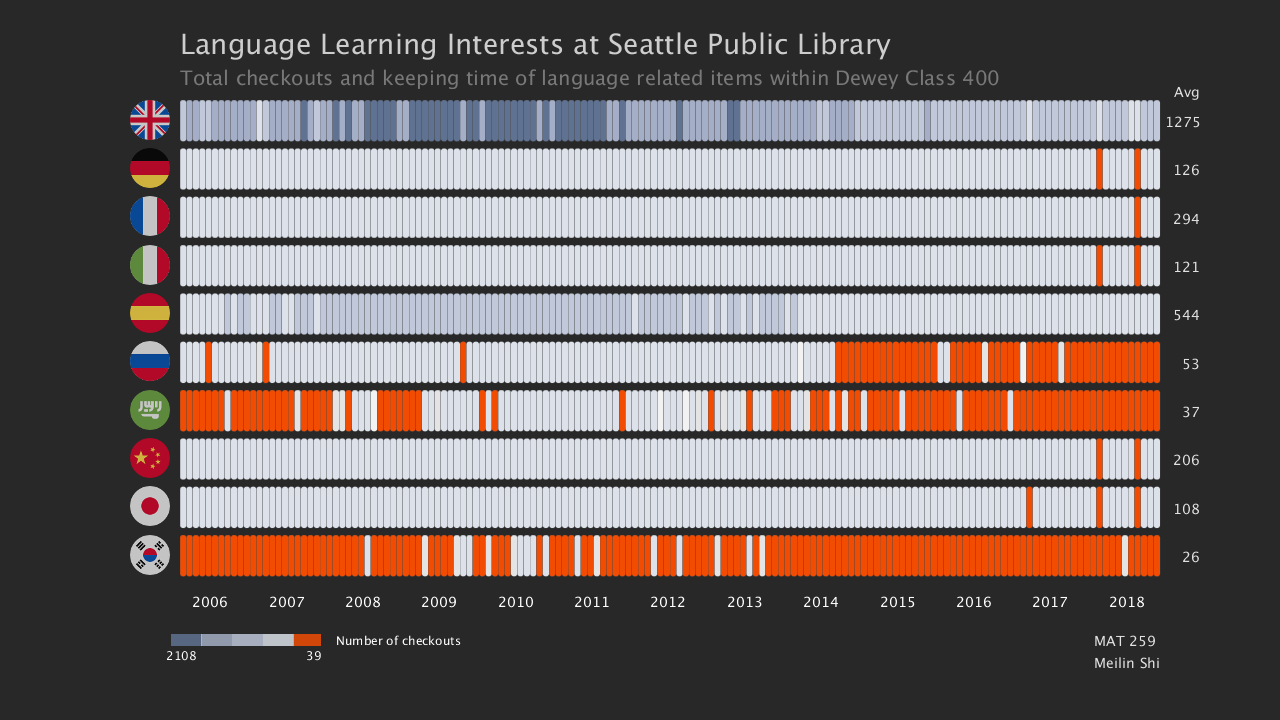
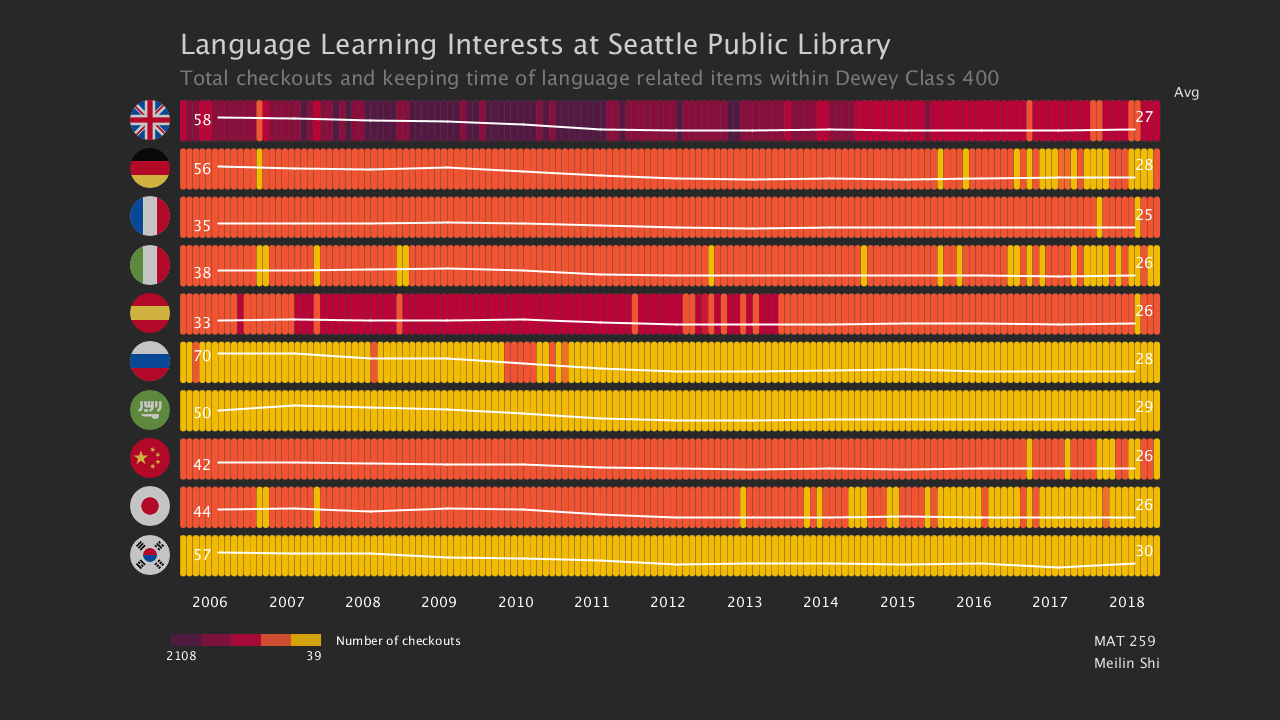
I used two colorbars to show the total checkout pattern [press ‘c’ to change colorbar]. There is some minor difference, which I assume is because of the different cutoff value for each colorbar (i.e. see difference in Arabic and Korean). I put average number of checkouts for each language on the right to better understand.

Final result
I highlighted each year of data and added language name and dewey class number for each flag icon.
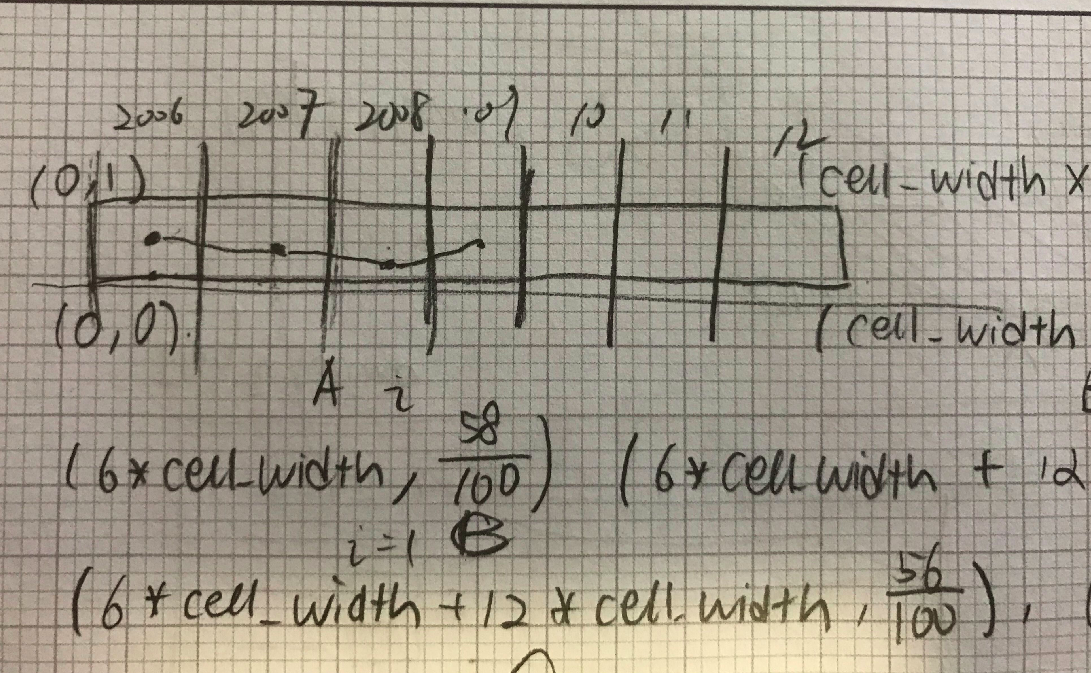
And then I used line to show the pattern in keeping time of items. [press ‘t’ to show the keeping time’] I normalized the data by cell height and added a line within each row to show the change in keeping time of items over time.
And then I used line to show the pattern in keeping time of items. [press ‘t’ to show the keeping time’] I normalized the data by cell height and added a line within each row to show the change in keeping time of items over time.
Evaluation/Analysis
From the visualization, we can see that English and Spanish are the two most popular languages. Followed by them are French, German, Italian, Chinese and Japanese. Russian, Arabic and Korean are the three least popular languages from the selected ten. And the overall checkouts shows a decreasing pattern, with a peak from 2008 to 2012.
Keeping time is higher for English, German, Russian (the highest), Arabic and Korean at the beginning, but interestingly after 2012, all of them decreased to 25-30 days and remained stable since then.
Code