Cuisines by Country
MAT 259, 2019
Chantal Nguyen
Concept
What are the most popular foreign cuisines amongst SPL users? I examined the checkouts of food and drink-related media at the Seattle Public Library to find out.
Query
I queried the number of checkouts of media with Dewey number 641 (food and drink category) and titles that included the name of a country or its adjectival form, for a 197 different countries not including the United States, for each month between 2006 and 2018. I did a few test runs at first and noticed that there are a number of countries whose names make up other words that have been used in titles -- for example, the string "dutch" is part of "dutch oven", which has nothing to do with Dutch food, so the query below includes some AND NOT title LIKE '...' to account for instances that I noticed. I wasn't able to catch everything - I'm sure that some of the titles that include "Turkey" might be about the poultry and not the country, for example.
This query took 215 seconds.
I then also queried the top 8 items for each country, along with the respective item type and number of check-ins. I'm not sure if there is a more elegant way to accomplish this, but I basically had to do (QUERY) UNION (QUERY) UNION (QUERY) ... (QUERY) for each country, where an example of such a QUERY would be:
SELECT
    SUBSTRING(itemType, 3) AS shortType,
    title,
    COUNT(bibNumber) AS Counts
FROM
    spl_2016.inraw
WHERE
    (title LIKE '%afghan%')
        AND deweyClass >= 641
        AND deweyClass < 642
GROUP BY shortType , title
ORDER BY Counts DESC
LIMIT 8
This query took 2.5 hours. However, this is not particularly elegant, and the number of rows in the output is not 8 times the number of countries, as some countries have fewer than 8 different items or no related check-ins at all. I had to manually pad out the .csv file with empty rows so that each country had 8 (empty or non-empty) rows, to facilitate importing the result into Processing. I couldn't figure out if there's a way to do this in the MySQL query. I also realized that if there was a title that matched multiple queries, it would only show up in the results for the first query. For instance, the top result of an individually-performed query for Singapore is "Cradle of flavor home cooking from the spice islands of Indonesia Malaysia and Singapore", but this result won't show up under Singapore in the full query, as it will be part of the results for Indonesia. I would have to manually patch together several queries to get the correct set of top 8 items for each country.
Preliminary sketches
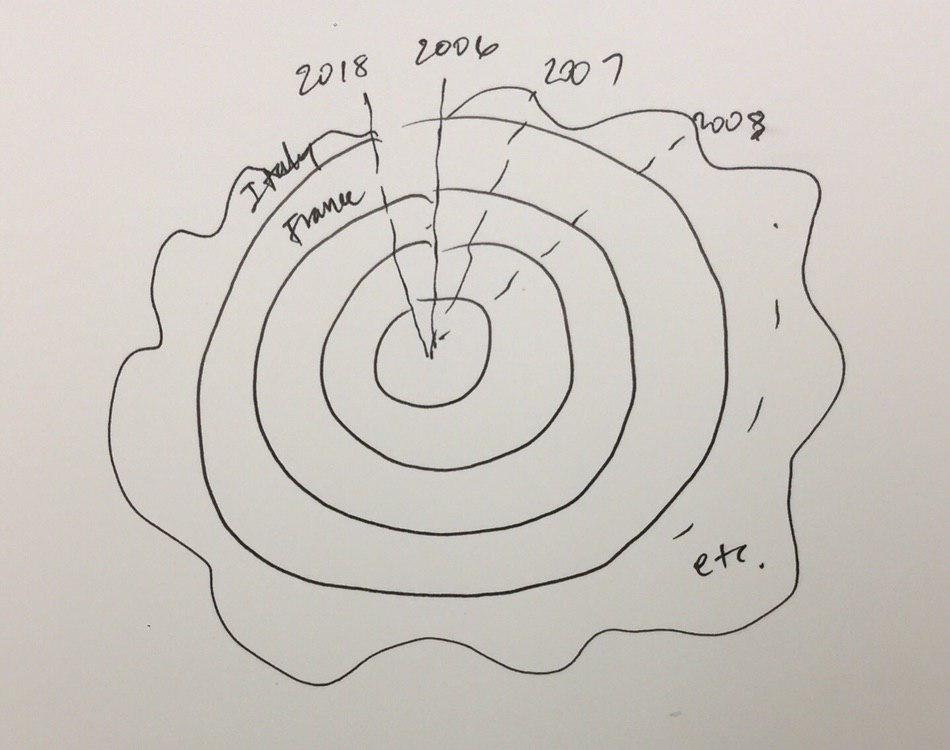
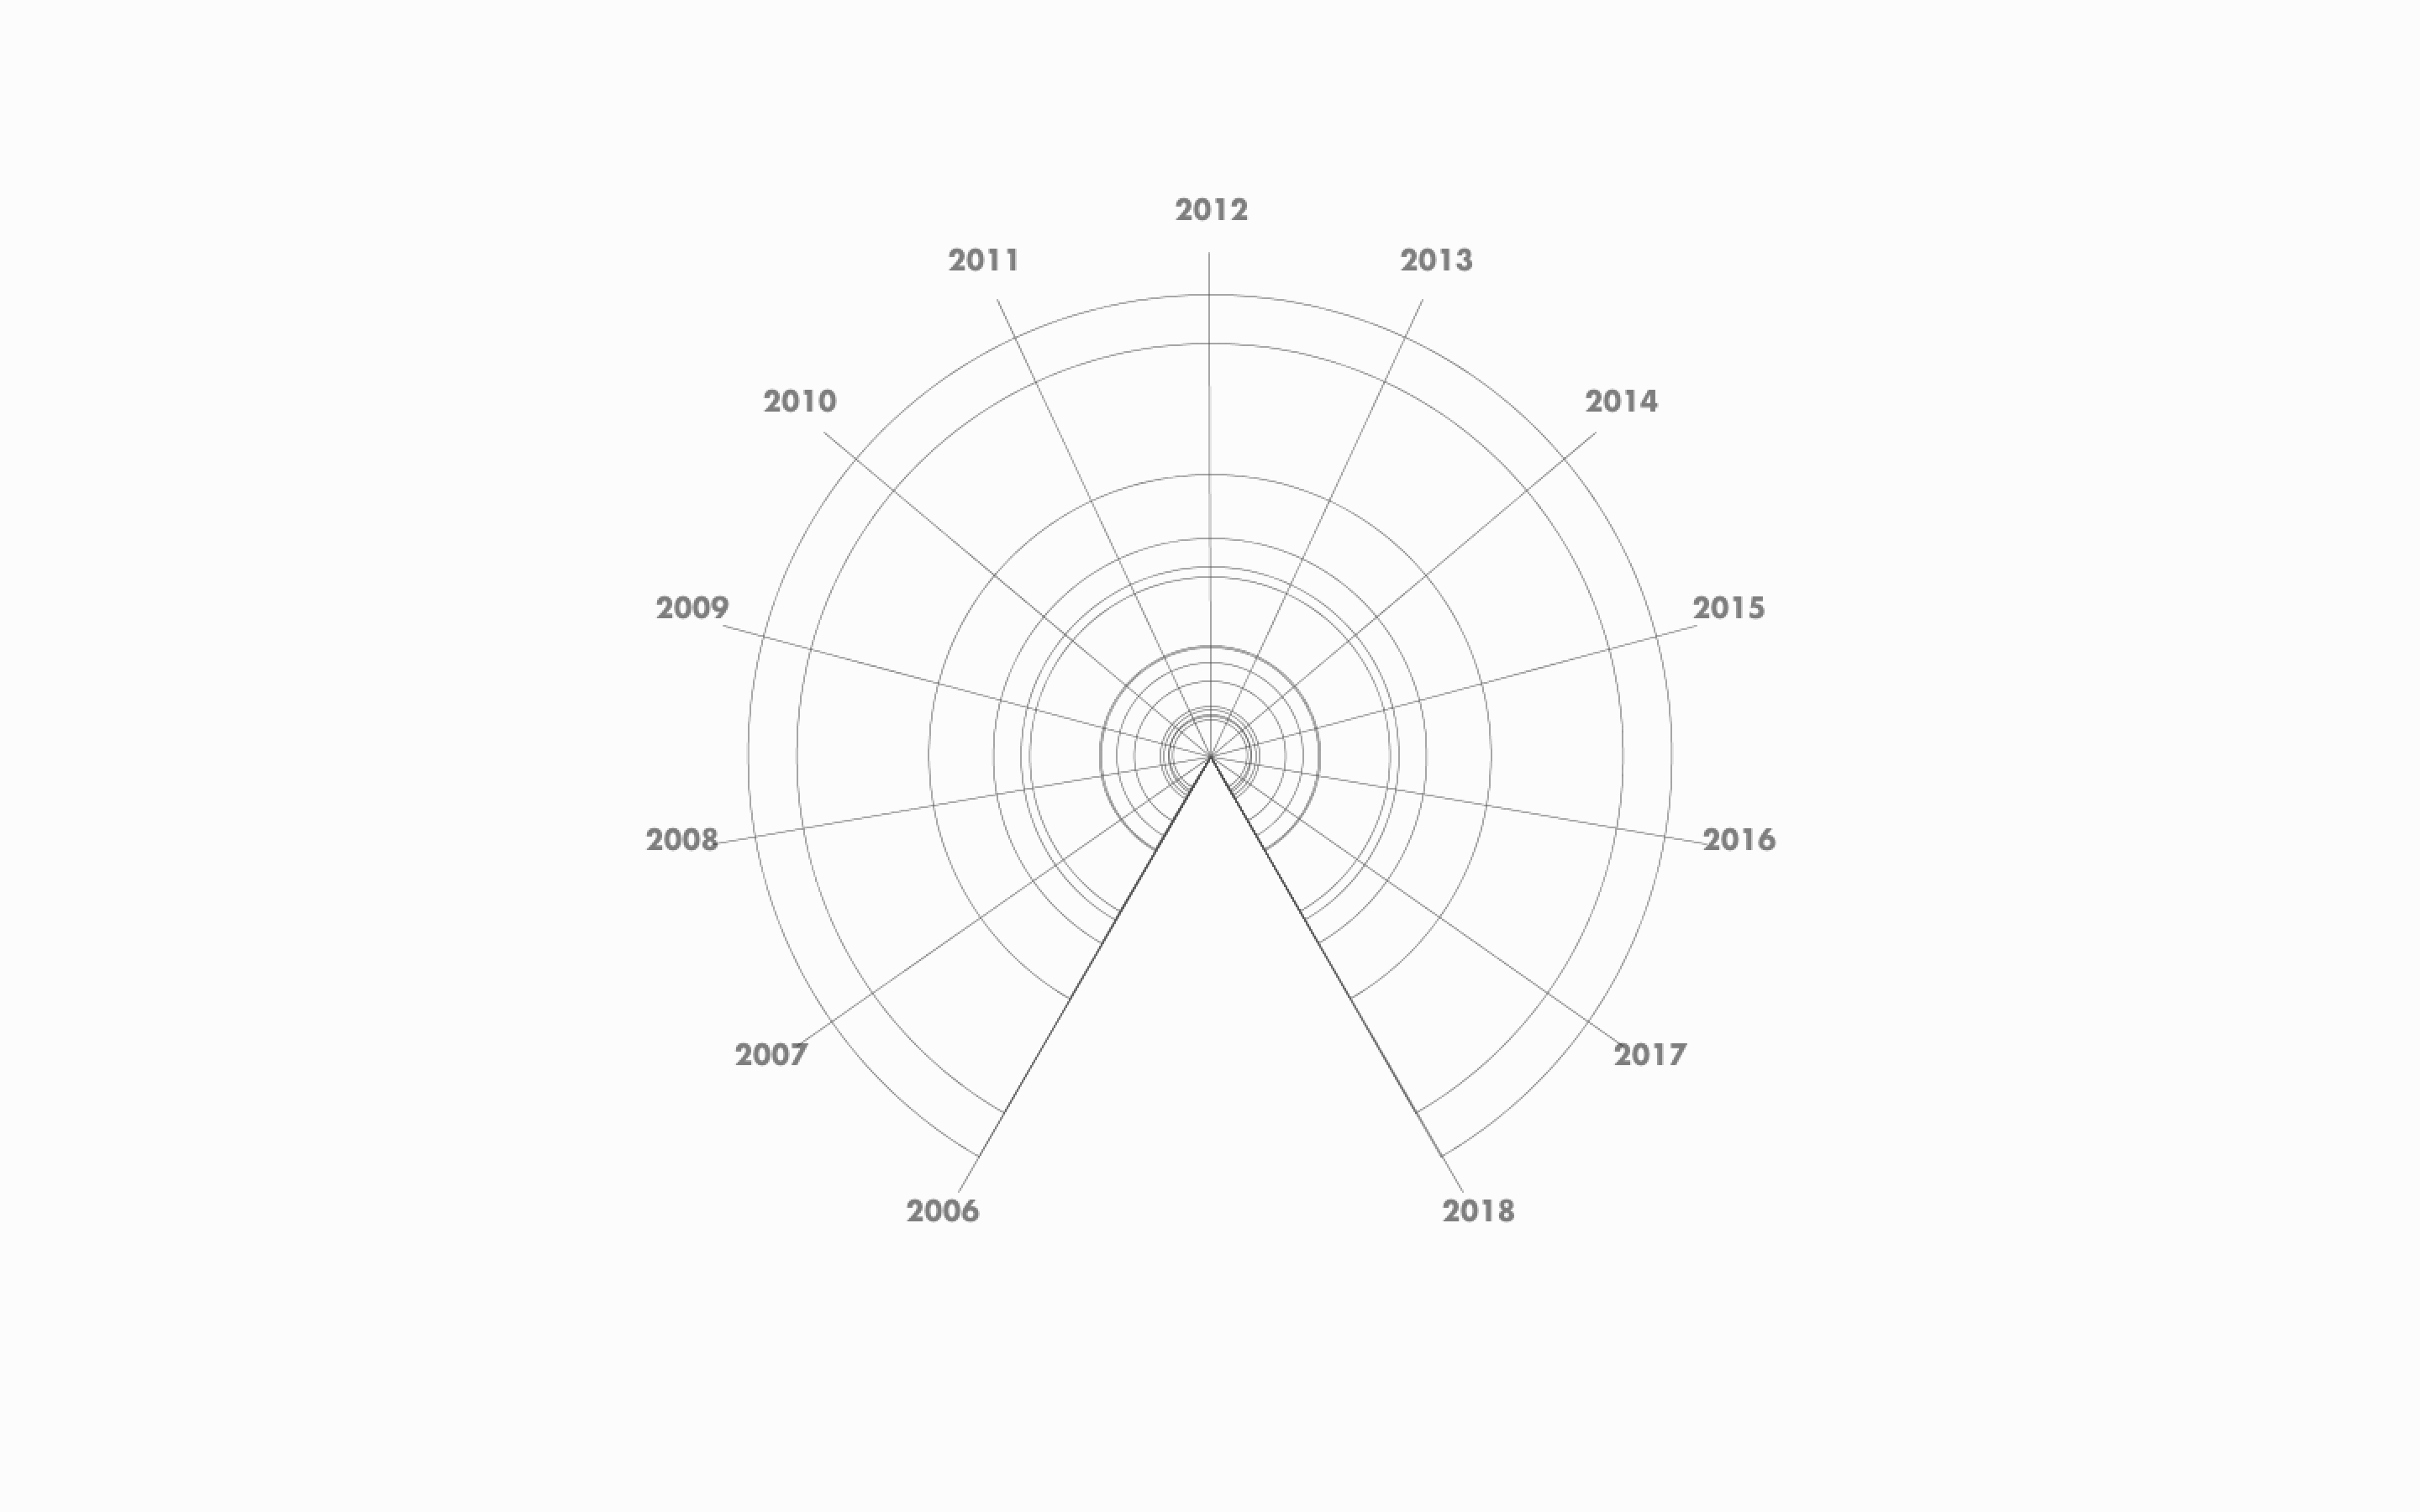
My plan was to arrange the data using concentric circles. The outermost circle would represent the country with the highest total checkout counts, with each smaller circle representing the next most popular countries.
I also wanted to show, when a circle is hovered over, the corresponding country's number of counts per month as a curve wrapped around the circle. Lines radiating from the center would mark out each year.
Process
I considered having the radius of each circle be proportional to the corresponding country's total number of checkouts; the radii proportional to the square root of the checkouts; and the radii evenly spaced apart.
Final result
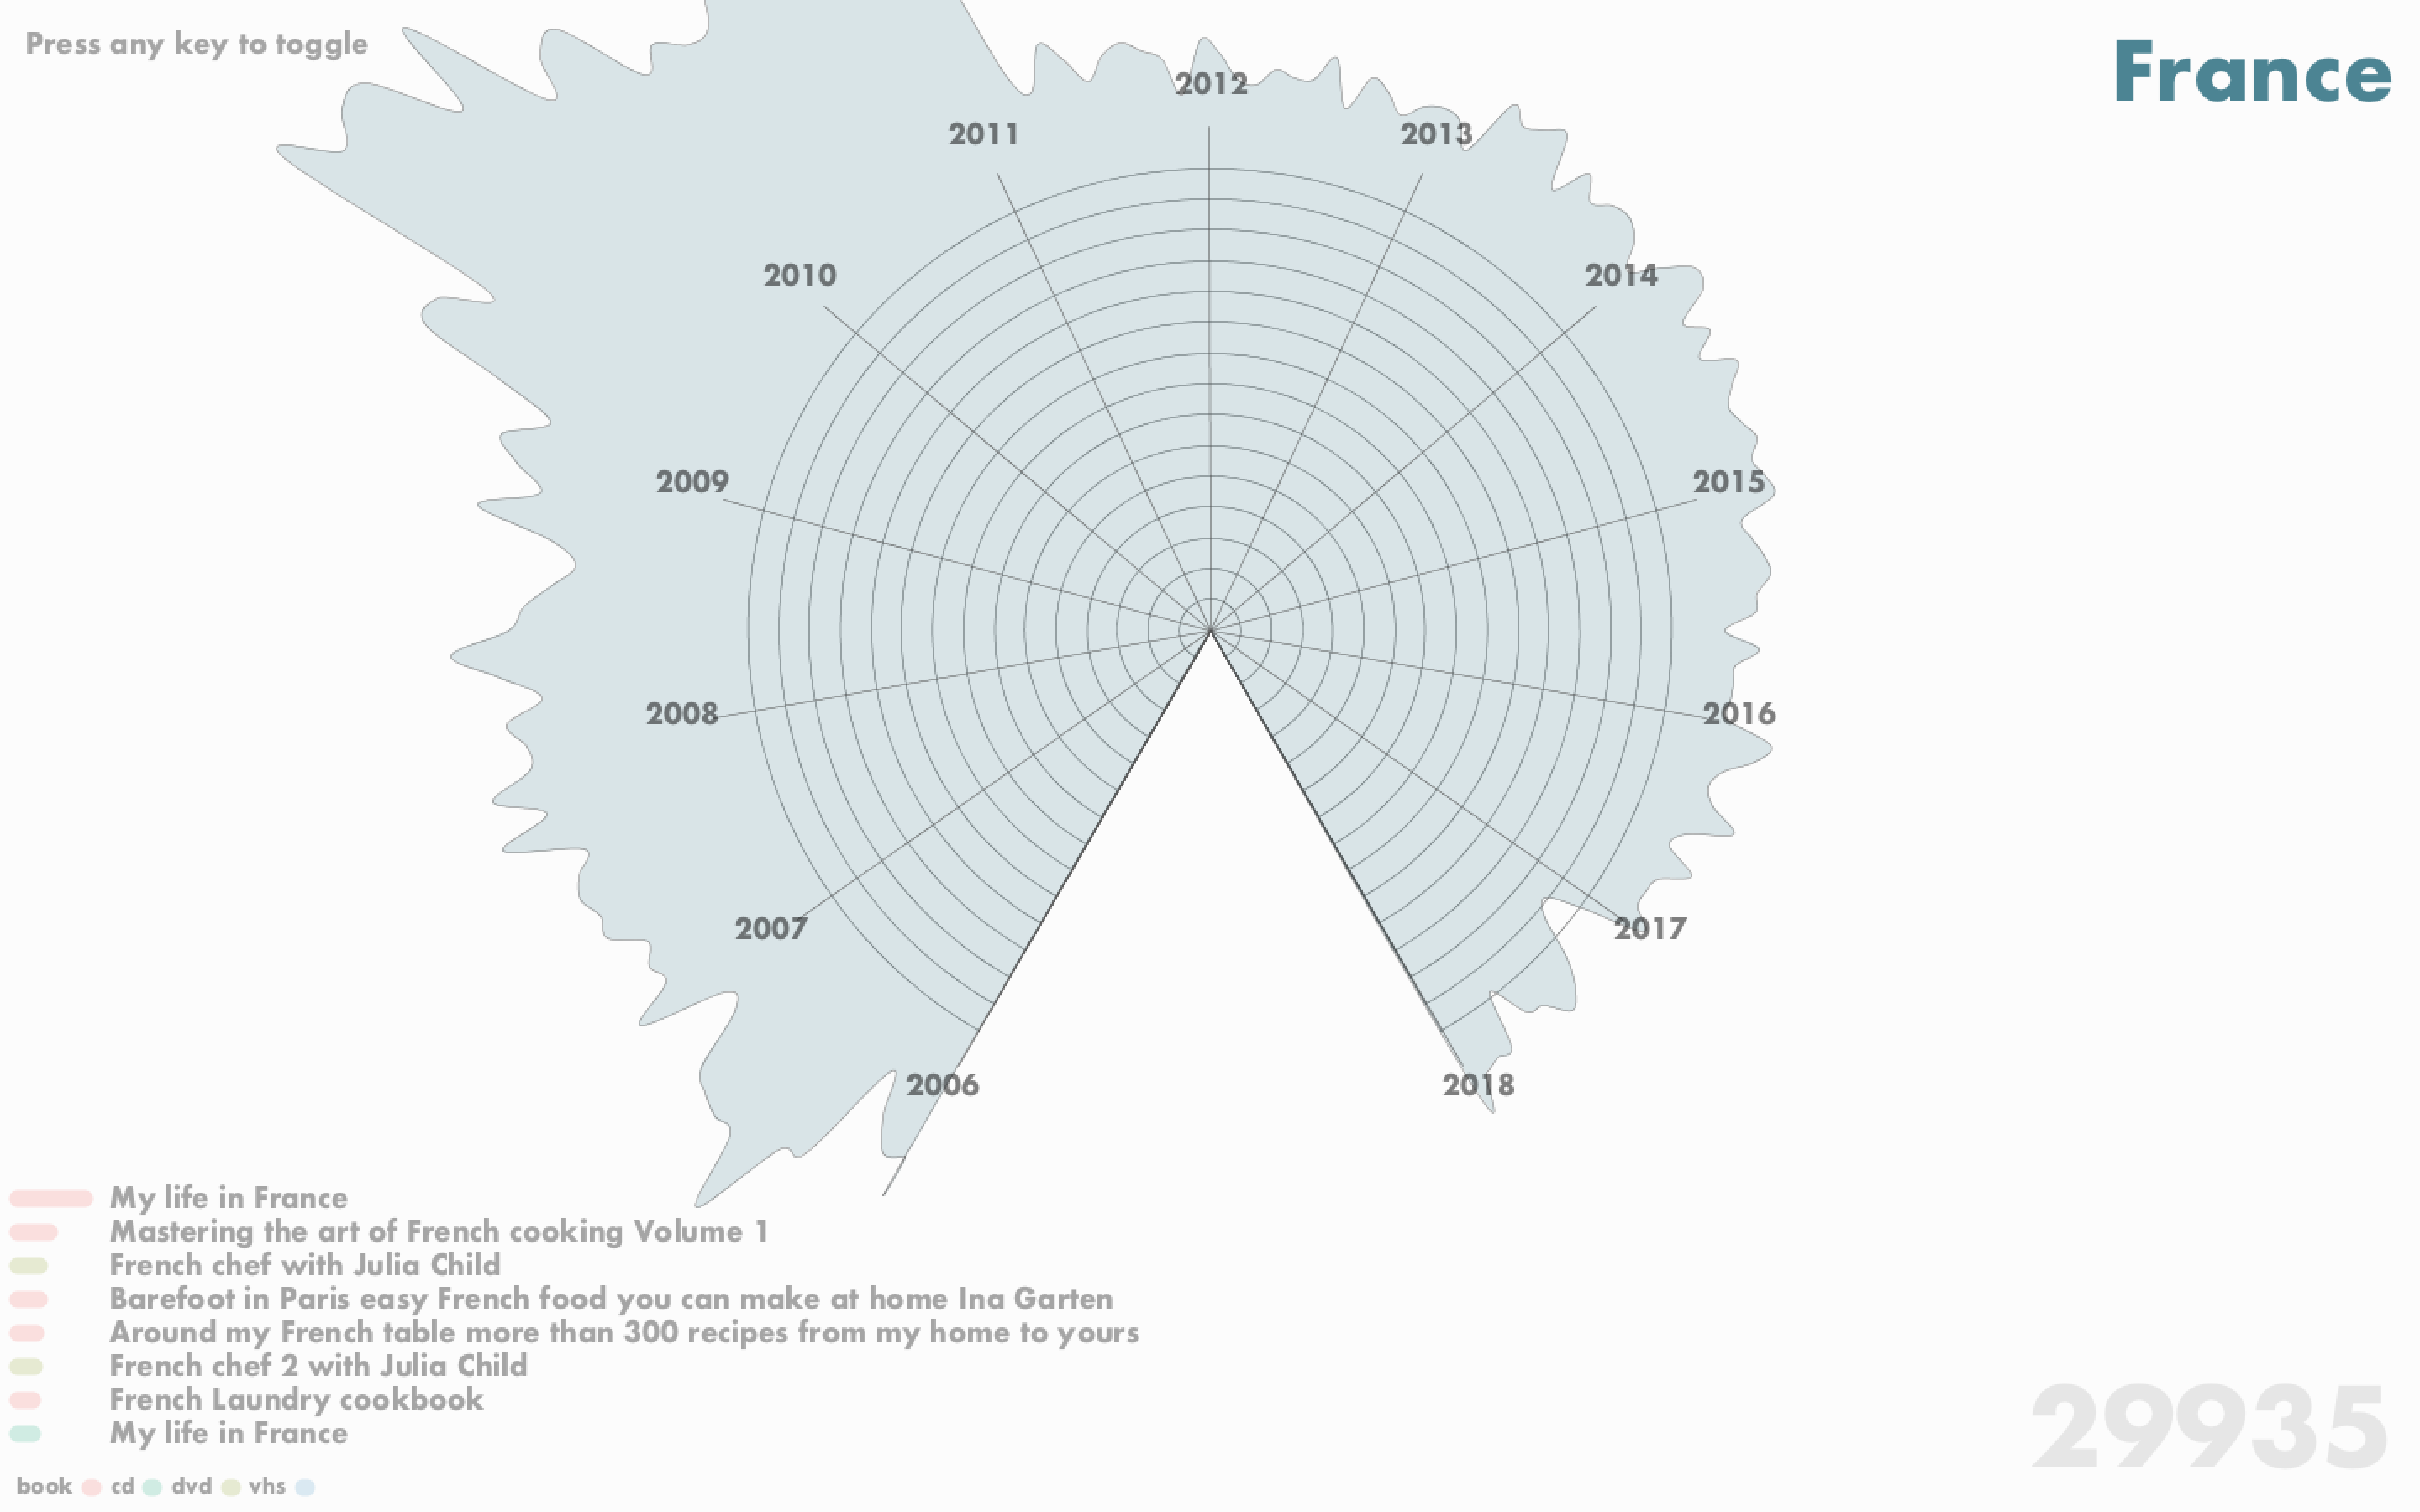
I ended up choosing two modes: one with the radii evenly spaced apart, and one with the radii proportional to the square root of the checkouts. Pressing any key will toggle between the two modes.
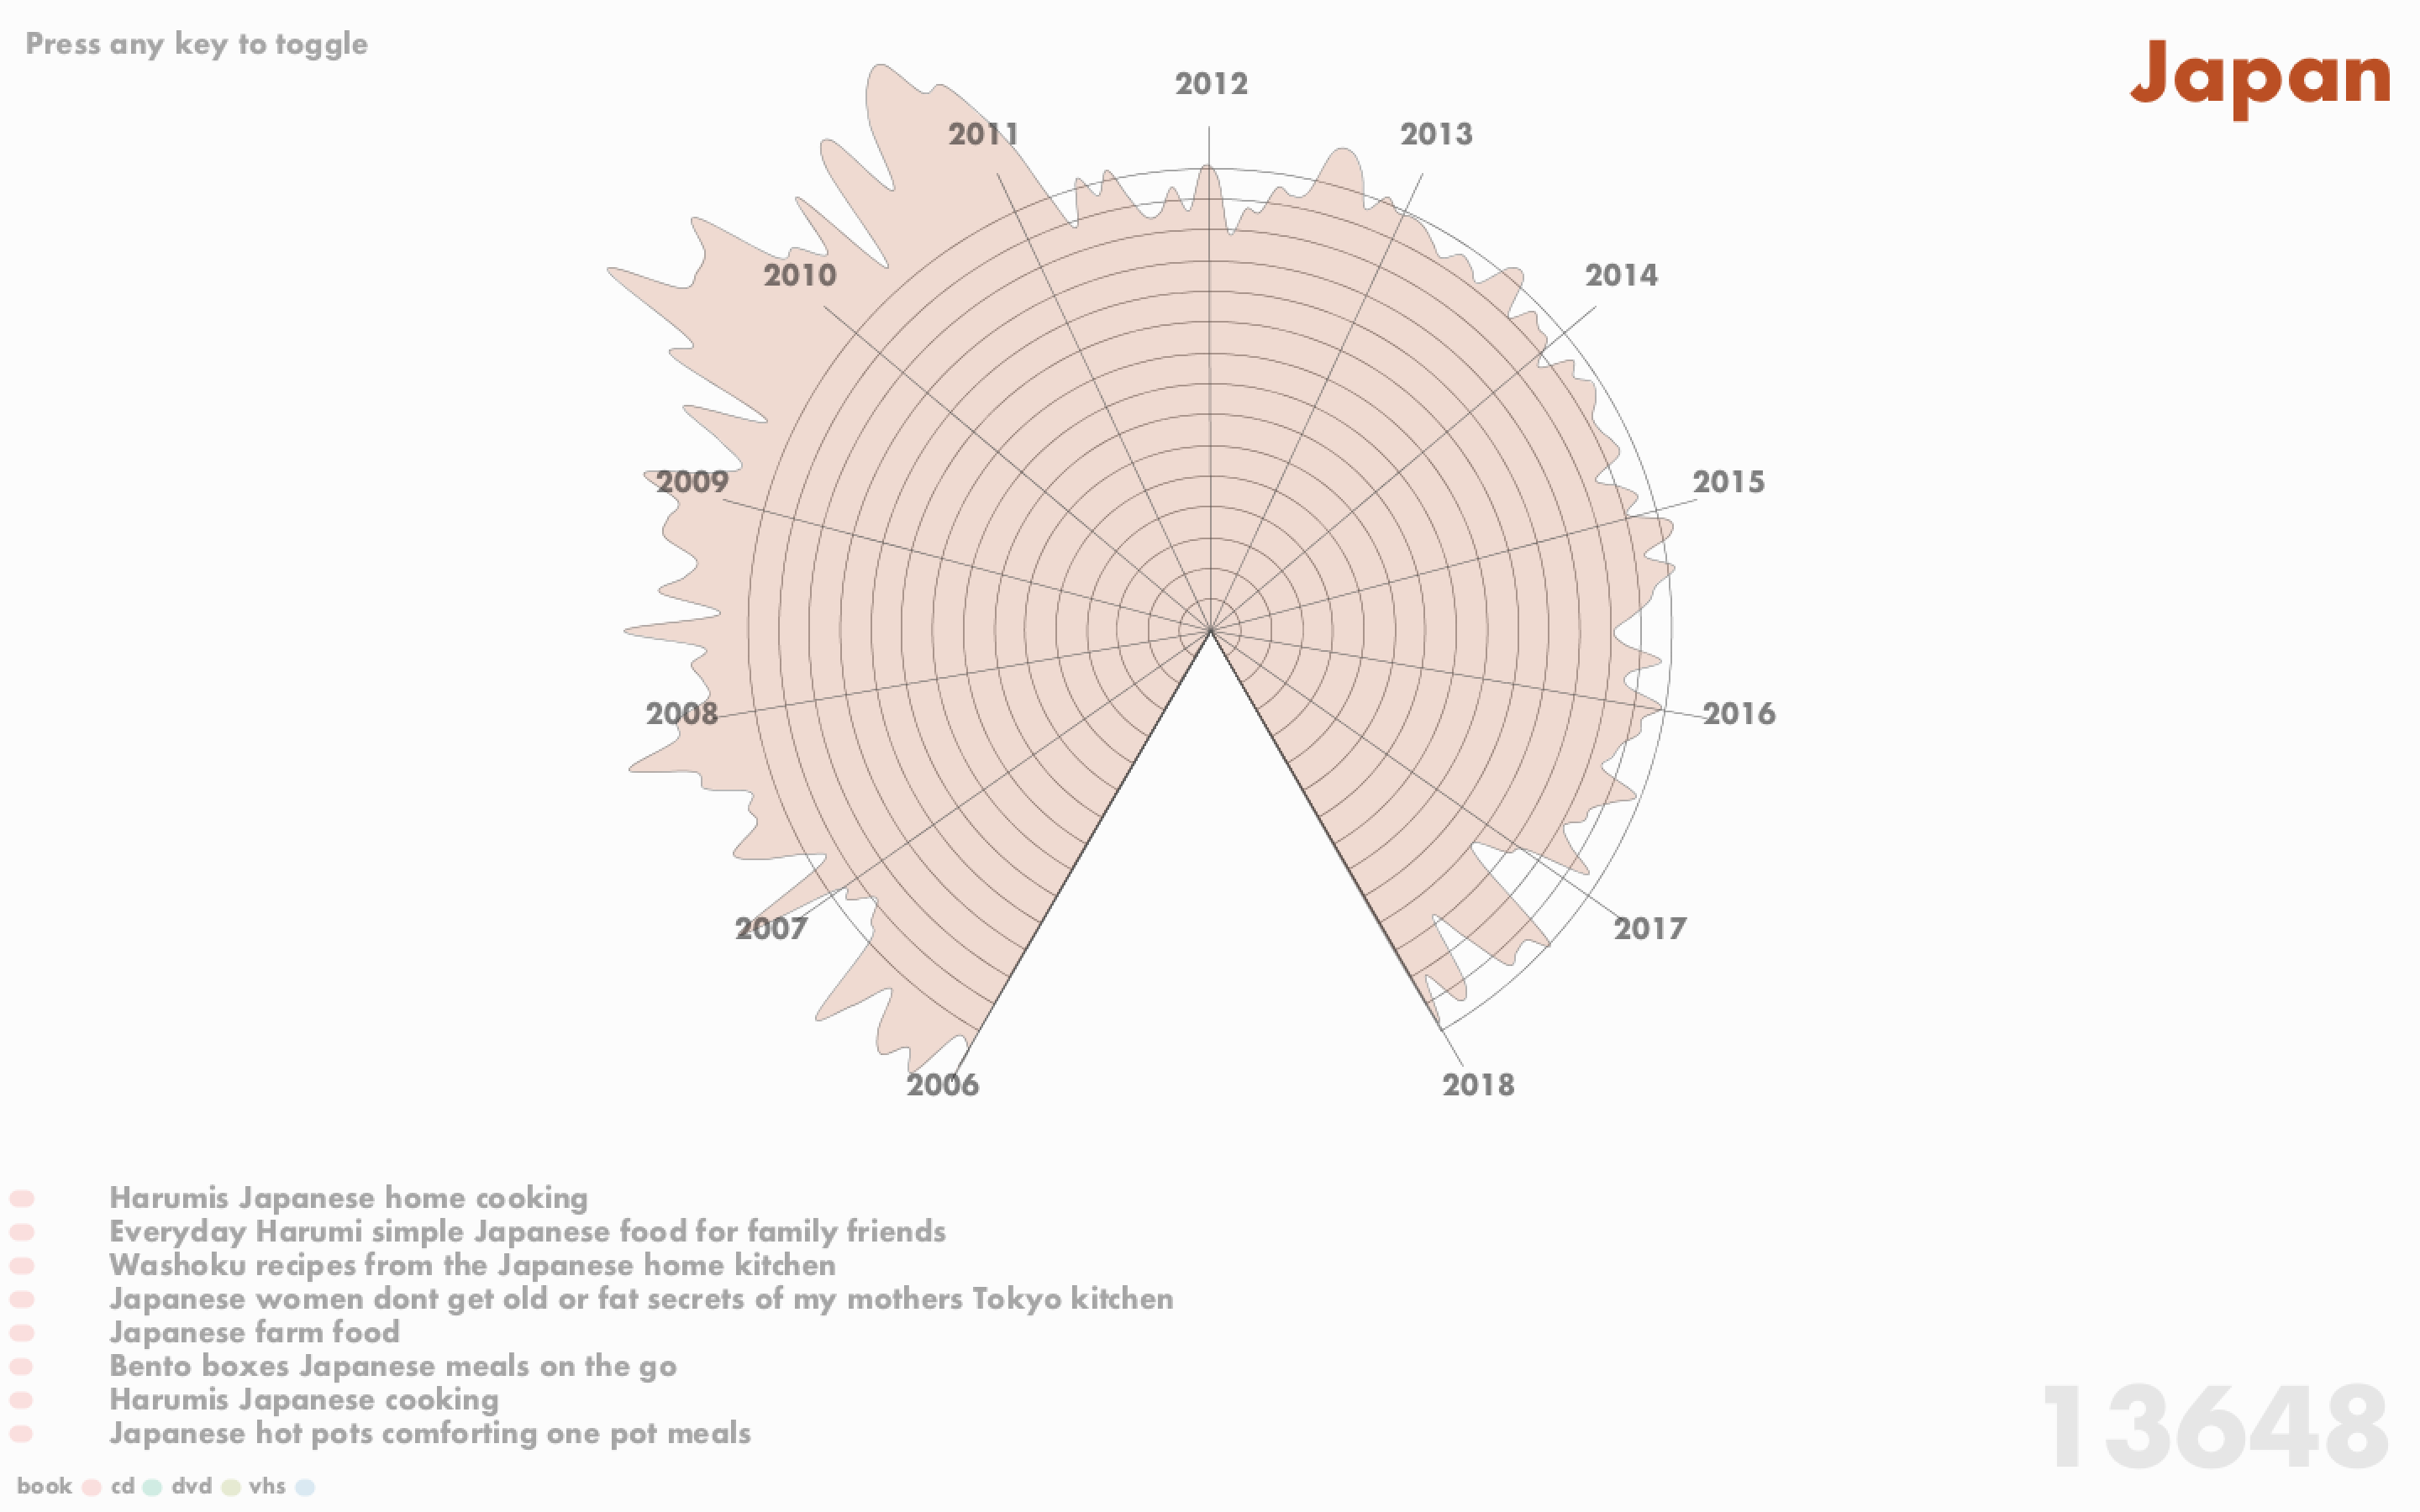
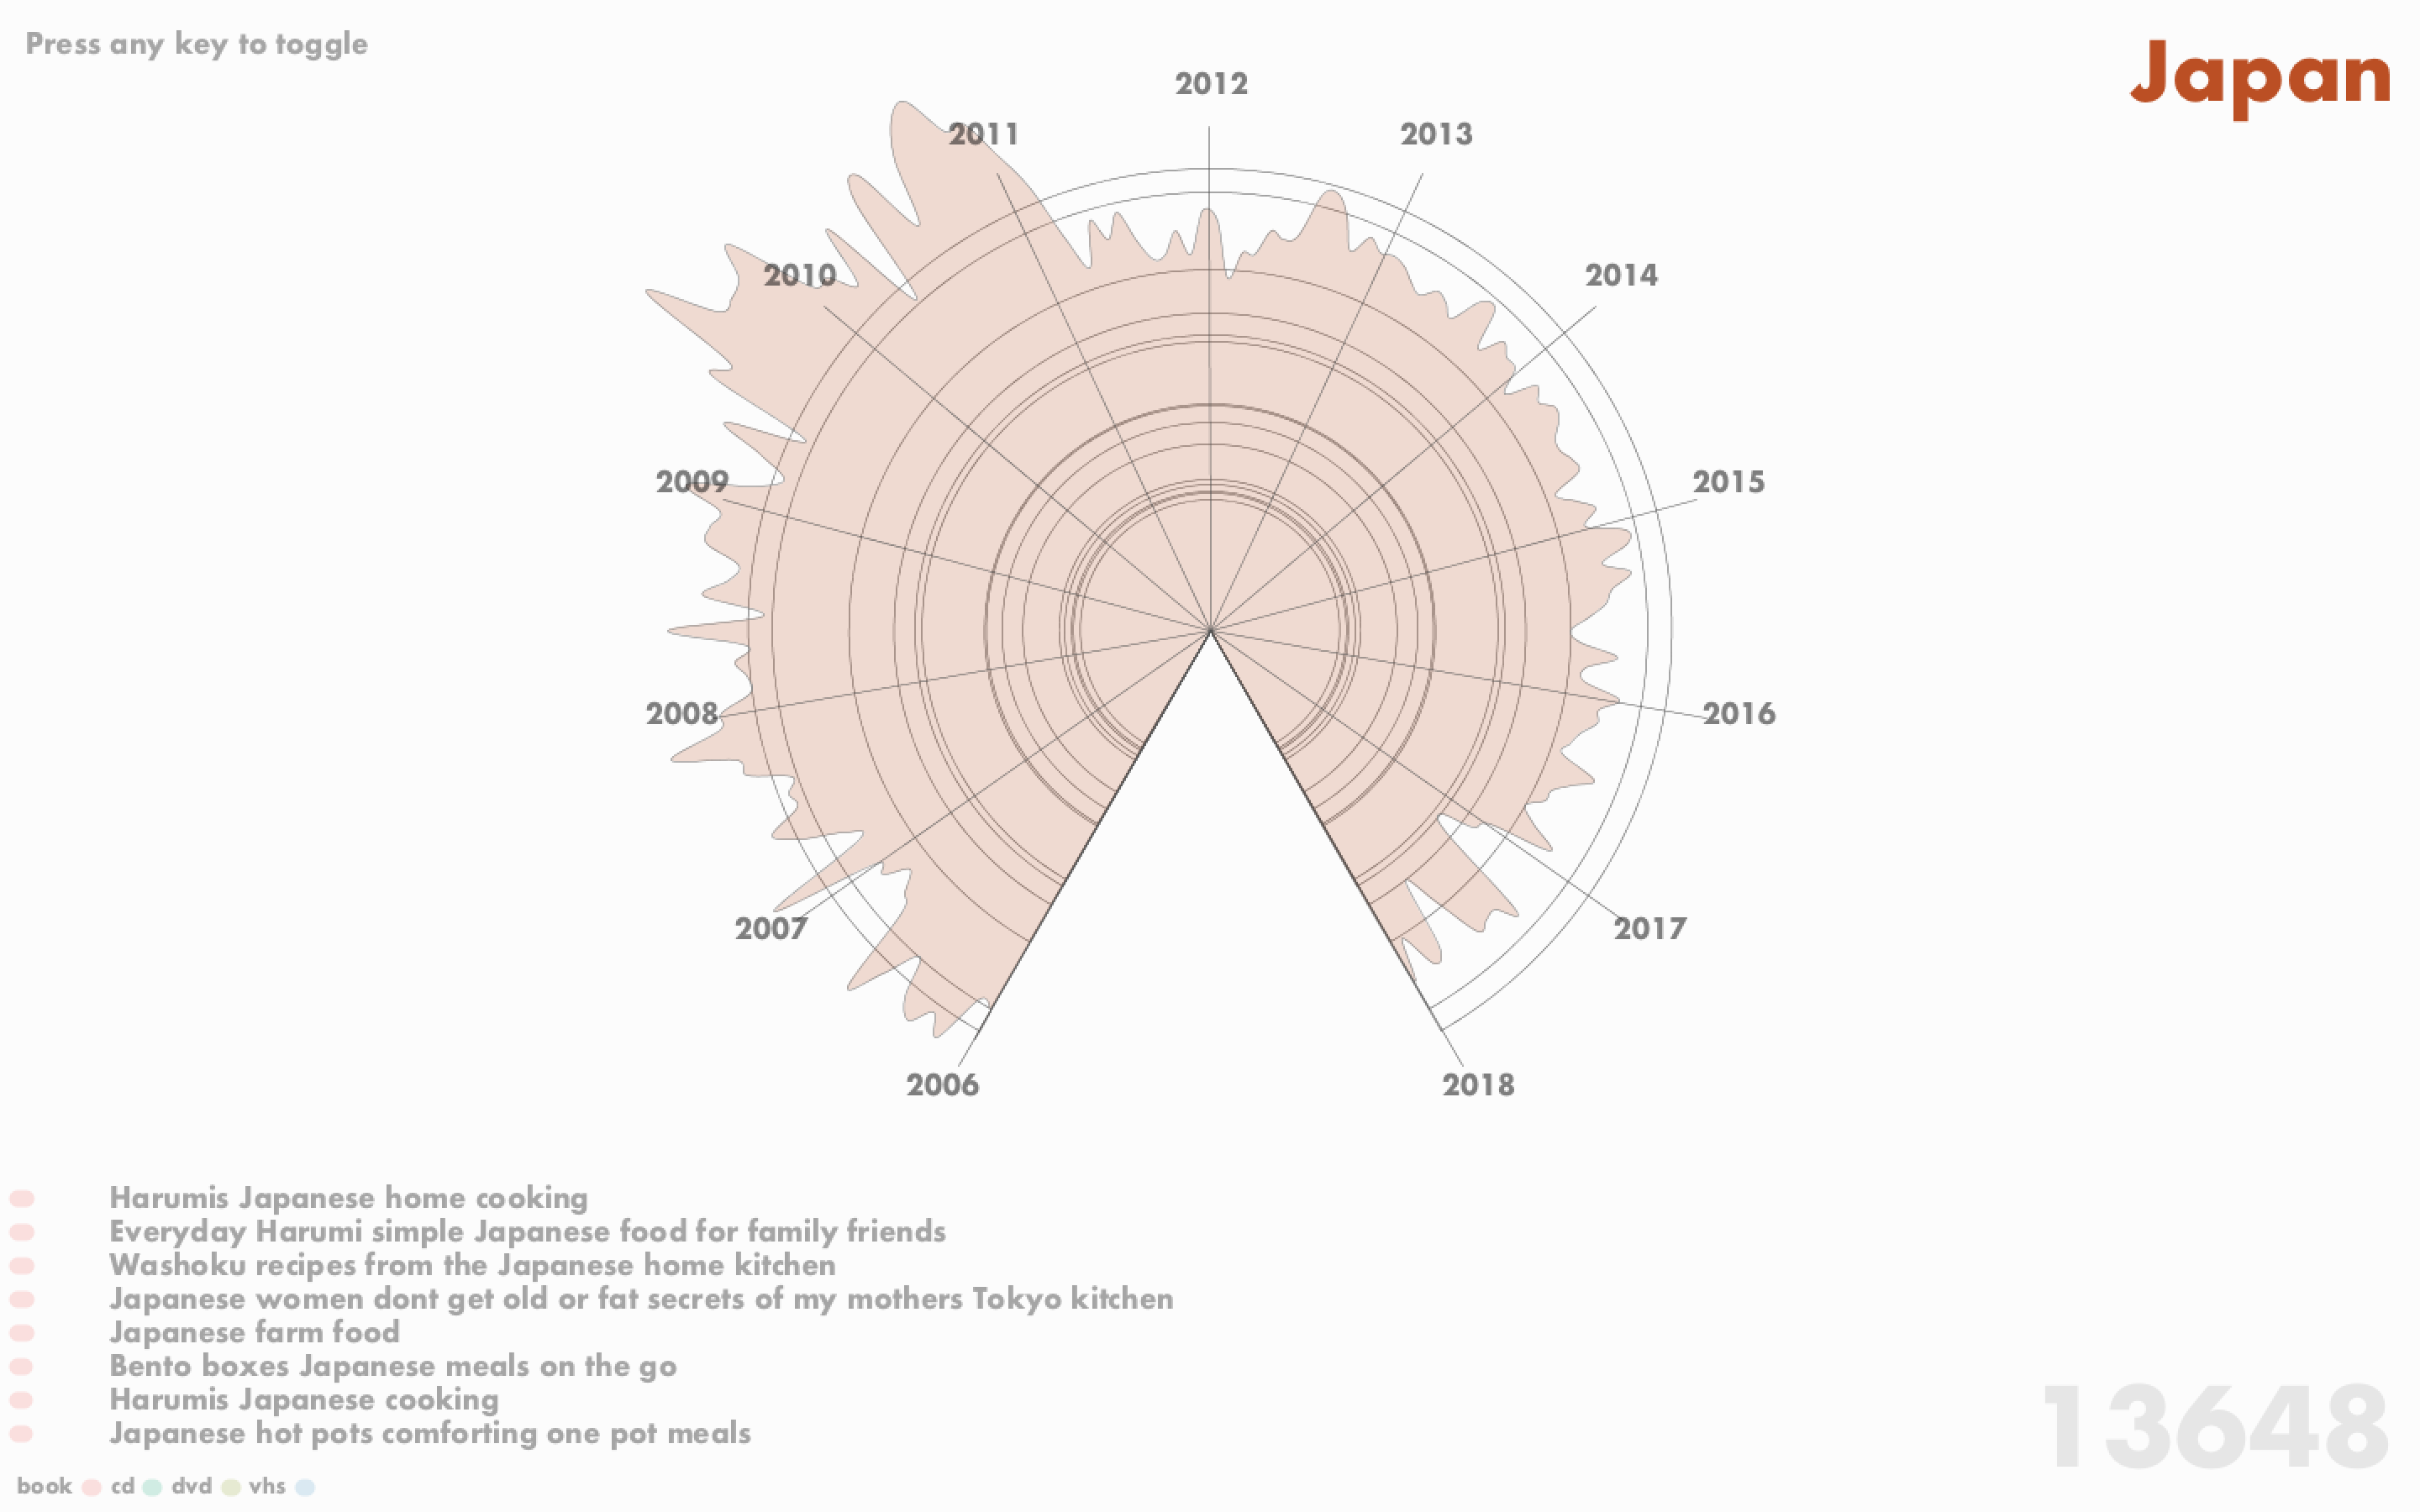
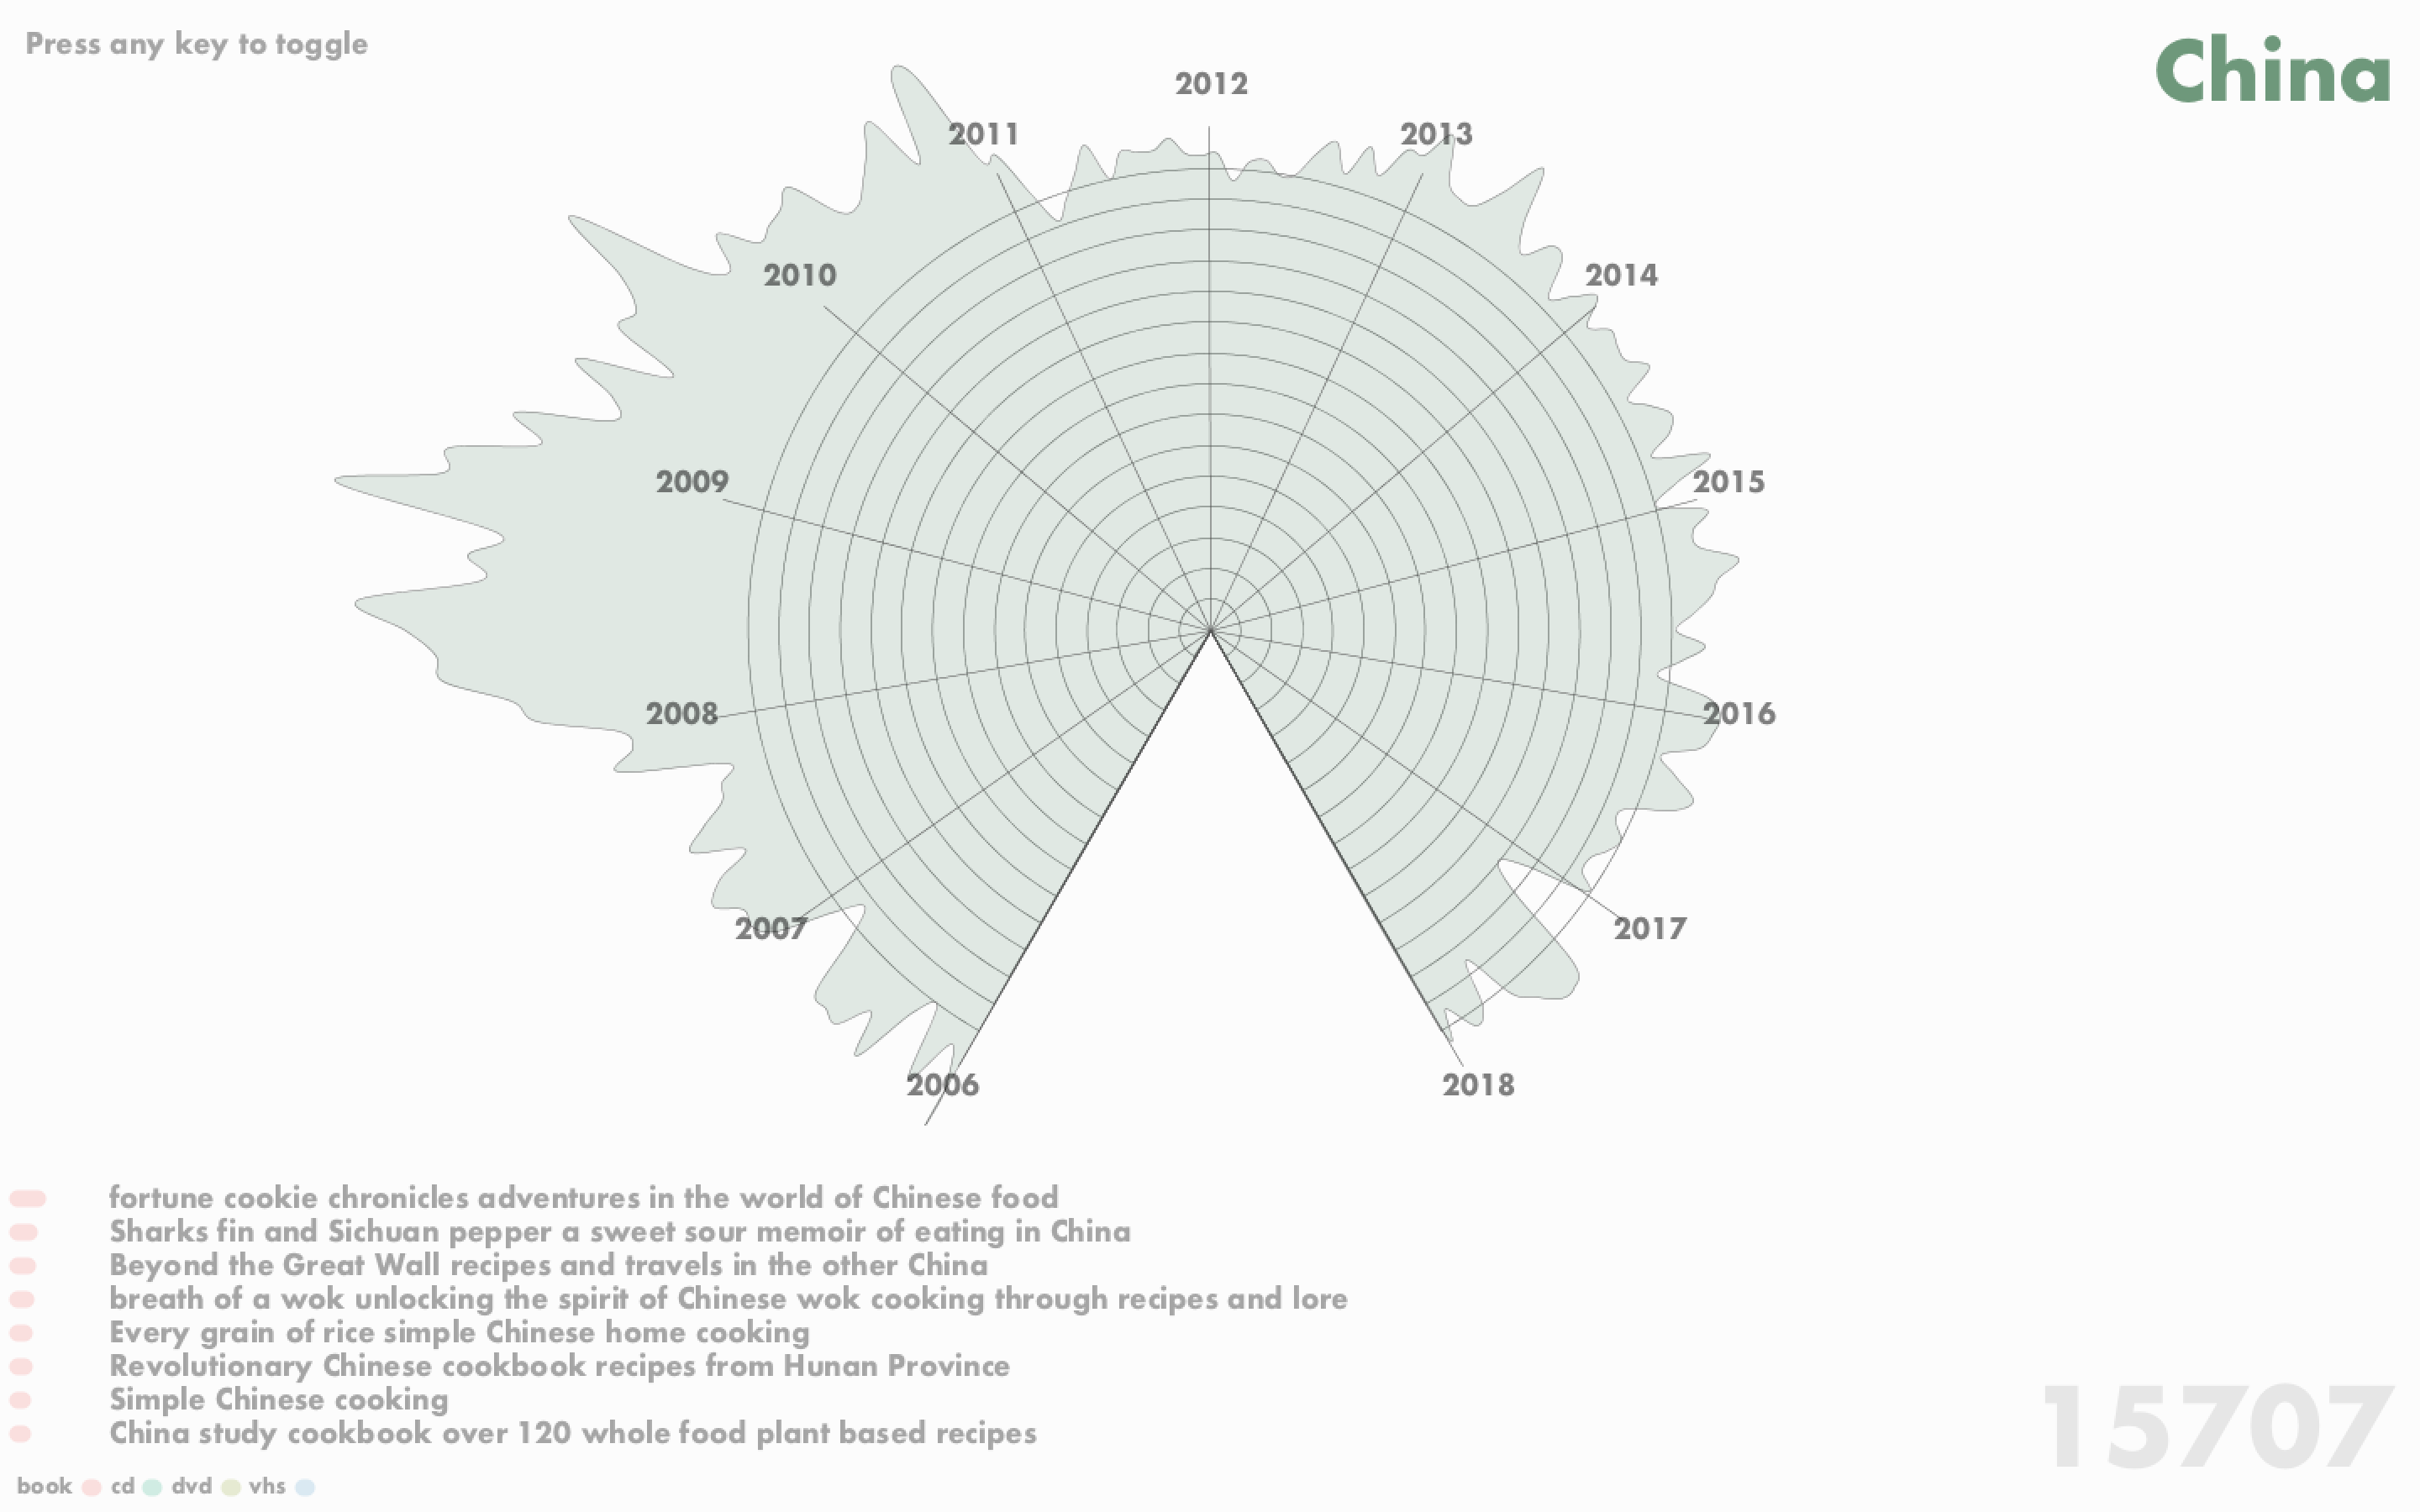
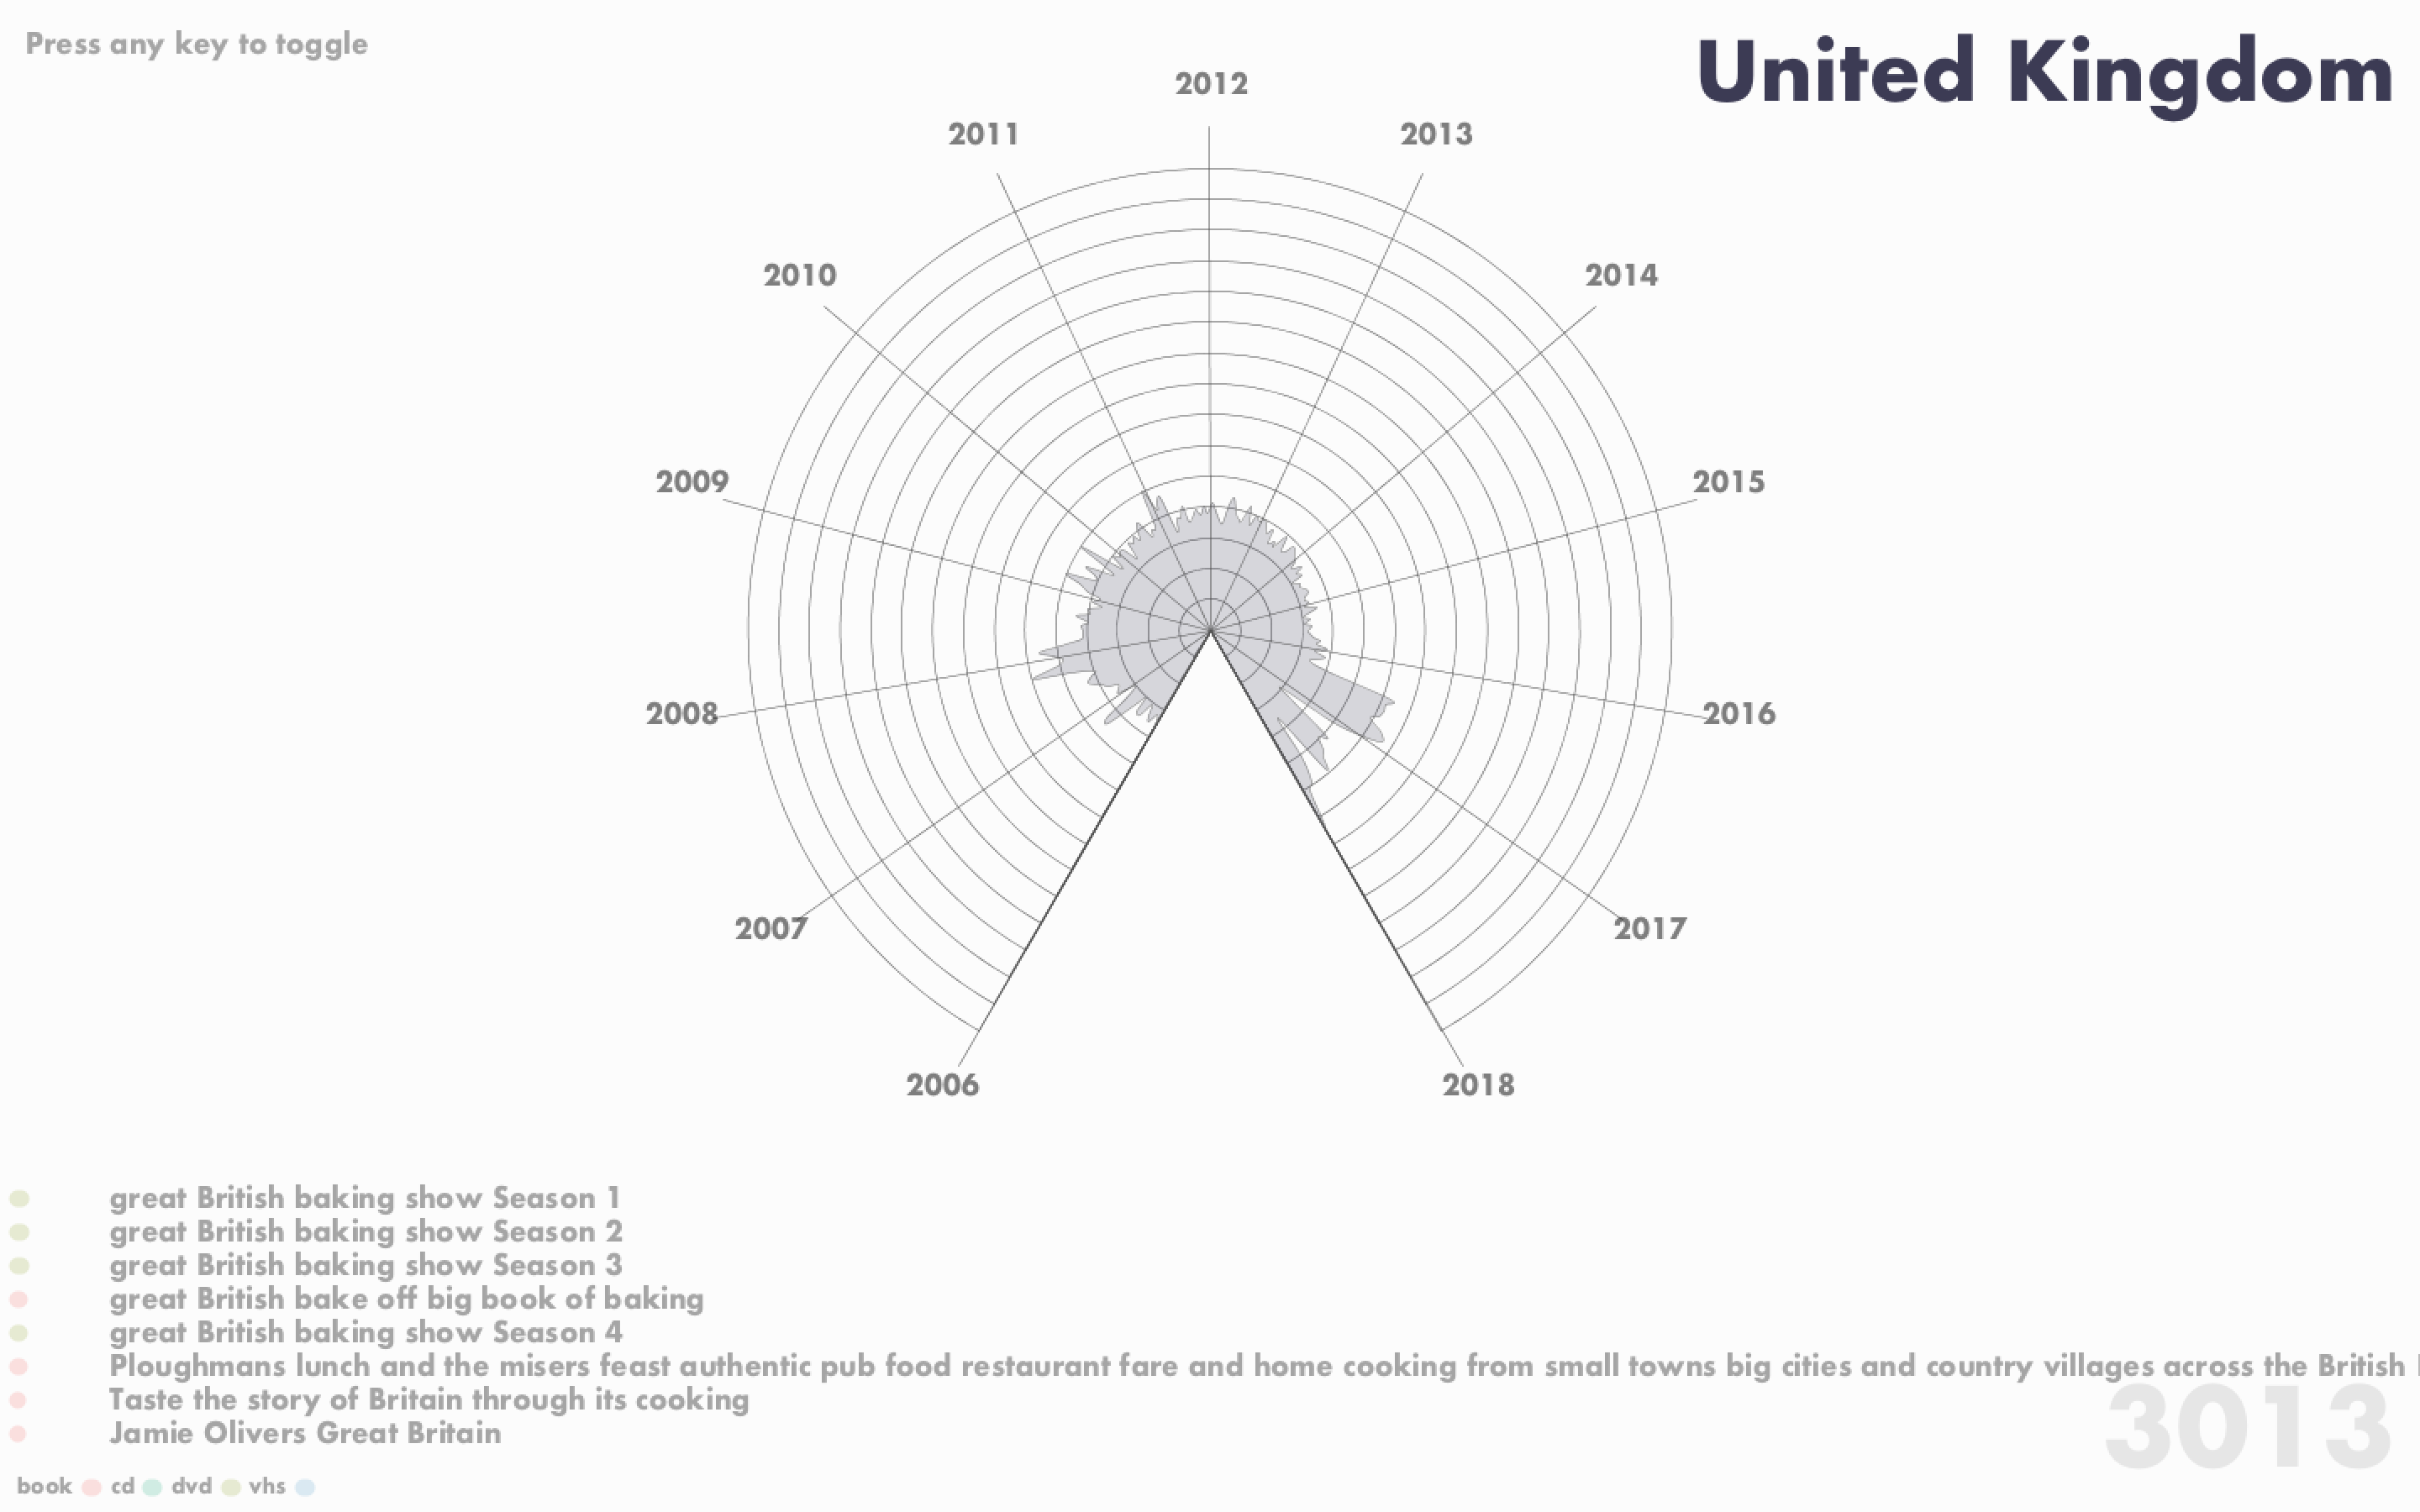
Hovering over a circle will show the number of counts per month. In the lower portion of the screen, the top items (up to 8) are listed for the country, along with a colored bar to the left of the title. The length of the bar indicates the number of check-ins and the color of the bar indicates whether the item is a book, CD, DVD, or VHS. The bottom right corner shows the total number of checkouts for the country.
Unfortunately for some of the most popular cuisines (#1 Italy, #2 France, #3 India), the rollover graph goes off the screen. (I tried plotting the log counts or sqrt counts, but it smoothed out too much of the variation between months, so I decided not to do that.)
Some results that caught my eye included the noticeable peak of interest in Chinese food around 2008-2011 followed by a decline:
while Korean food seemed to regain some popularity in 2016 onwards:

and interest in the United Kingdom jumped significantly in 2016. Moreover, the top 5 items for the UK are all related to the Great British Bake Off, and half of the most popular items are DVDs for that show:
Hovering over a circle will show the number of counts per month. In the lower portion of the screen, the top items (up to 8) are listed for the country, along with a colored bar to the left of the title. The length of the bar indicates the number of check-ins and the color of the bar indicates whether the item is a book, CD, DVD, or VHS. The bottom right corner shows the total number of checkouts for the country.
Unfortunately for some of the most popular cuisines (#1 Italy, #2 France, #3 India), the rollover graph goes off the screen. (I tried plotting the log counts or sqrt counts, but it smoothed out too much of the variation between months, so I decided not to do that.)
Some results that caught my eye included the noticeable peak of interest in Chinese food around 2008-2011 followed by a decline:
while Korean food seemed to regain some popularity in 2016 onwards:
and interest in the United Kingdom jumped significantly in 2016. Moreover, the top 5 items for the UK are all related to the Great British Bake Off, and half of the most popular items are DVDs for that show:
Code