Forex tree
MAT 259, 2018
Zhenyu Yang
Concept
The main idea is that using processing to visualize how the EUR/USD pair rate grows and also visualize the rate future trend predicted by a pre-trained reinforcement learning model. To visualize the two cases(rate rising/dropping), I decided to use structures with branches. Each branch can be viewed as a timestamp, where future is divided into two directions from that point of view.
Data source
I use the dataset from OANDA Corporation (a registered Futures Commission Merchant and Retail Foreign Exchange Dealer). With a simulation account, I could obtain the latest rate of any foreign exchange pair(e.x. EUR/USD).
After registering an account and set up a Rest API, I successfully fetched rate data on EUR/USD pair in the processing environment. The data is two-dimensional data with variables of time and rate. The rate is active from Sunday to Friday, 24h/day.
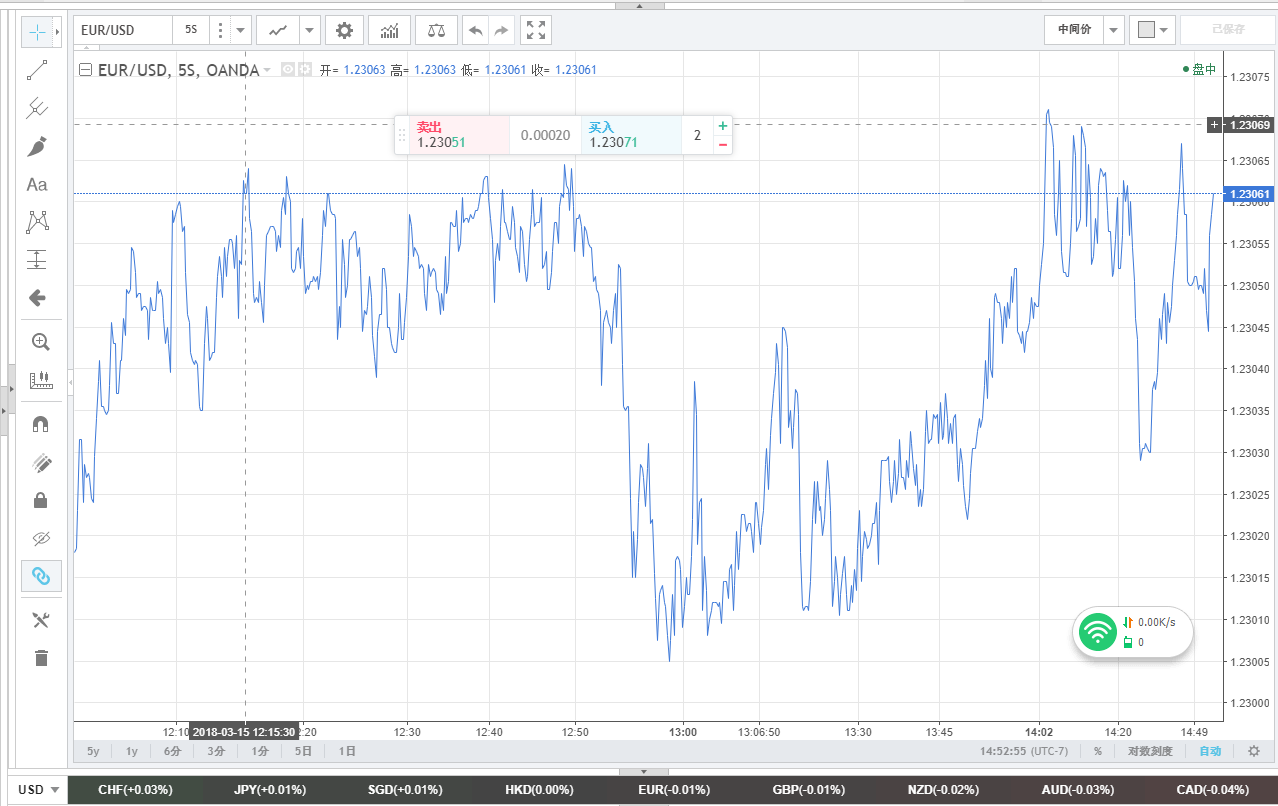
After registering an account and set up a Rest API, I successfully fetched rate data on EUR/USD pair in the processing environment. The data is two-dimensional data with variables of time and rate. The rate is active from Sunday to Friday, 24h/day.
Visual Inspiration
I was inspired by a tree photo. In the photo, a tree is standing on the ground. The outline of a tree starts from its trunk, then keeps branching and growing in all directions.
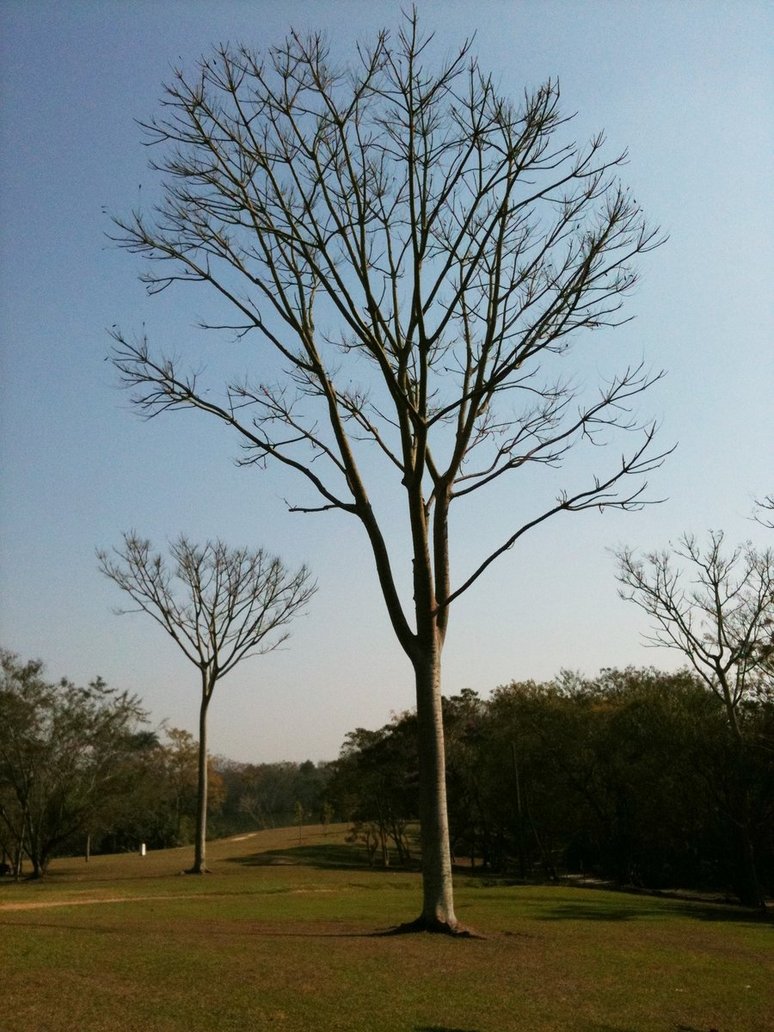
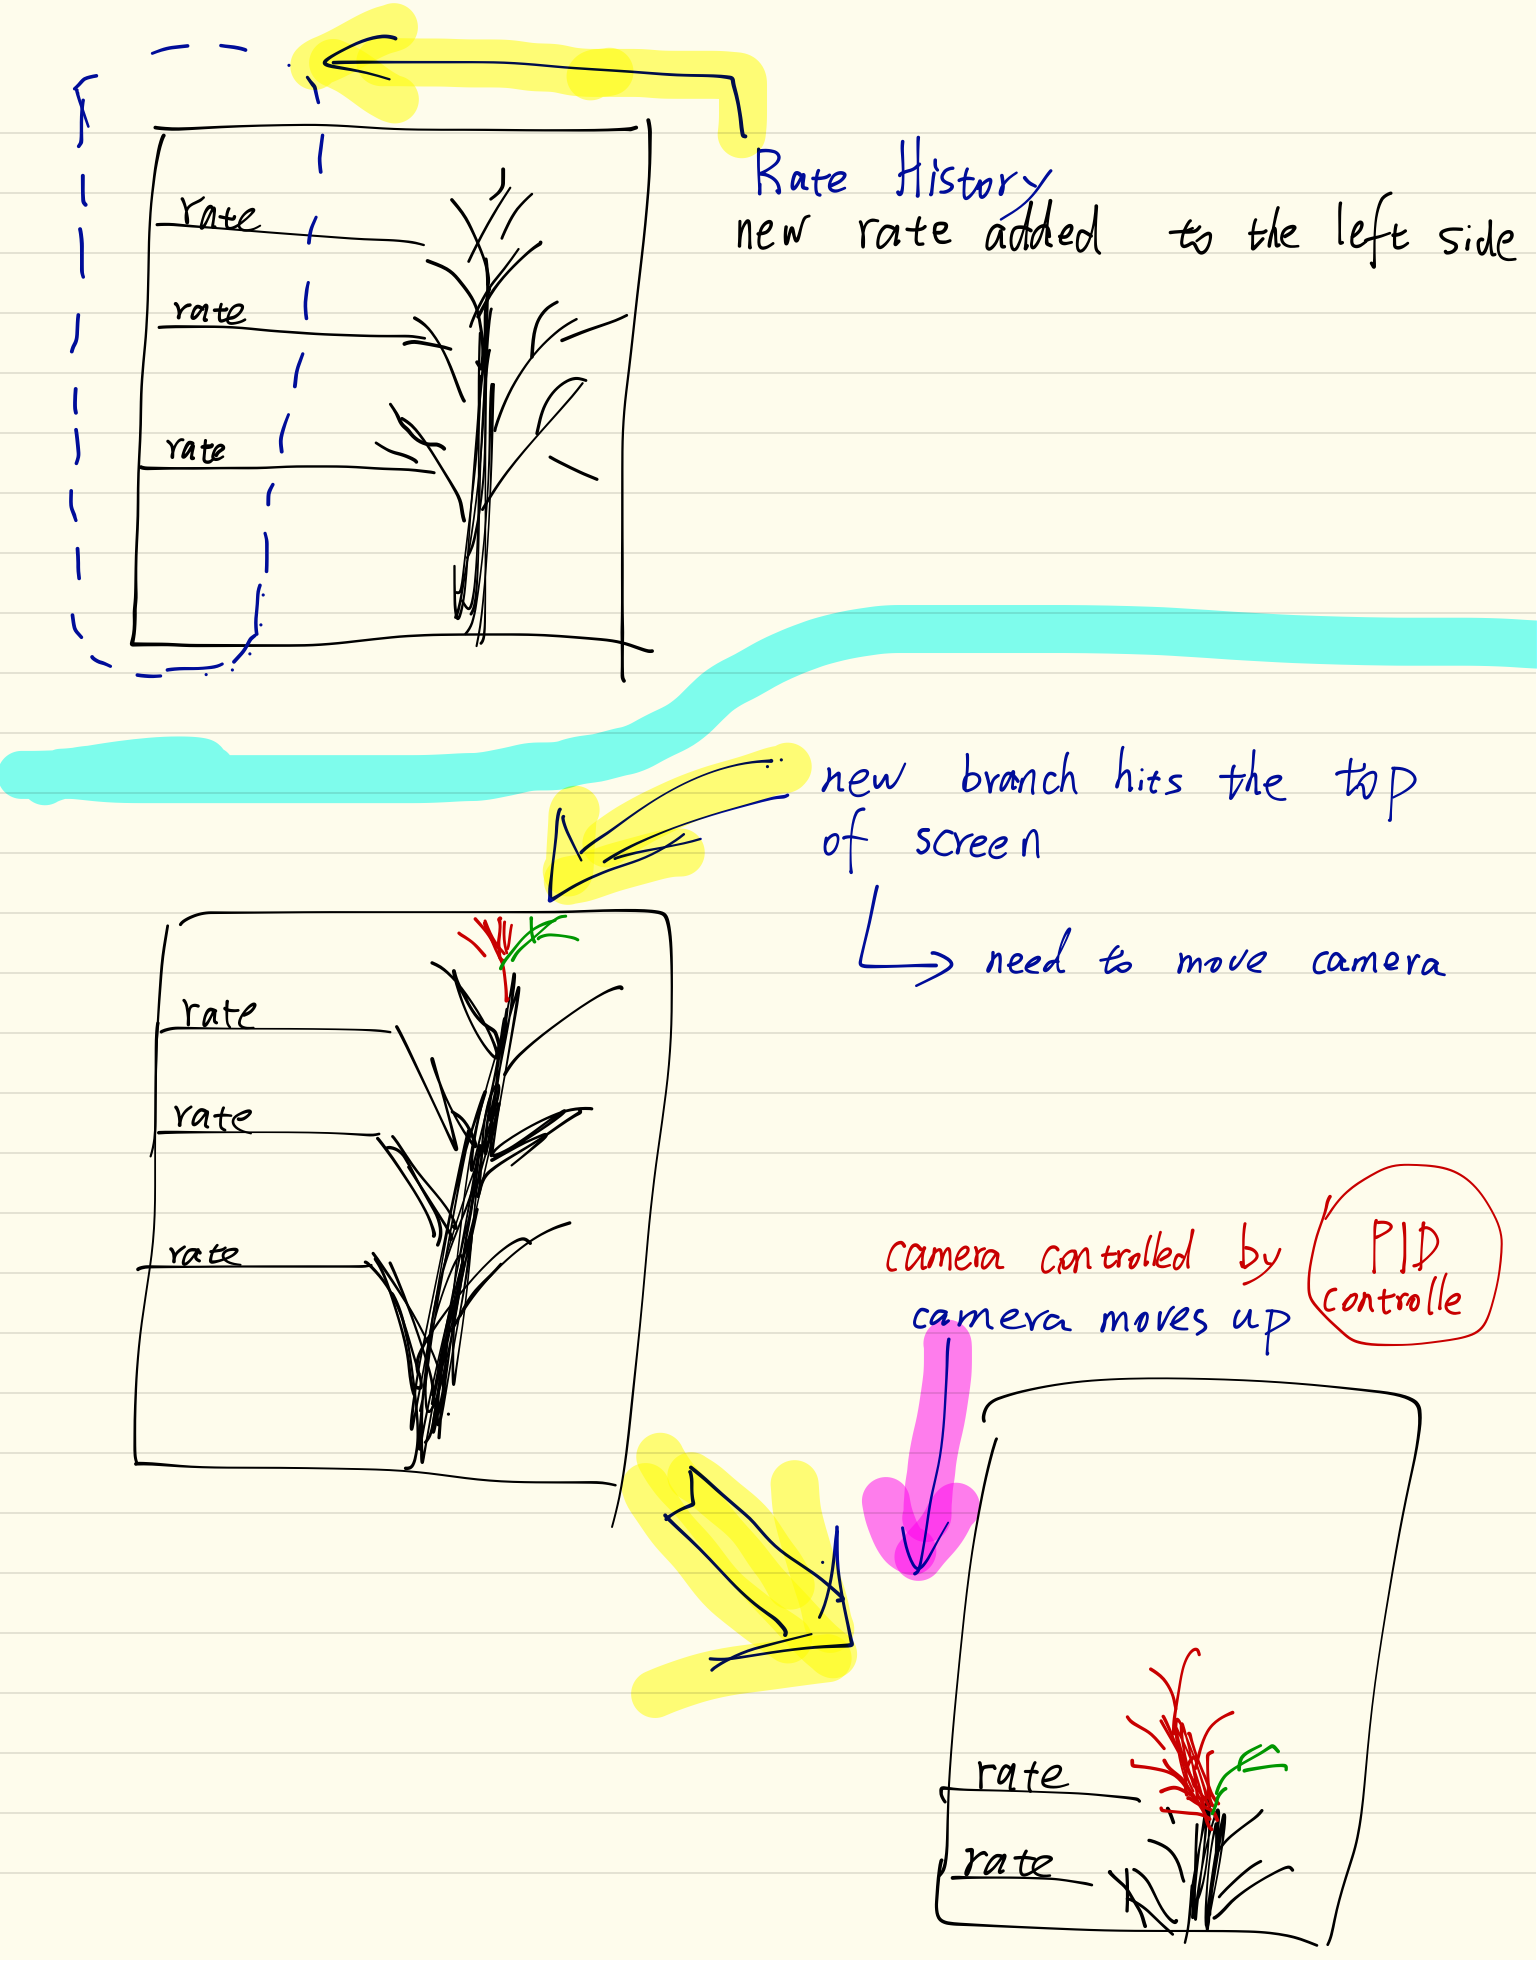
Then I found the following picture, in which a tree is placed in the center, making me think that I can make the center of the screen as a new starting point for each moment when a tree is growing continuously. This idea guided me to a new design of autonomous camera control that always keeps the growing point in the screen center.

I further simplified the image of a tree and obtained various representations of a tree. Some representations were particularly simply and beautiful(shown in the following pictures).


Then I found the following picture, in which a tree is placed in the center, making me think that I can make the center of the screen as a new starting point for each moment when a tree is growing continuously. This idea guided me to a new design of autonomous camera control that always keeps the growing point in the screen center.
I further simplified the image of a tree and obtained various representations of a tree. Some representations were particularly simply and beautiful(shown in the following pictures).
Process and Sketches
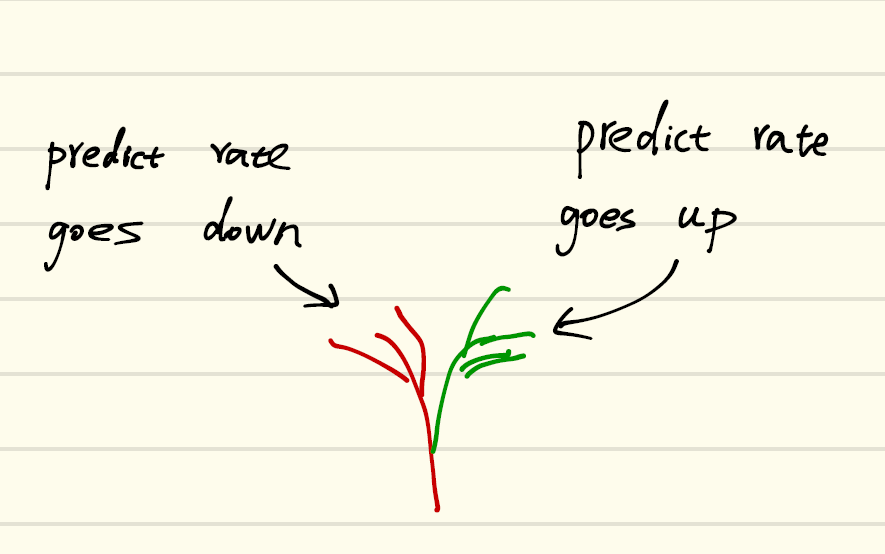
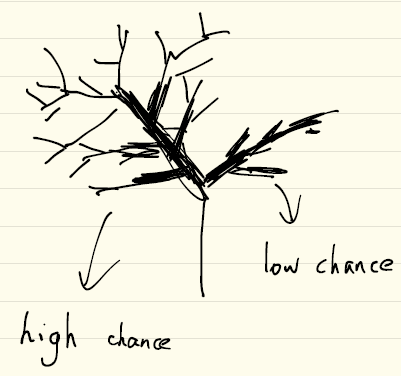
I looked into the simplified image of a tree and suddenly realized that the tree shape contains all the features that I was looking for, as the tree shape is a set of branches, and grows from a base point into different directions, which can be mapped into the different future trends of a forex pair rate. With some drawing and sketching, I finally decided to use a branch to represent the EUR/USD Forex rate in a period of 600 frames. During each period, a pre-trained reinforcement learning module will be used to determine the probability that the Forex rate will go up in the next period. Then this probability will be used to guide the branch divided into two directions and grow differently.
The two divided parts are two new branches and will continue to group for a while. These colors and the shapes of these two new branches convey information of rising probability of a Forex pair rate in the next 600 frames.
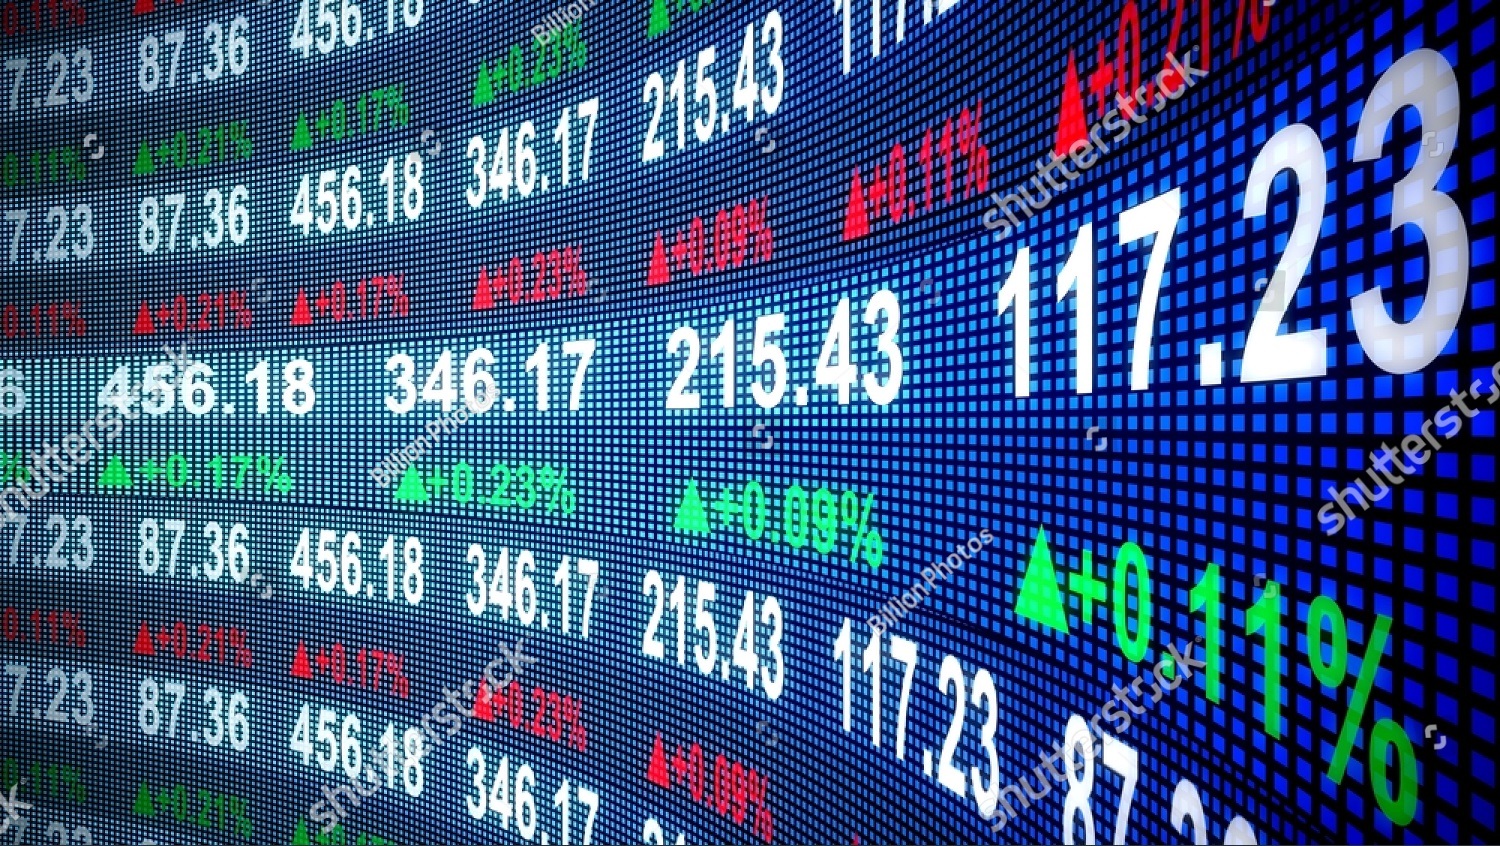
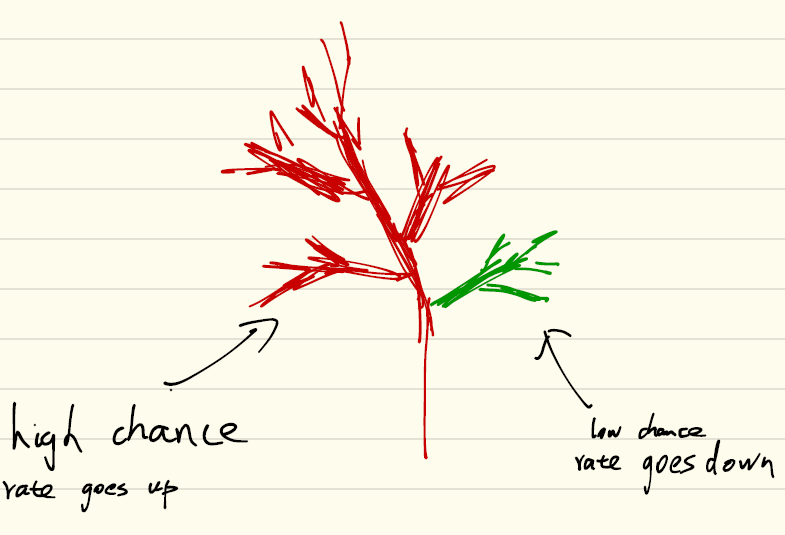
Color coding:
The colors of branches are in red and green, which were mainly based on the color scheme of US stock market. In the US stock market, stocks are in green color if their prices are rising. on the contrary, stocks are in red color if their prices are dropping.
The probability of rate rises affects the exuberance of two sub-branches. If a sub-branch shows exuberance, it means that the forex rate has higher chance to change in the way the sub-branch represents.
The two divided parts are two new branches and will continue to group for a while. These colors and the shapes of these two new branches convey information of rising probability of a Forex pair rate in the next 600 frames.
Color coding:
The colors of branches are in red and green, which were mainly based on the color scheme of US stock market. In the US stock market, stocks are in green color if their prices are rising. on the contrary, stocks are in red color if their prices are dropping.
The probability of rate rises affects the exuberance of two sub-branches. If a sub-branch shows exuberance, it means that the forex rate has higher chance to change in the way the sub-branch represents.
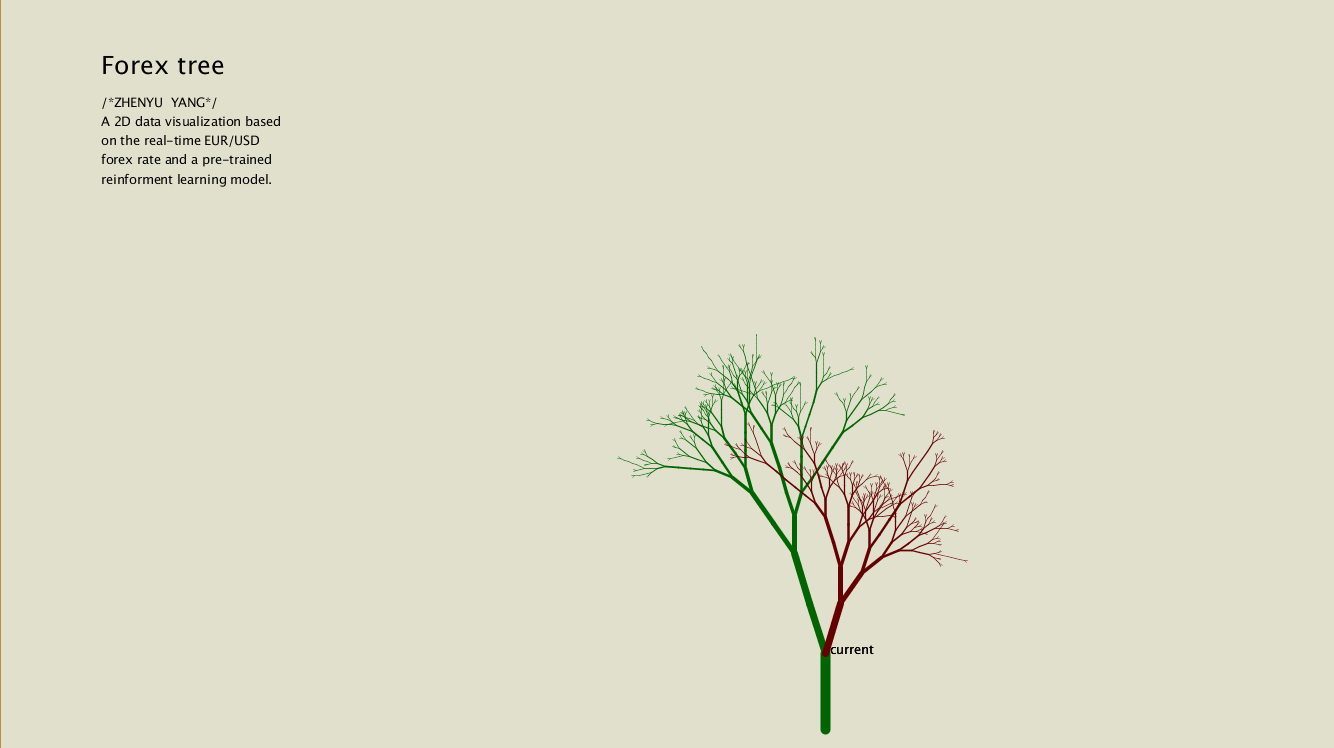
Final result
Some screenshots of the final results:
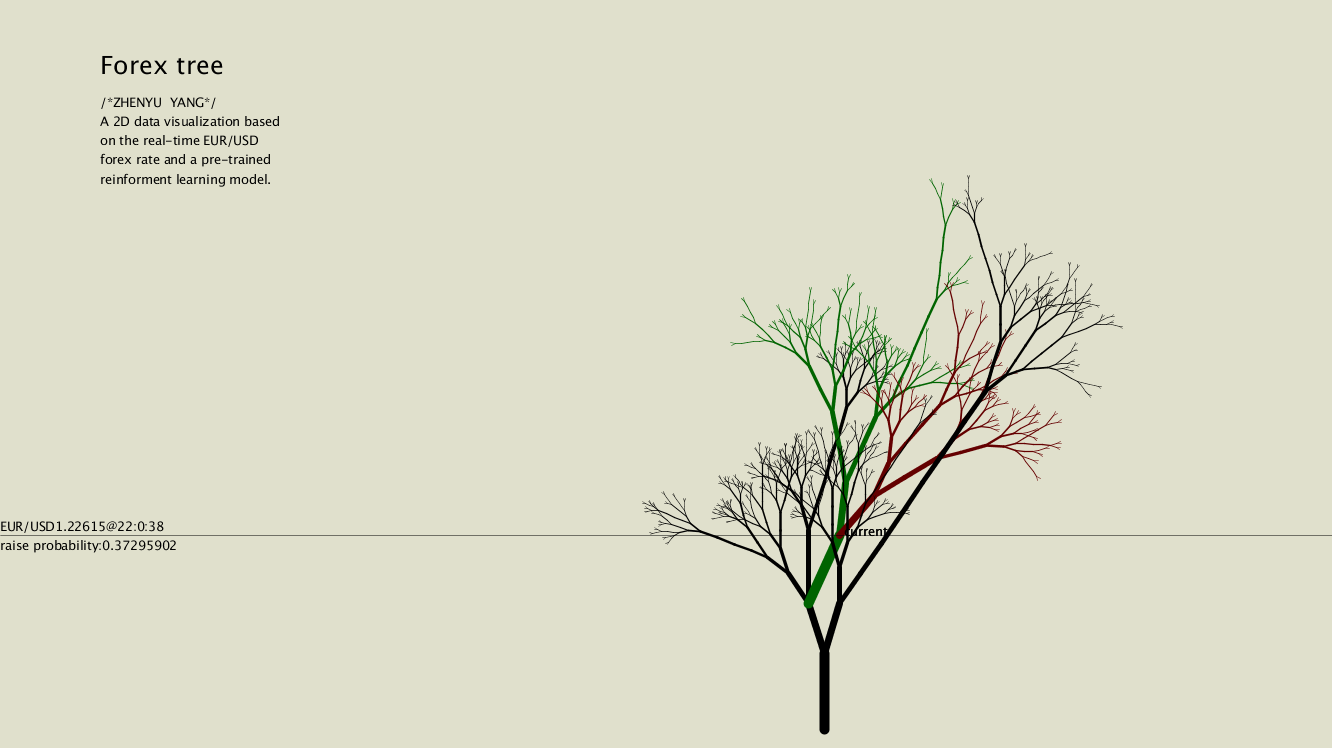
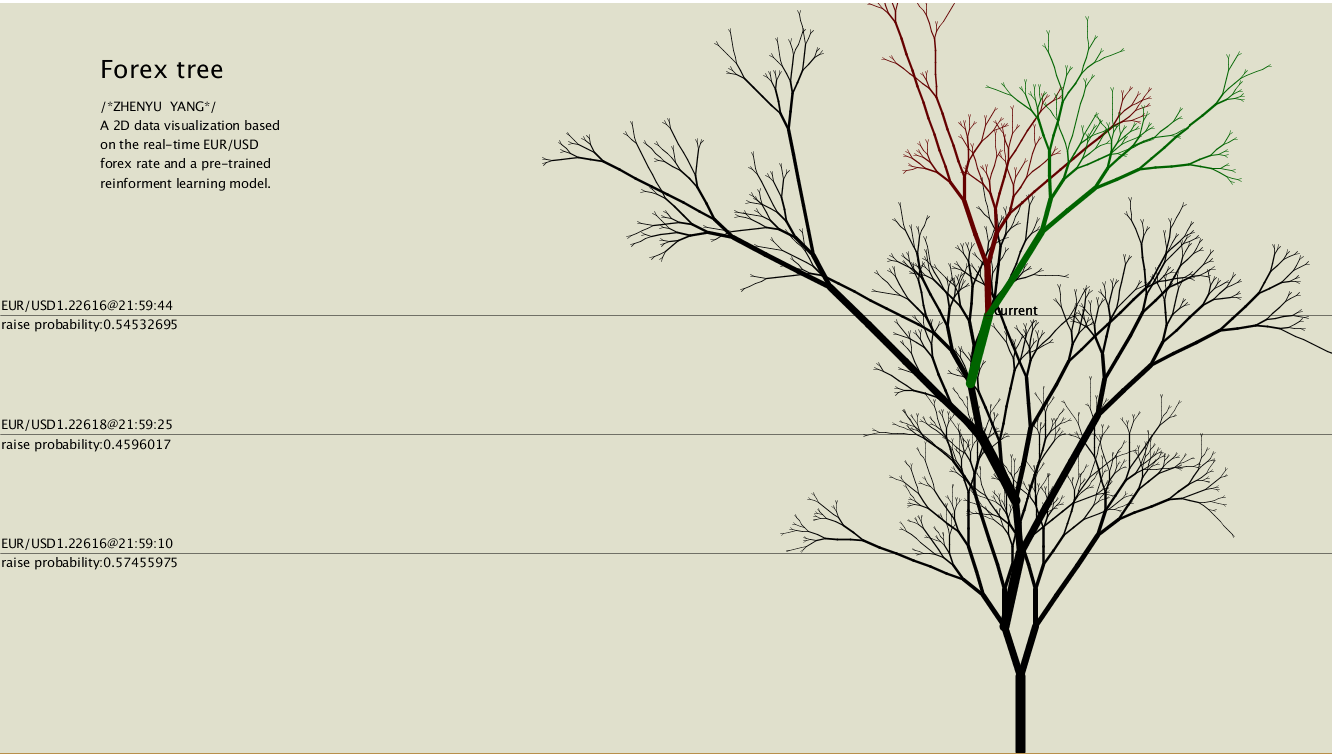
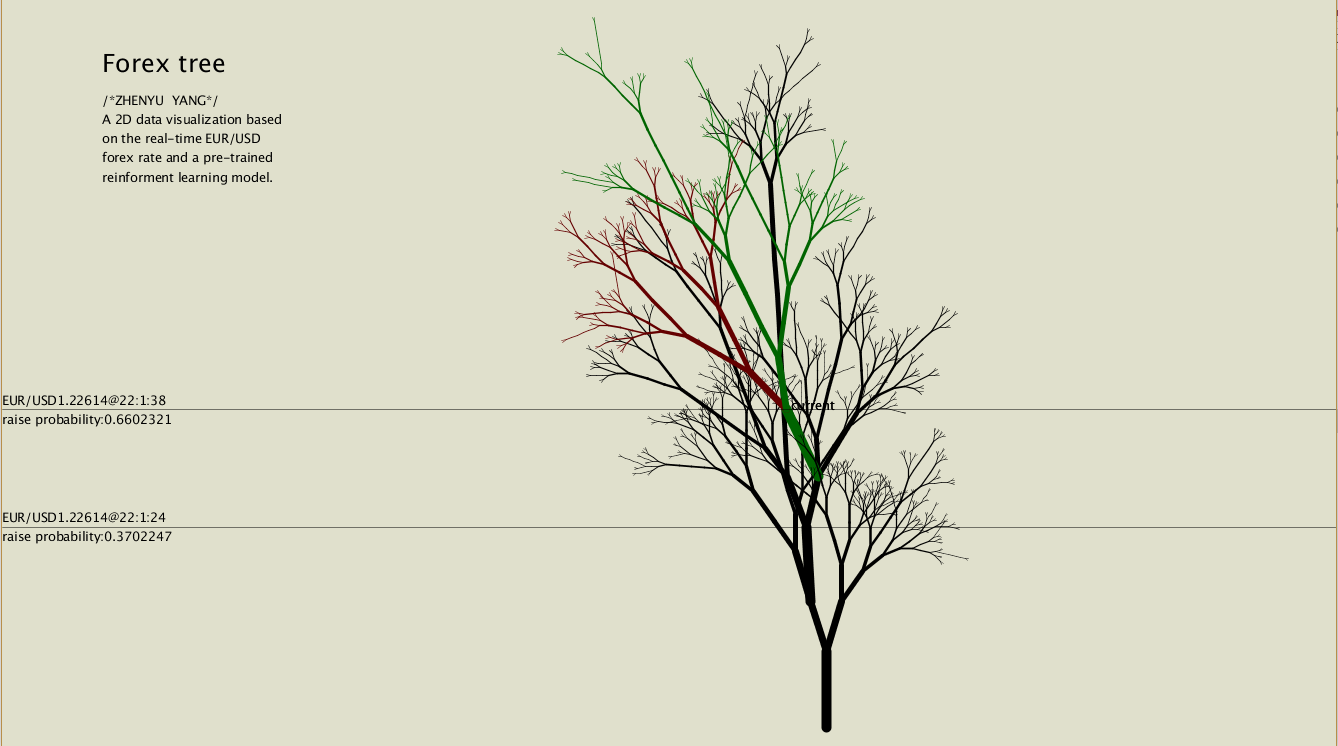
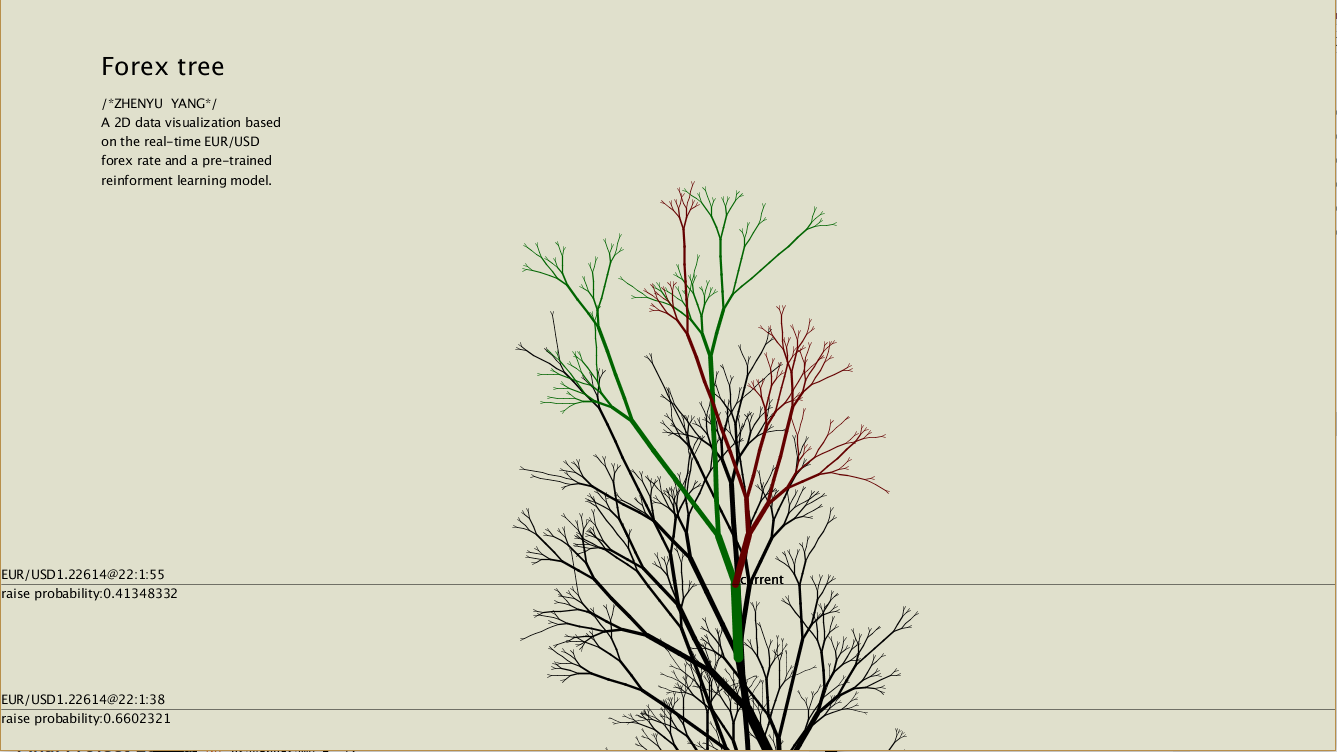
INTERACTION
Key "T": Show/Hide timeline(rate history)
INTERACTION
Key "T": Show/Hide timeline(rate history)
Code
All work is developed within Processing
Source Code + Data
SCREEN RECORD
https://www.youtube.com/watch?v=DBrSXKwYfdc
Source Code + Data
SCREEN RECORD
https://www.youtube.com/watch?v=DBrSXKwYfdc
3D version
A 3D version of this visualization project is also avaliable.
Source Code + Data
SCREEN RECORD
https://www.youtube.com/watch?v=vTJNtgy27B0
Source Code + Data
SCREEN RECORD
https://www.youtube.com/watch?v=vTJNtgy27B0