Movie City
MAT 259, 2016
Yan Kong
Concept
Movie City - 3D data visualization based on genres of movies
My inspiration is from a movie named "Sin City".
Query
I use the dataset from TMDB(website same as IMDB but it provides open API to access to its database), which contains basic information of 4804 movies from 1930s to 2010s. After running a script below to preprocess the raw data and delete unnecessary features, I obtain the organized dataset I'd like to use for my final project. It's pretty clear and straightforward. Every movie contains following features: budget, genres, keywords, popularity, release_date, revenue, runtime, tagline, title and ranking(vote_average).
import json
import pandas as pd
def load_tmdb_movies(path):
    df = pd.read_csv(path)
    # Movie(int budget, String genres, String keywords,
    # float popularity, String releasedDate, int revenue, int runtime, String tagline, String title, float score
    json_columns = ['genres', 'keywords']
    for column in json_columns:
        temp = []
        # print('df[column ]', len(df[column]))
        for line in df[column]:
            s = ''
            datas = json.loads(line)
            i = 0
            for data in datas:
                i = i + 1
                if(s == ''):
                    s = data['name']
                else:
                    s = s + ',' + data['name']
            temp.append(s)
            # print(s)
        print(len(temp))
        df[column] = pd.Series(temp, index = df.index)

    df.to_csv('test.csv', encoding='utf-8')
    return df
movies = load_tmdb_movies("tmdb_movies.csv")
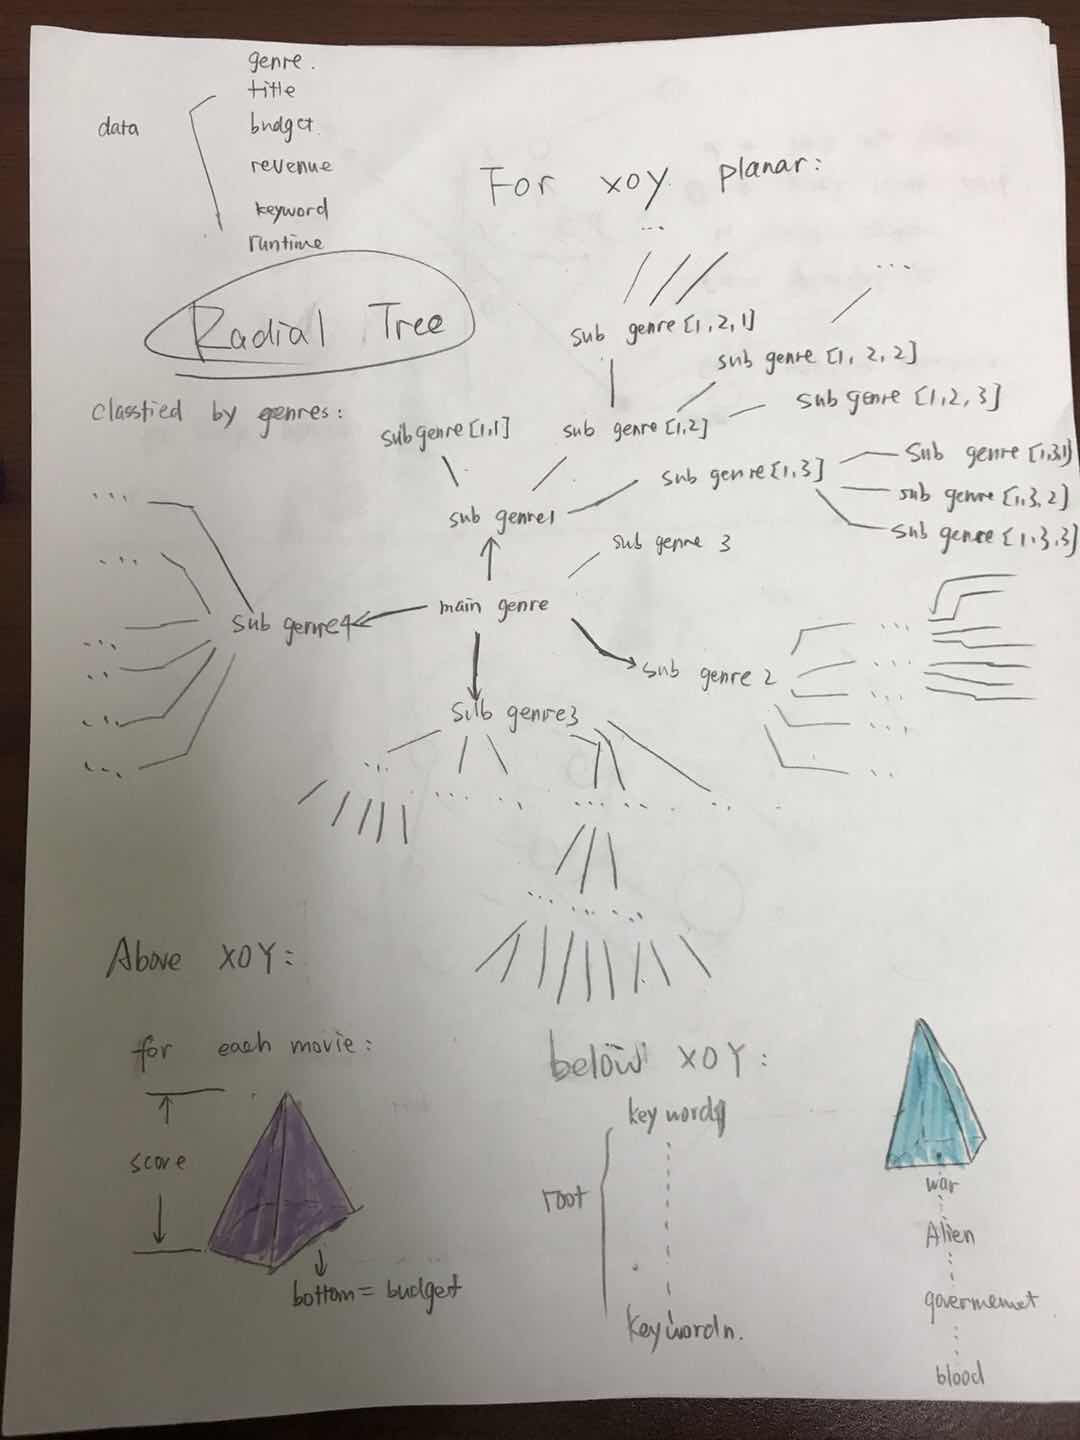
Preliminary sketches
While processing nested json files within "genre" column, I find out that almost 90% movies are cross-genre. I think it will be so much fun to visualize data based on such a complicated, nested and elegant feature. According to my statistical results, there are 19 single genres in total: "Foreign", "Documentary", "Western", "Mystery", "Family", "Animation", "Crime", "Comedy", "Action", "Adventure", "Drama", "Science Fiction", "Romance", "Horror", "Thriller", "Fantasy", "Music", "War", "History". For every movie, it has one main genre and zero or several subgenres. The best way to visualize the nested data is using the tree. A tree has 19 tree branches and every branch grow its own sub branches as sub genres.
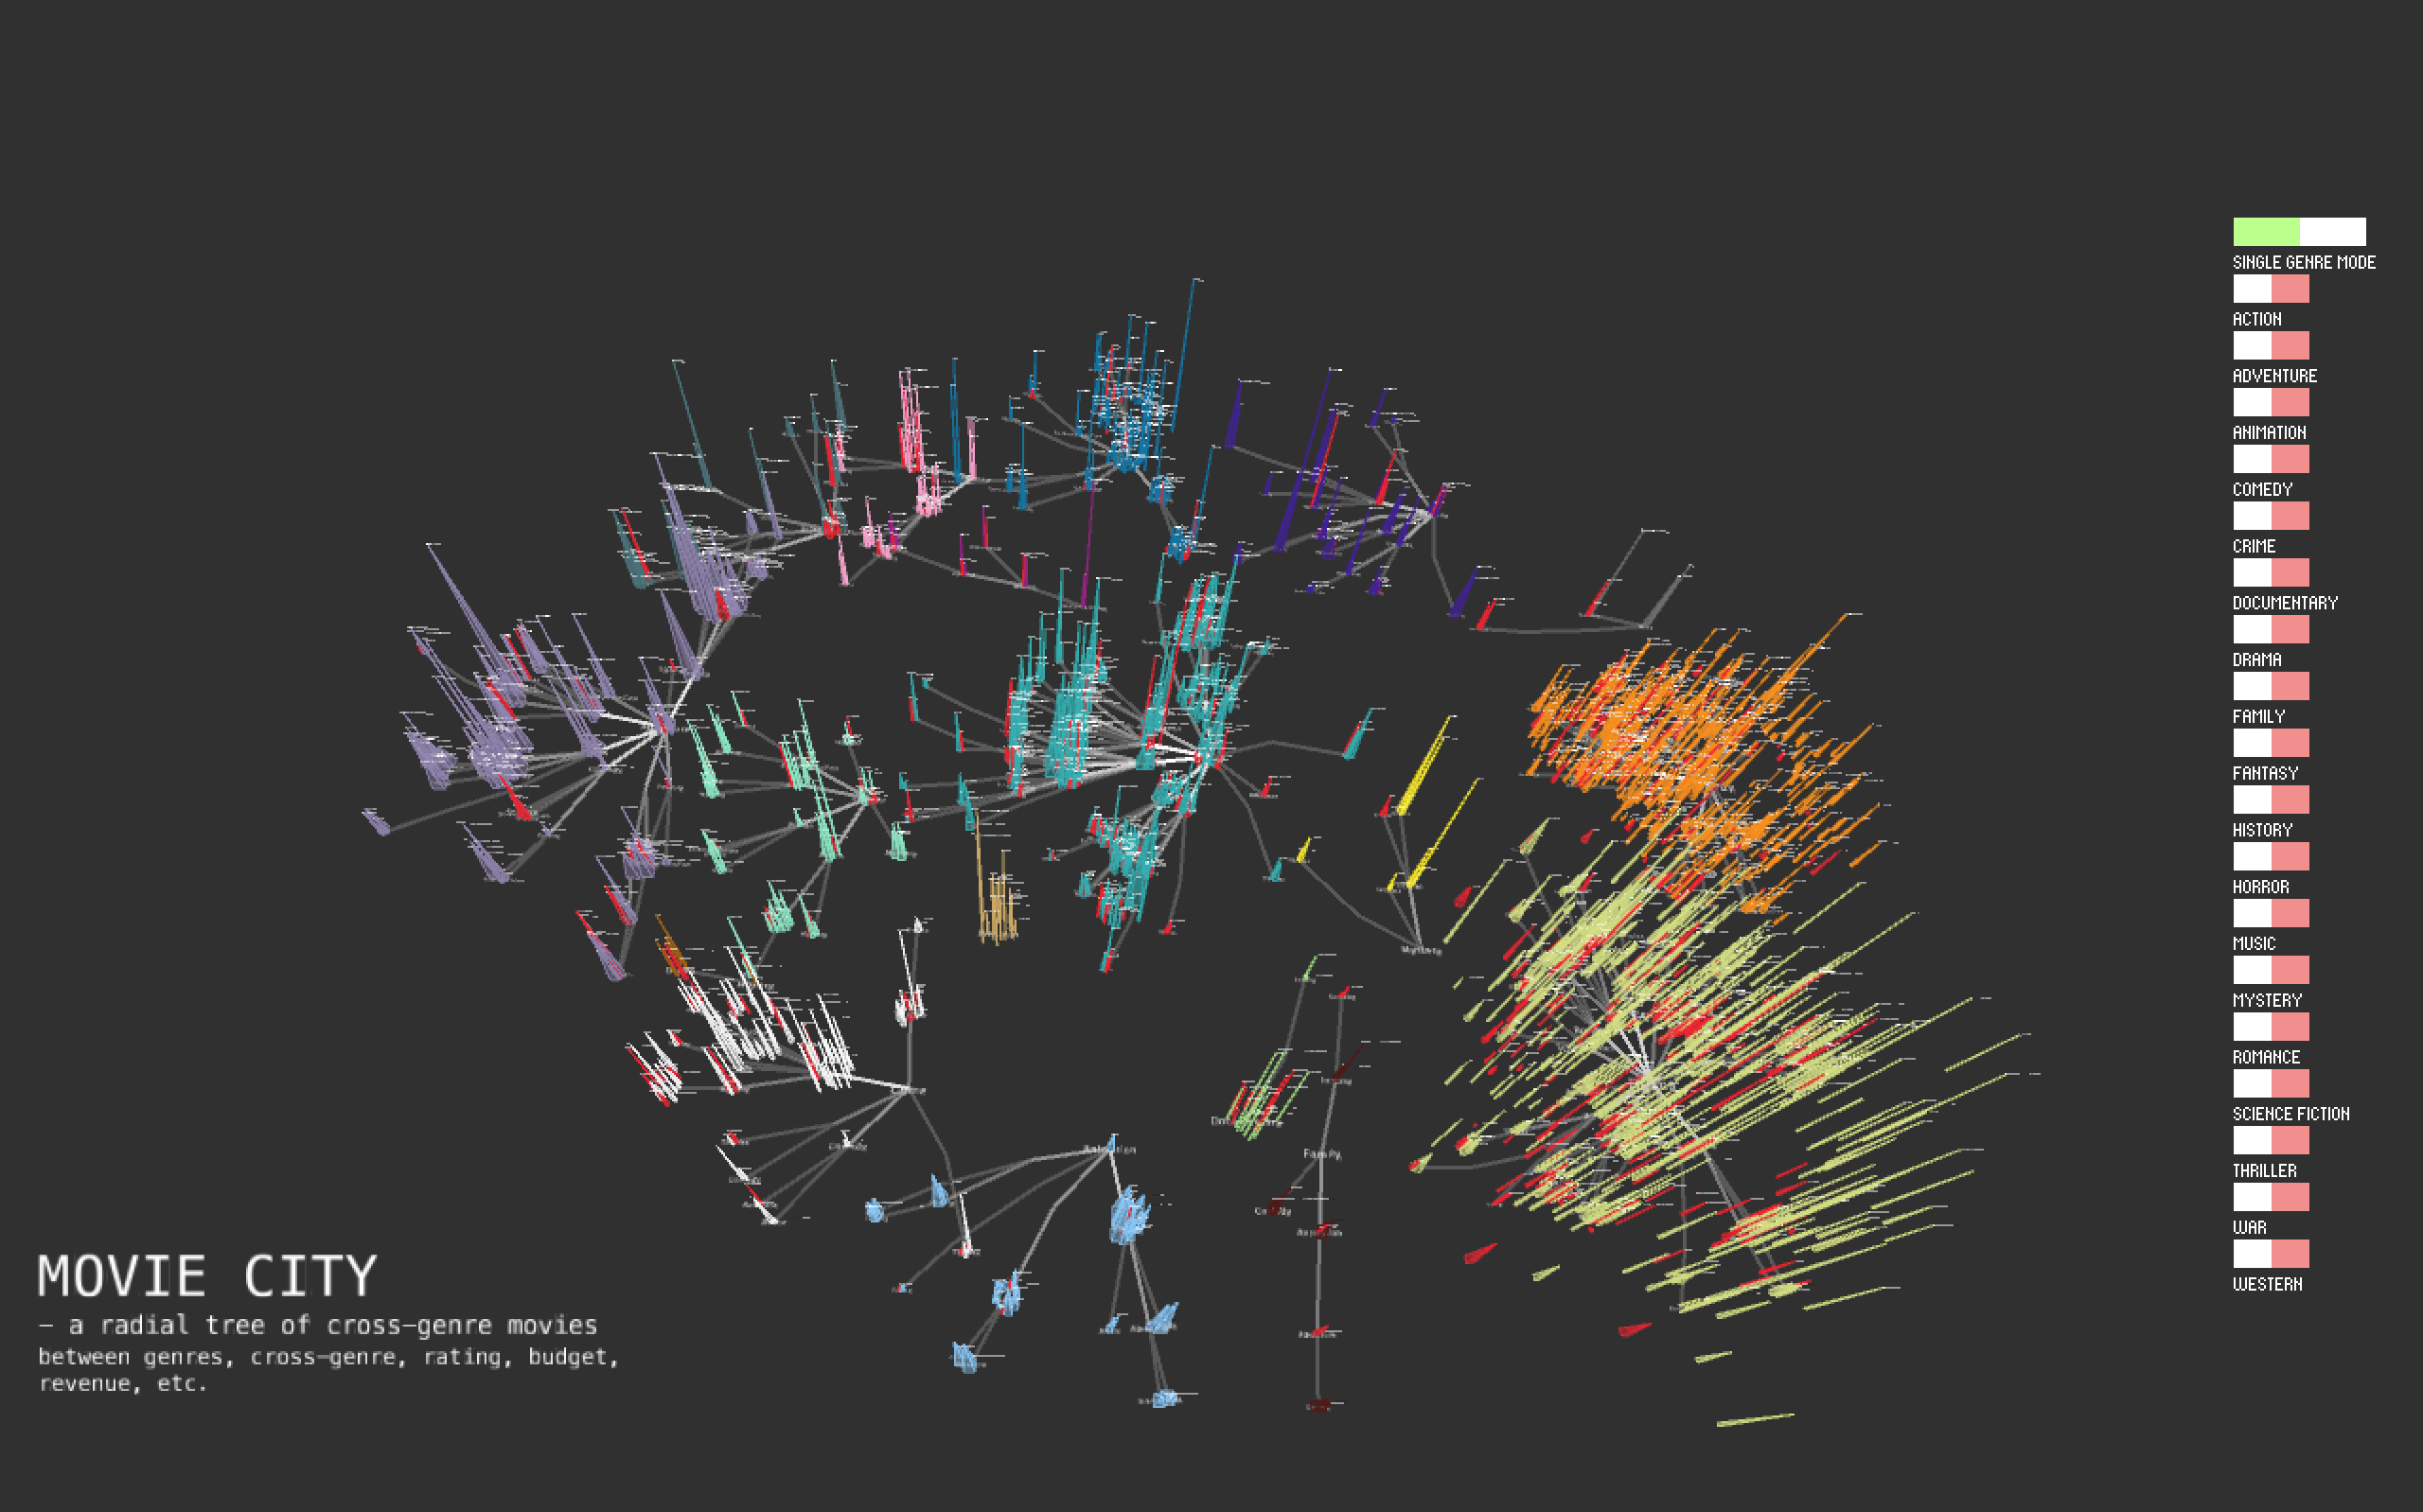
A radial tree takes up the least area and conveys the most impactful visualization.
Process
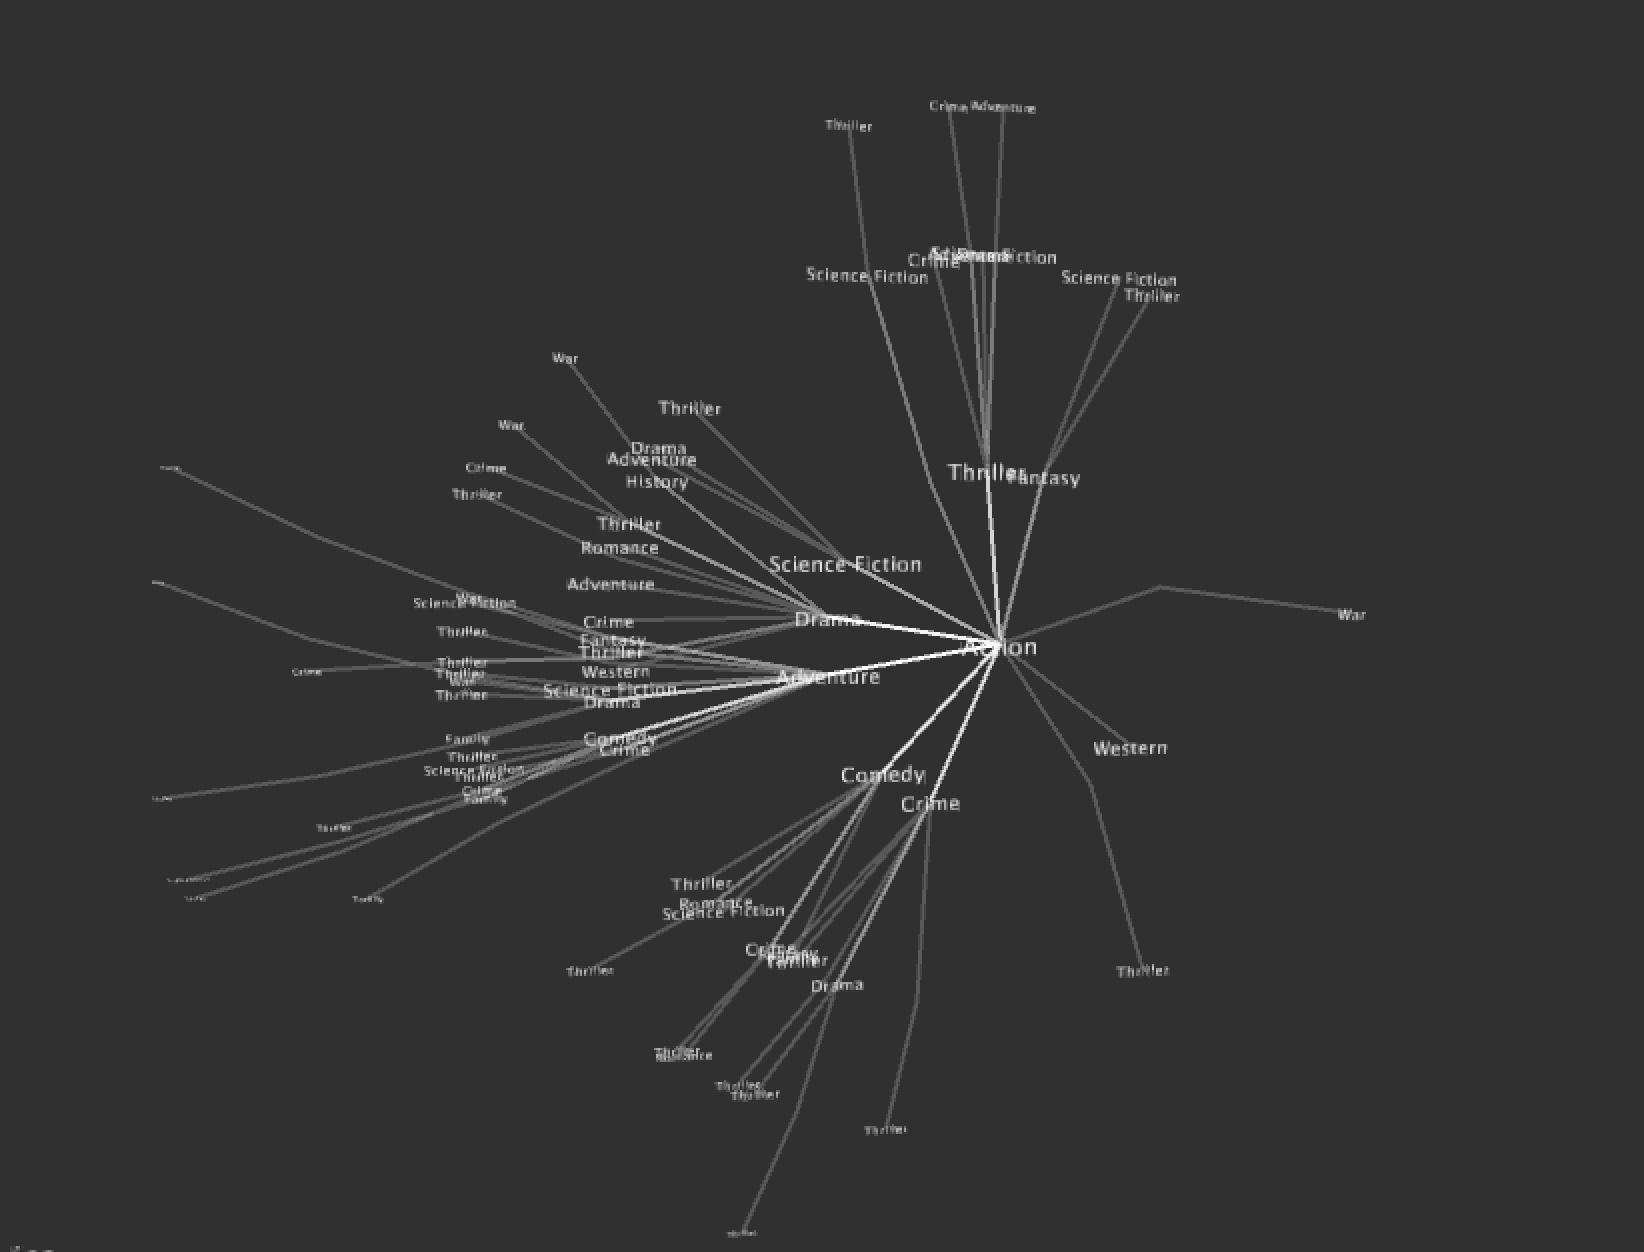
When I visualize the radial tree with 19 branchs and 6 layers, the space is too small for the next 3D visualization:

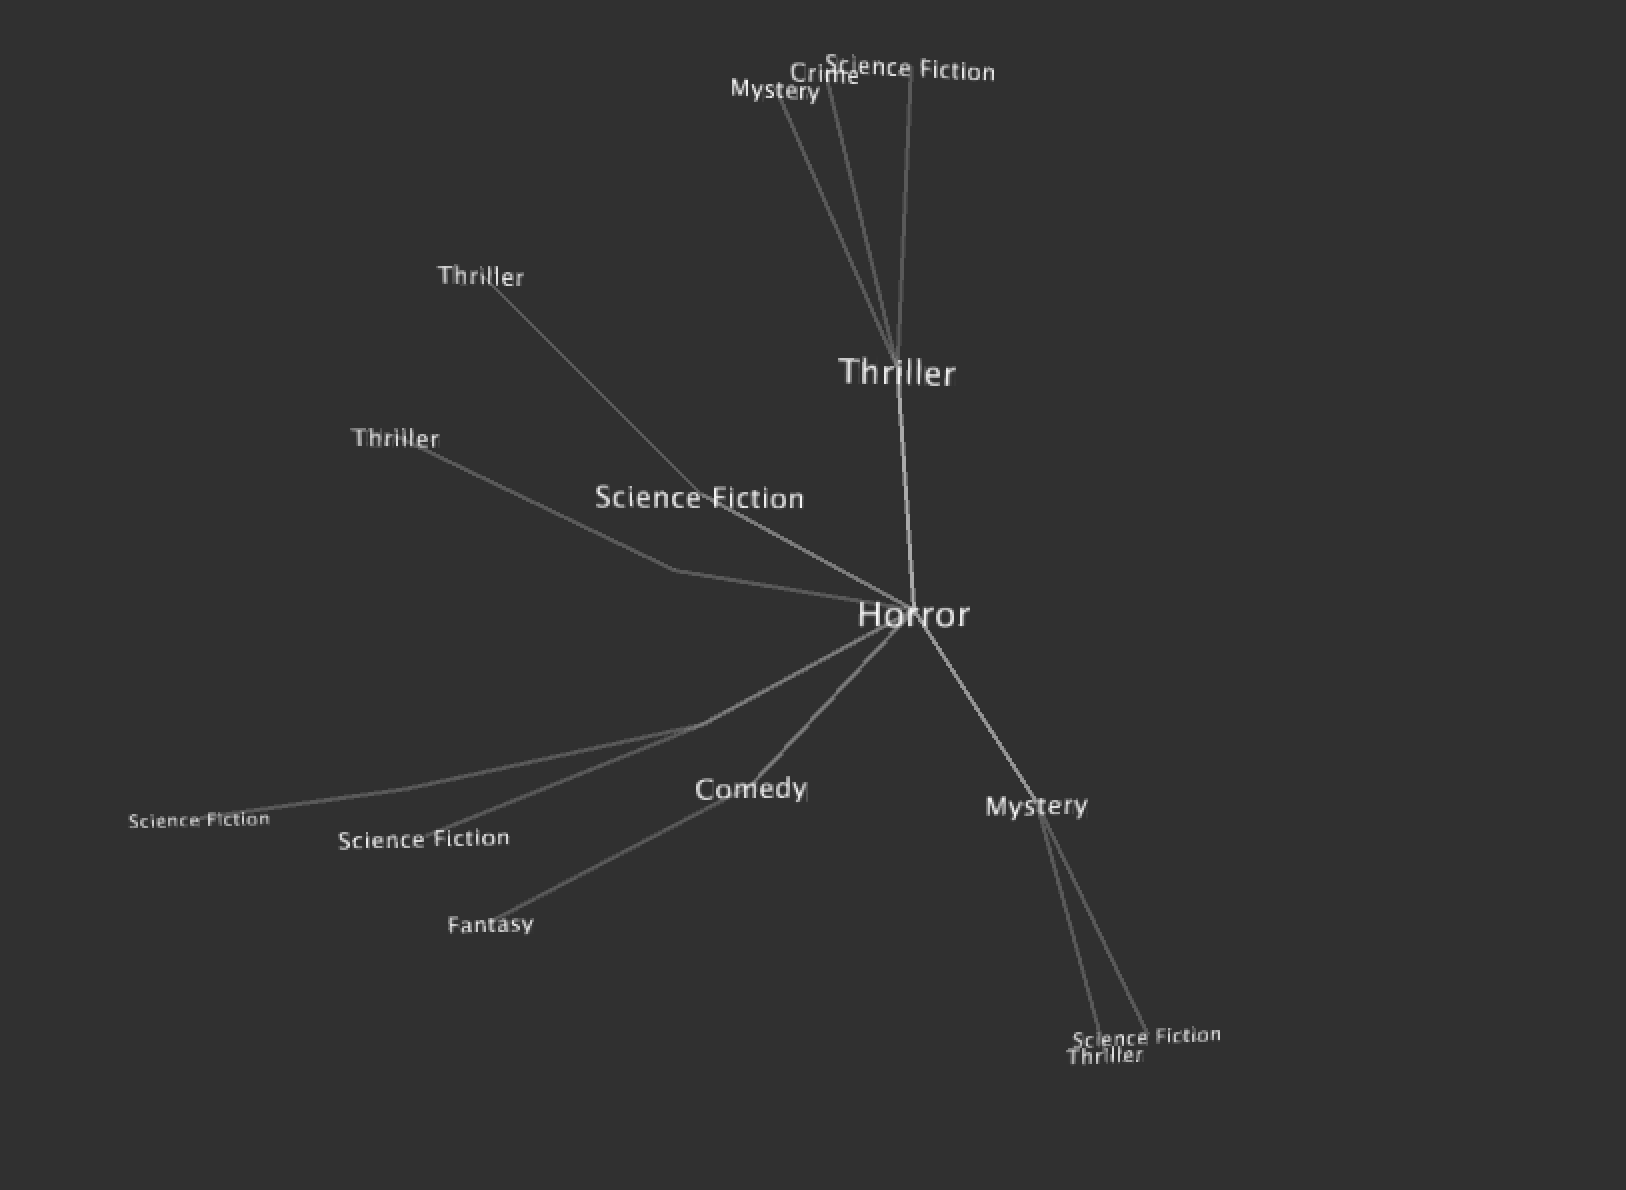
So I decide to generate separate trees for each genre. It's easy to see the distribution for main genre and subgenres.
Final result
Every pyramid represents a movie, lying at its genre path. The white label shows its title. The height of pyramid is its ranking and the size of bottom shows its budget. Also Pyramids in red indicate that this movie doesn't make any profit, but lose money instead.
The texts below is its tagline and keywords. Those words with high frequency have larger text size. We can even tell the main theme for this genre.

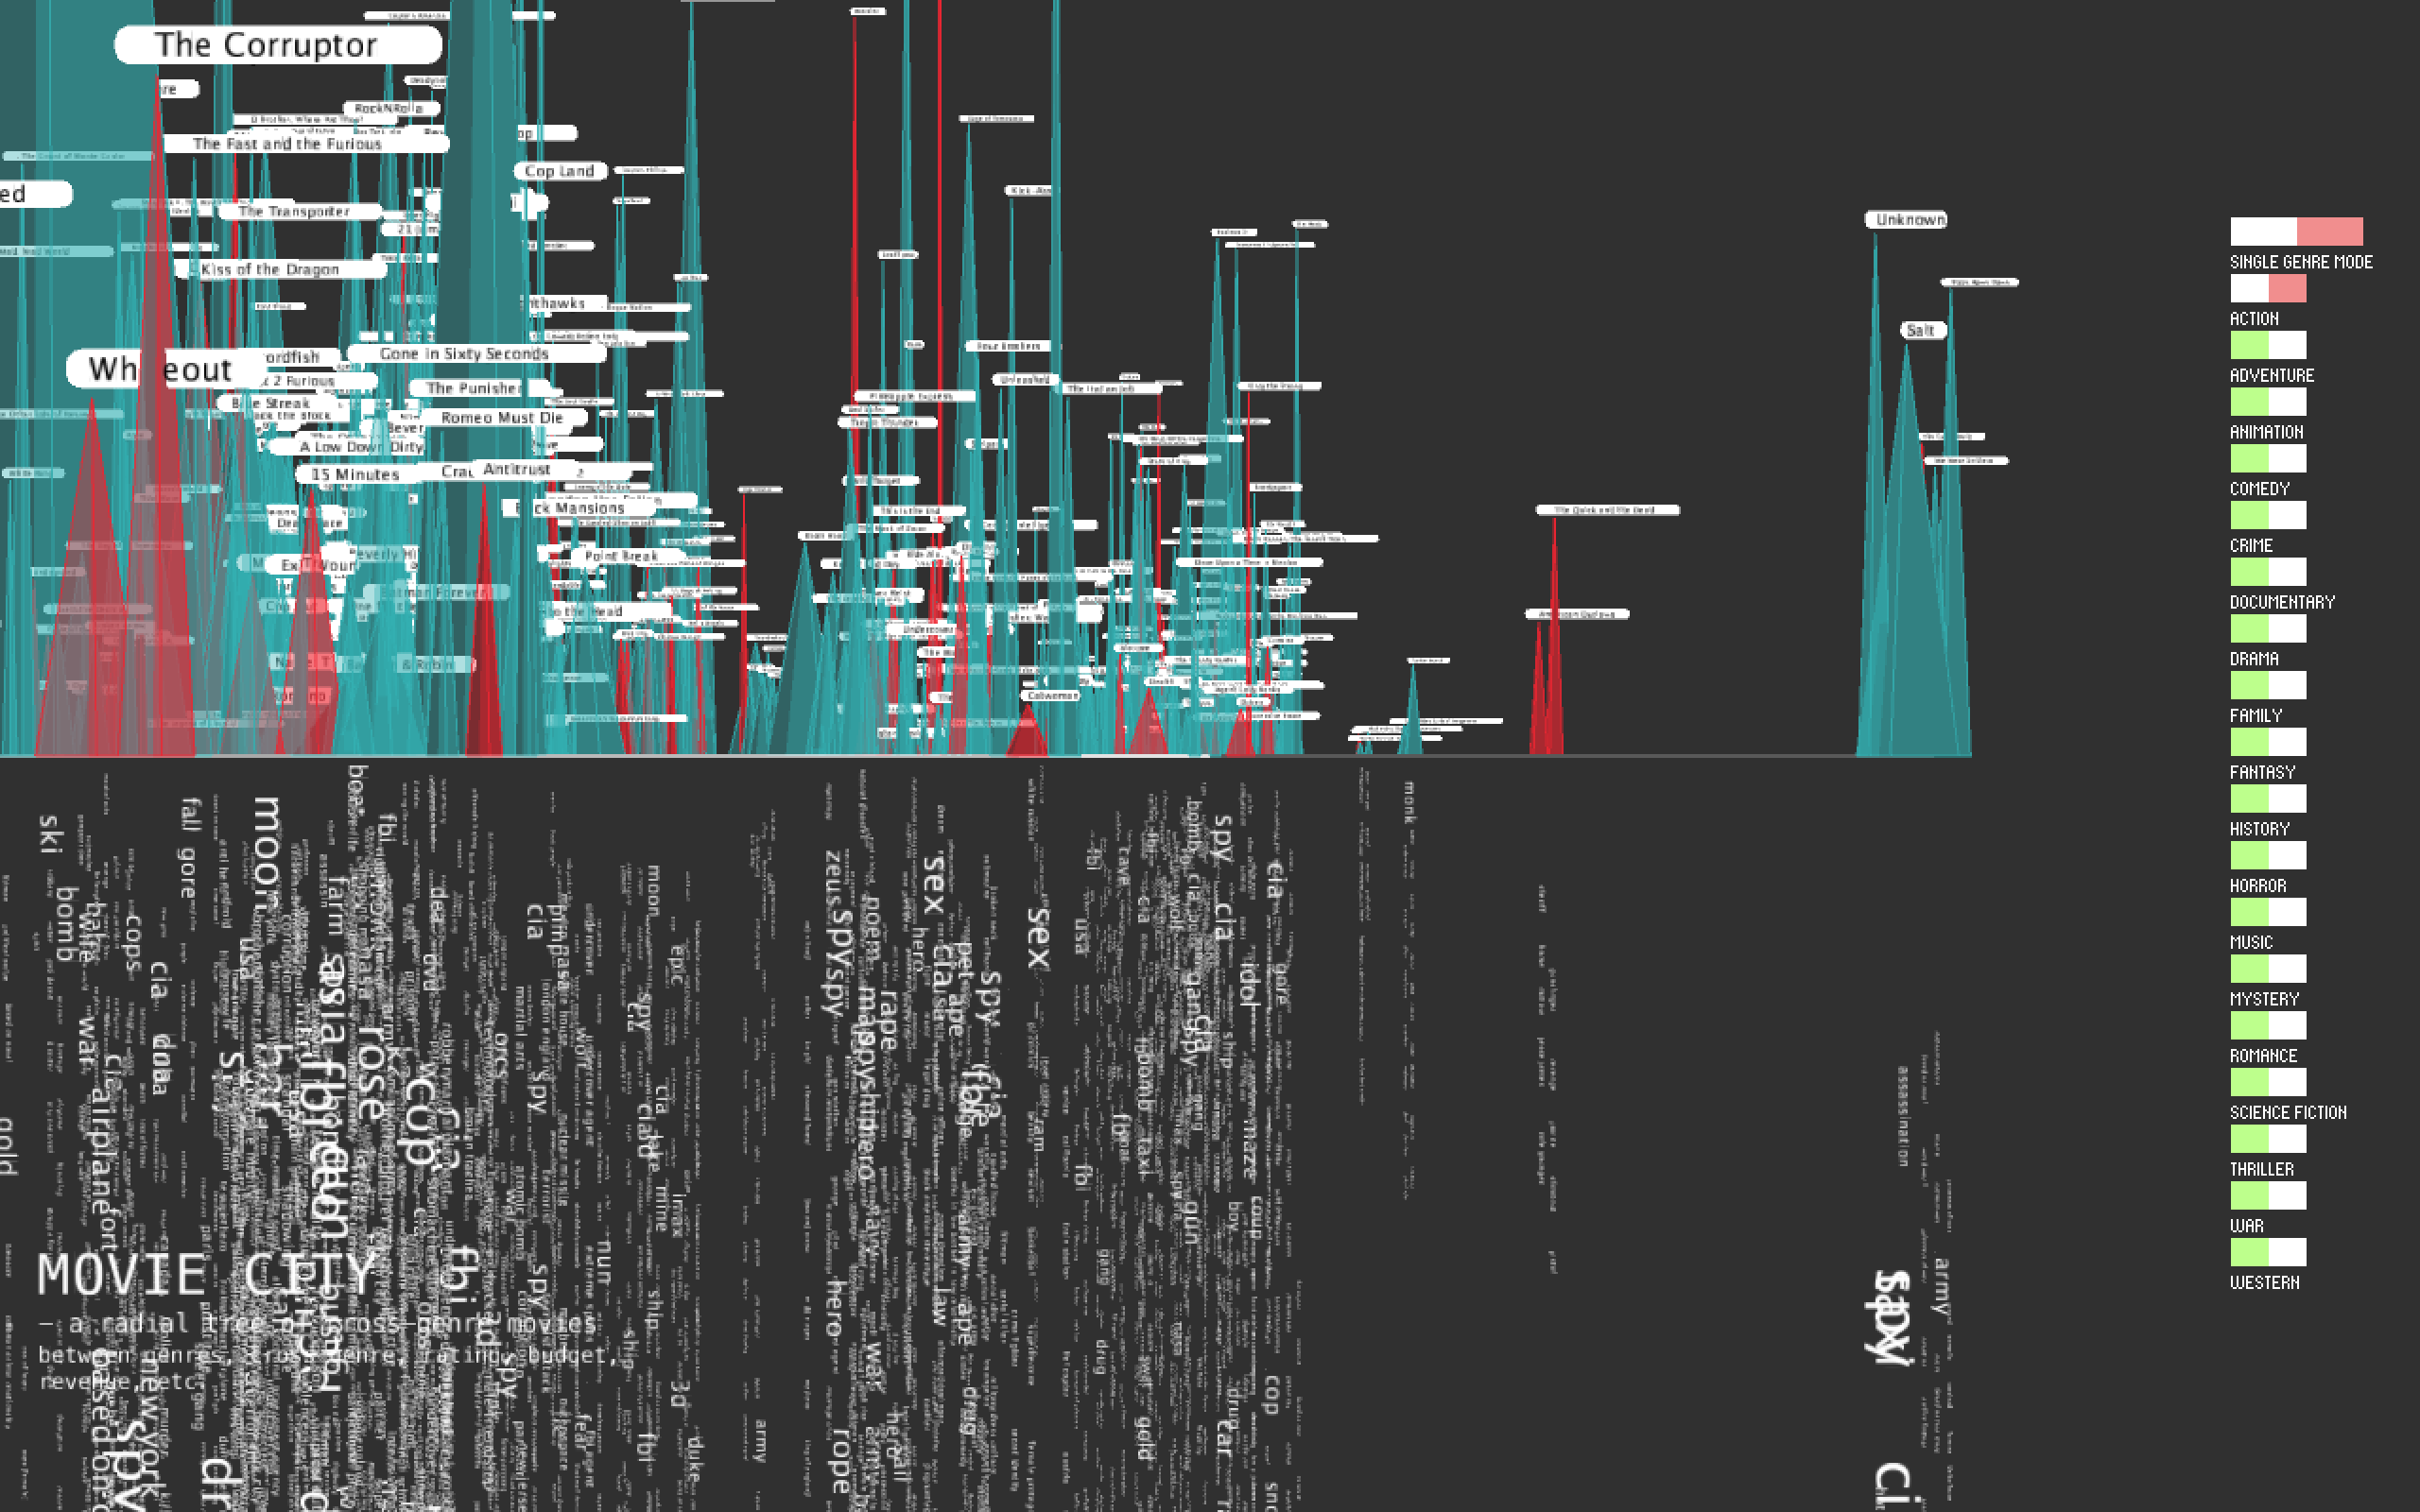
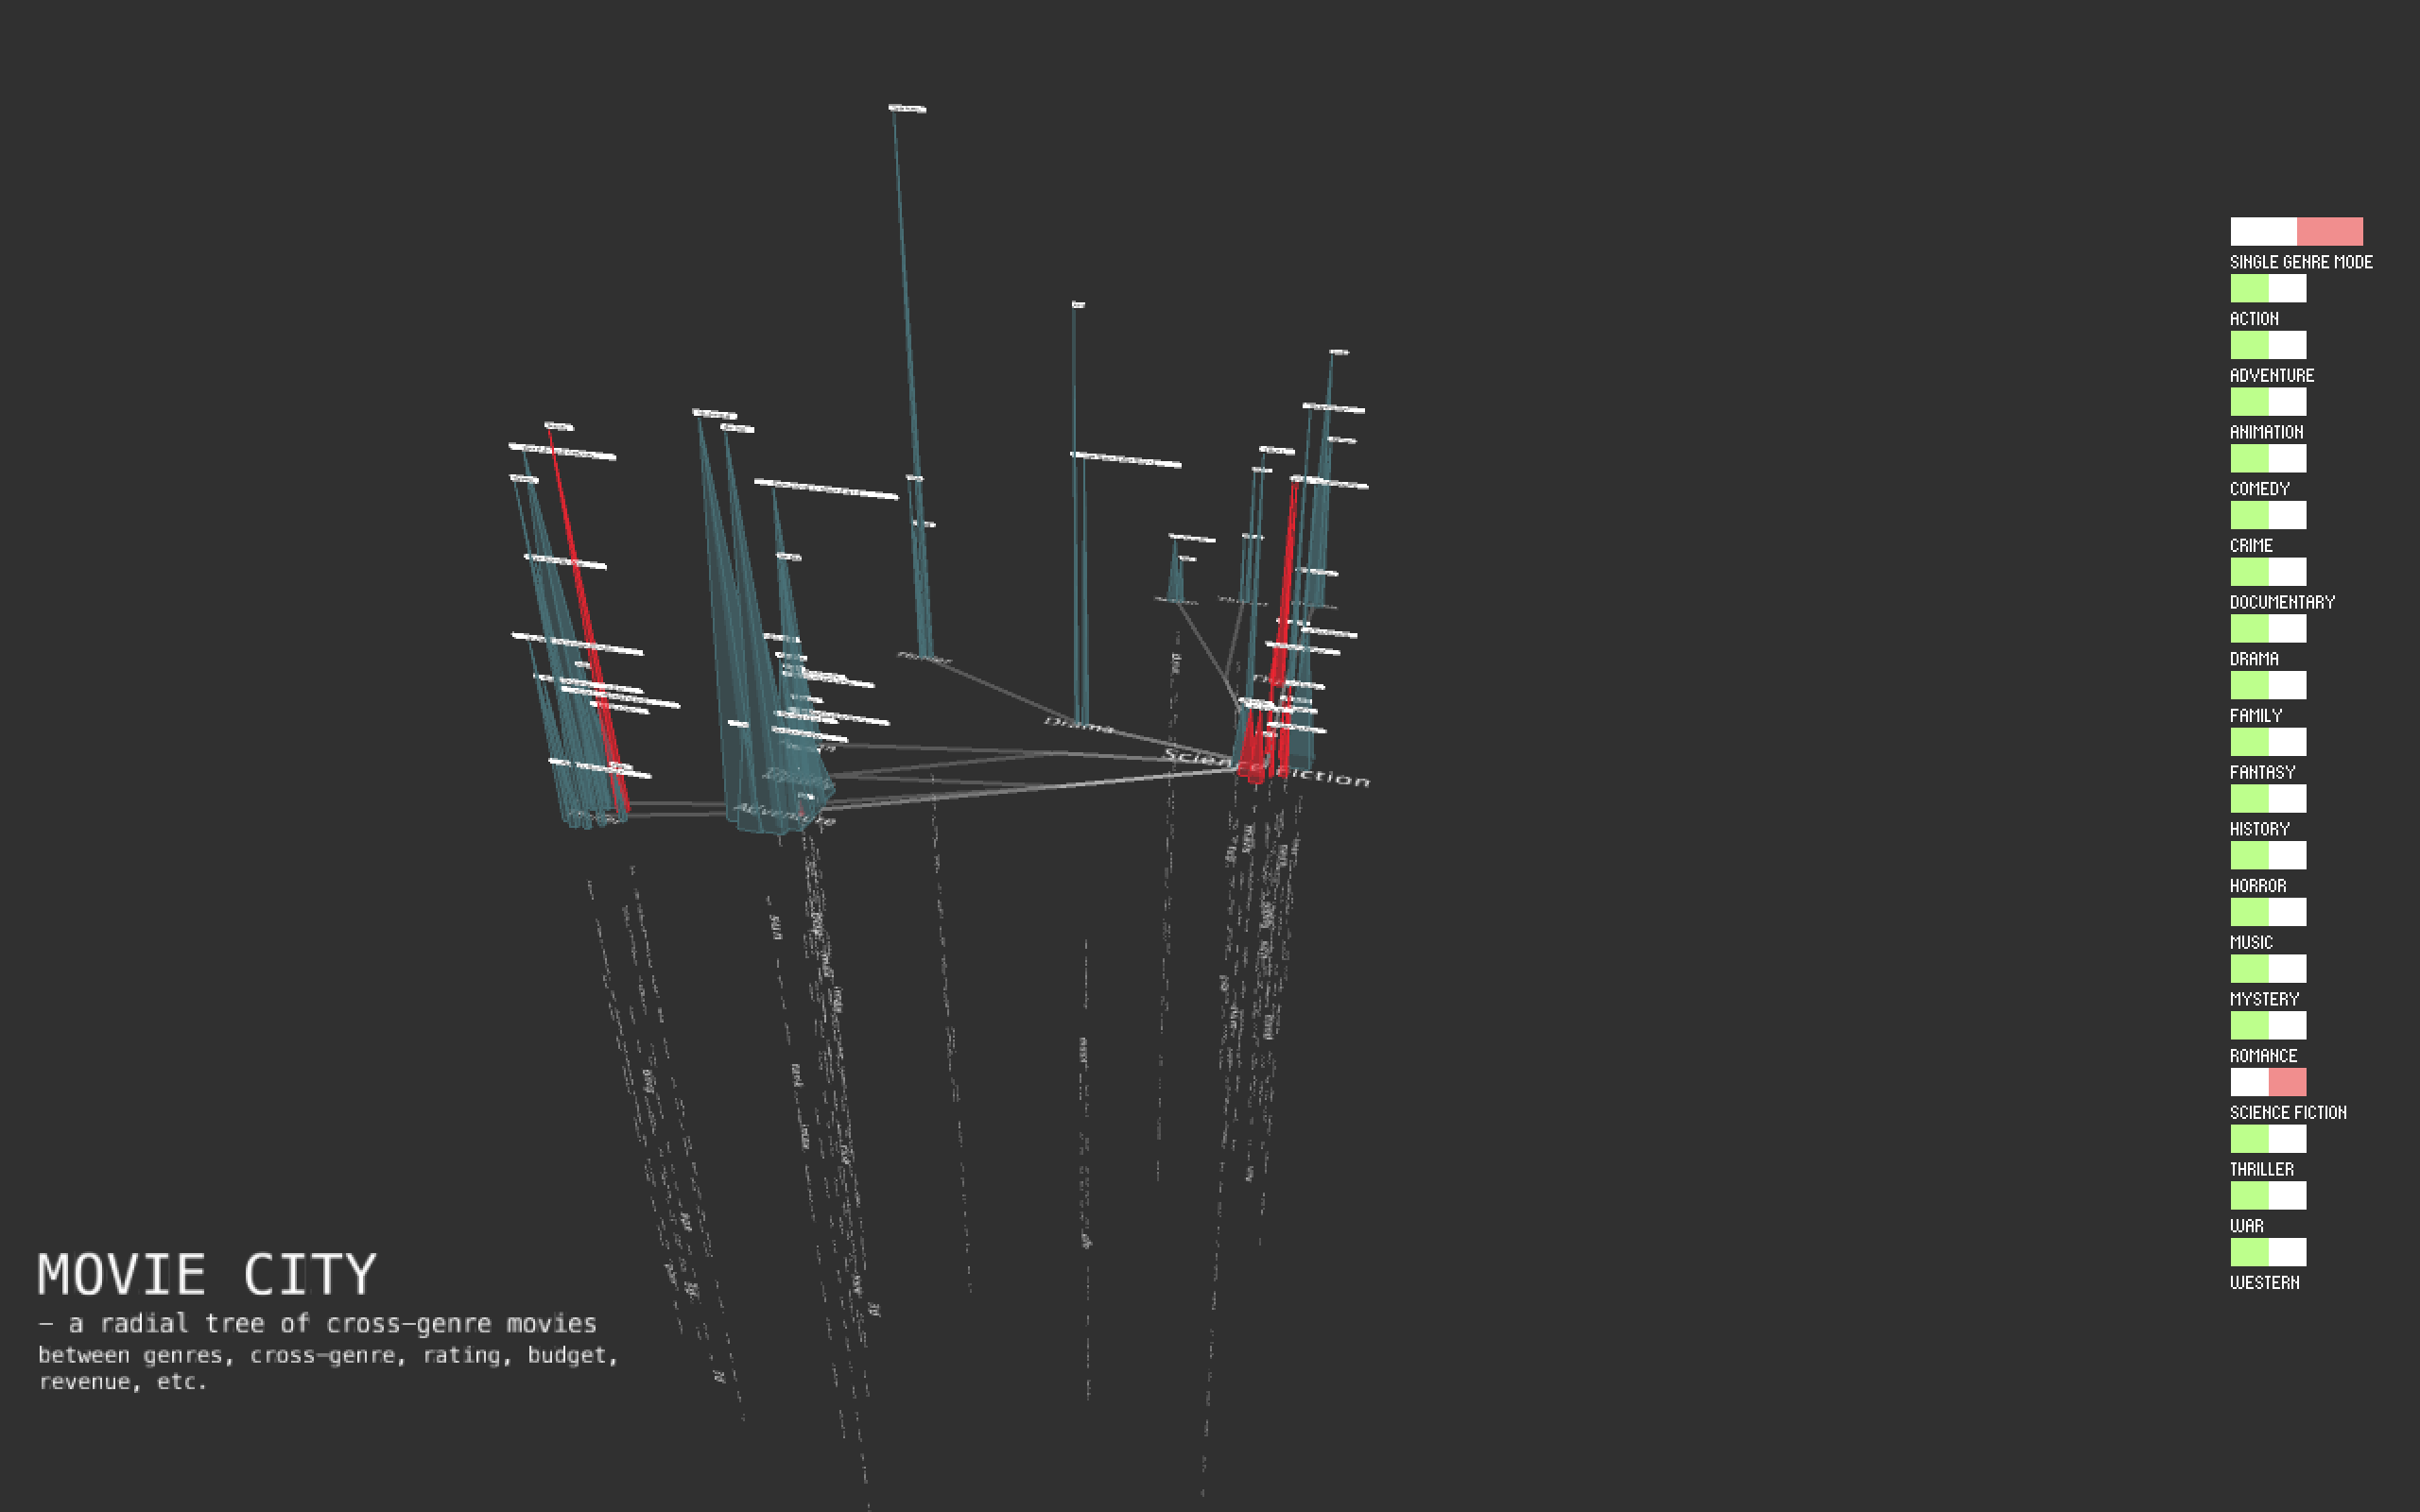
I also add UI -toggle button group. It has two modes: single-genre mode and multiple-genres mode. Under single-genre mode, it only allows to show one genre tree at one time. Under multiple-genres mode, genre trees can be shown altogether.
Here are two GIFs to show a better overview and design of two modes.
Code