BeHAVE: Heatmap-based Multimodal Representation of Personal Behavioral Data
MAT 259, 2018
Sihwa Park
Concept
This final project is the extension of my ongoing research, BeHAVE (Behavioral data as Heatmap-based Audio-Visual Expression), a web-based multimodal data representation that visualizes and sonifies my phone use behavior about where and how long I use my phone. Through this multimodal representation, this project attempts to not only improve the perception and understanding of self-tracking data but also arouse aesthetic enjoyment.
Process
Data Collection and Preprocessing
For obtaining phone use data, an active screen time tracking iPhone application ‘Moment (https://inthemoment.io)’ has been used since January 20, 2017. Basically, this app detects a phone pickup which means when and where a user turns on or off his/her phone screen and calculates the duration between them. The app exports all pickup data as a JSON format file that includes a daily using time in minutes, the number of pickups, a location, date, and duration in seconds of each pickup, and most used apps based on apps’ battery usage. The exported file size of a year of data was about 5.6 Mb including the records of total 11,367 pickups. By using Python in the Jupyter Notebook (https://jupyter.org/), this raw data was parsed and processed to change it into a GeoJSON format, which is a geographic data structure and is used in a map-based visualization. The minimum, maximum, mean, and standard deviation value of the phone use duration are 0.017, 283.667, 6.243, and 14.465 minutes, respectively.
Visualization
A conventional way in visualizing geographic data is to plot data on an interactive or static map. A geographic heatmap is a particular way to identify where data occurs and depict the density of data in areas or at points. In this regard, a heatmap visualization is an appropriate way to represent the behavioral data of the phone use including location and time information. Due to the fact that the data is also temporal records, a feature for exploring and unfolding data over time is the key point to not only show a context and story of data but also evoke more aesthetic enjoyment in both visualization and sonification.
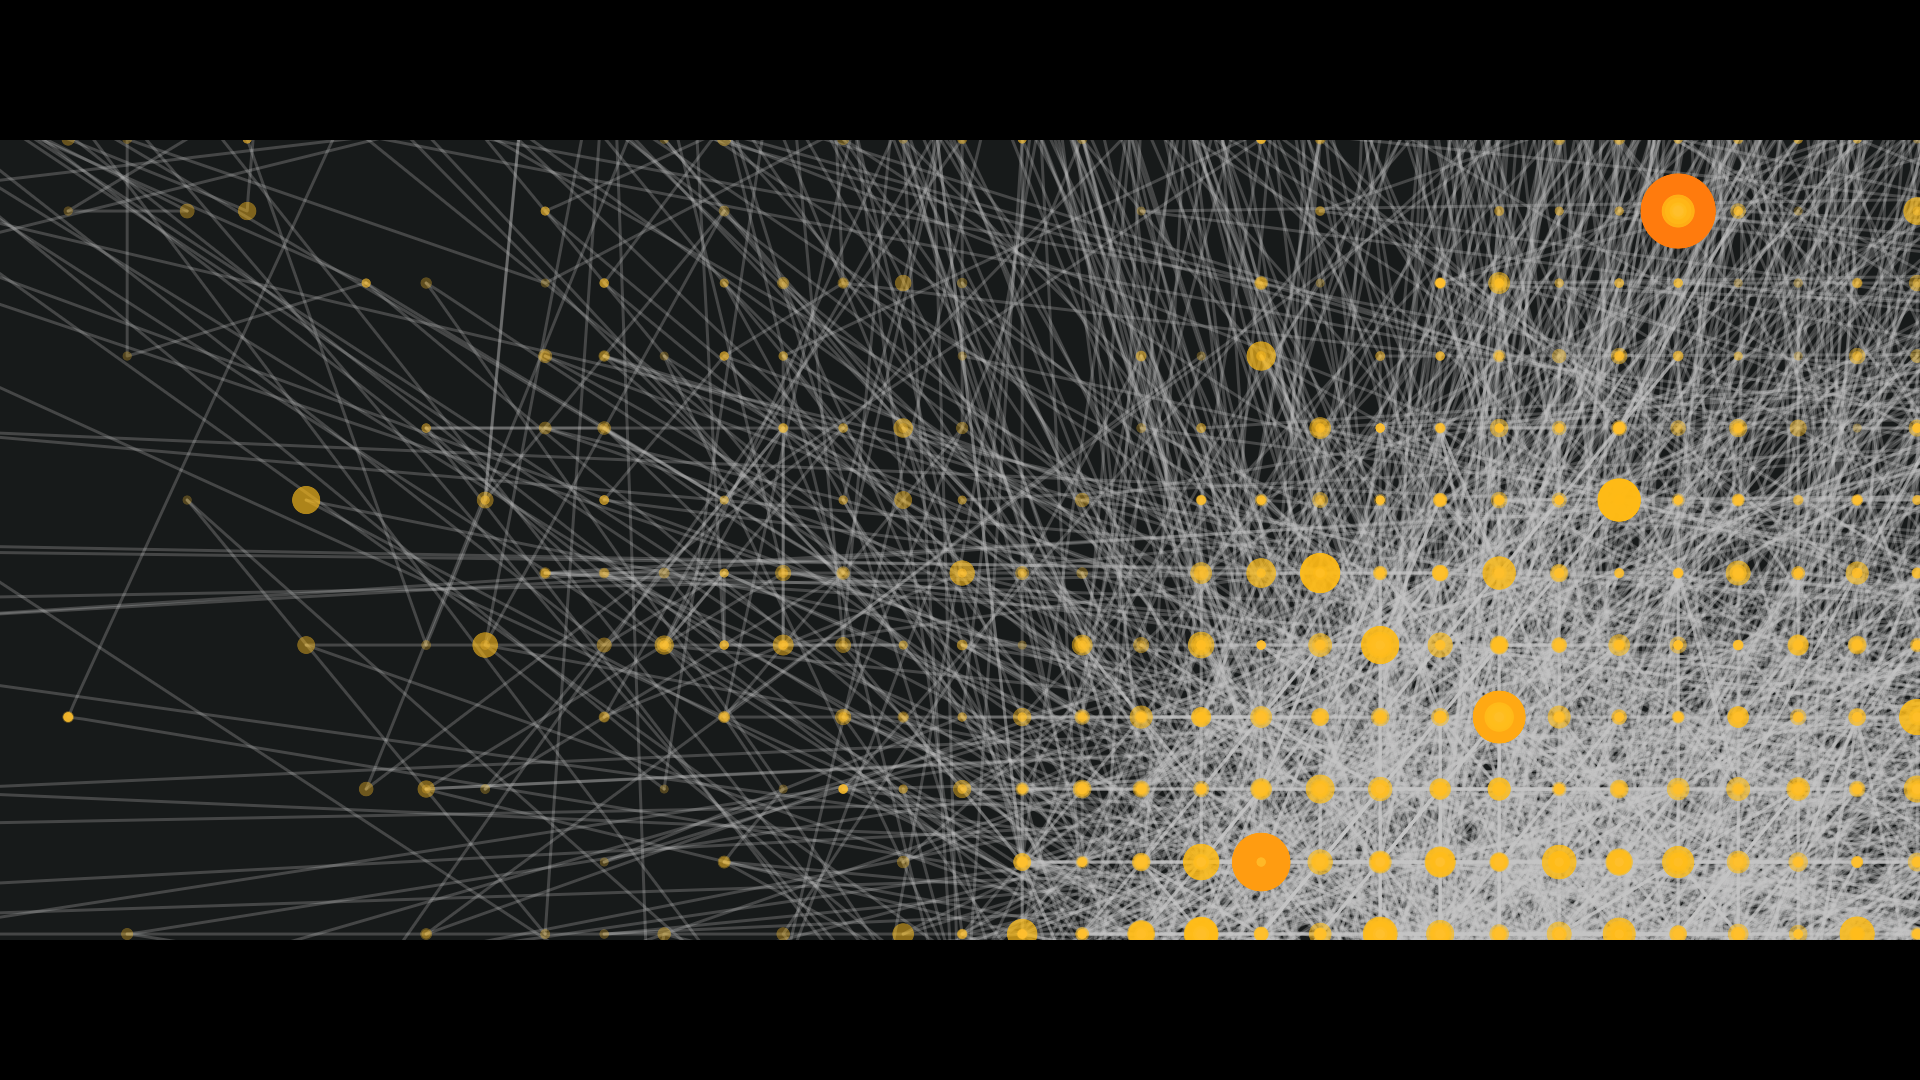
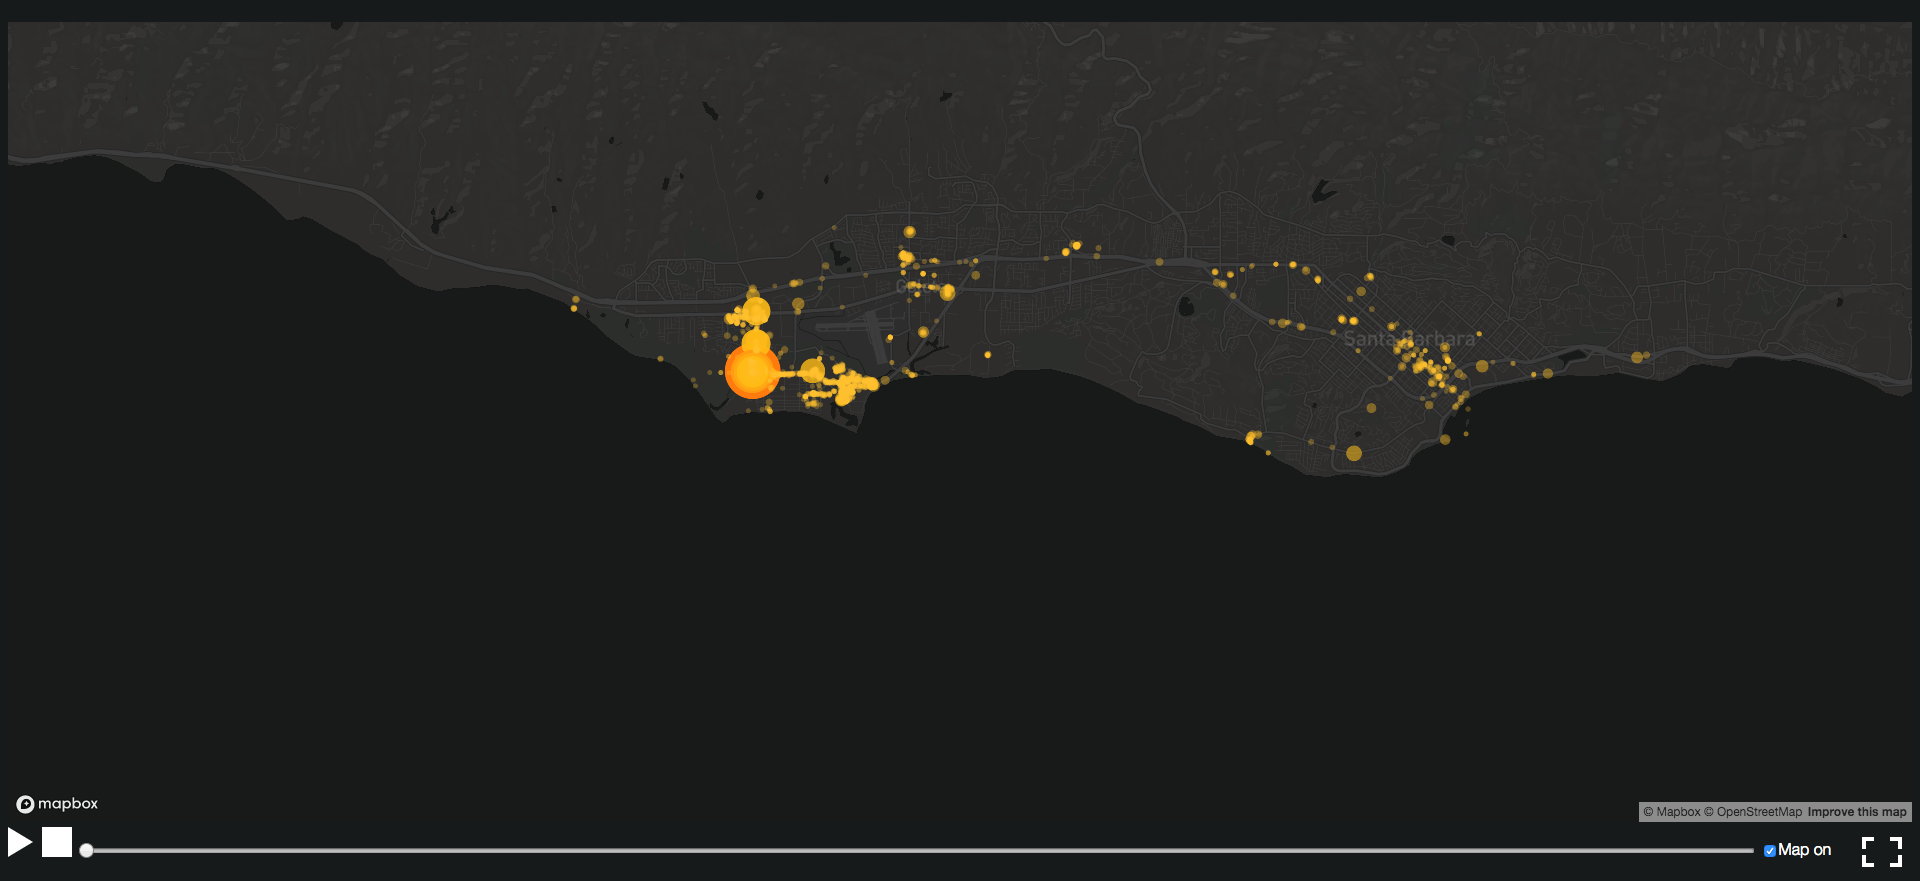 The screenshot of an initial interface
Heatmap Visualization with MapBox
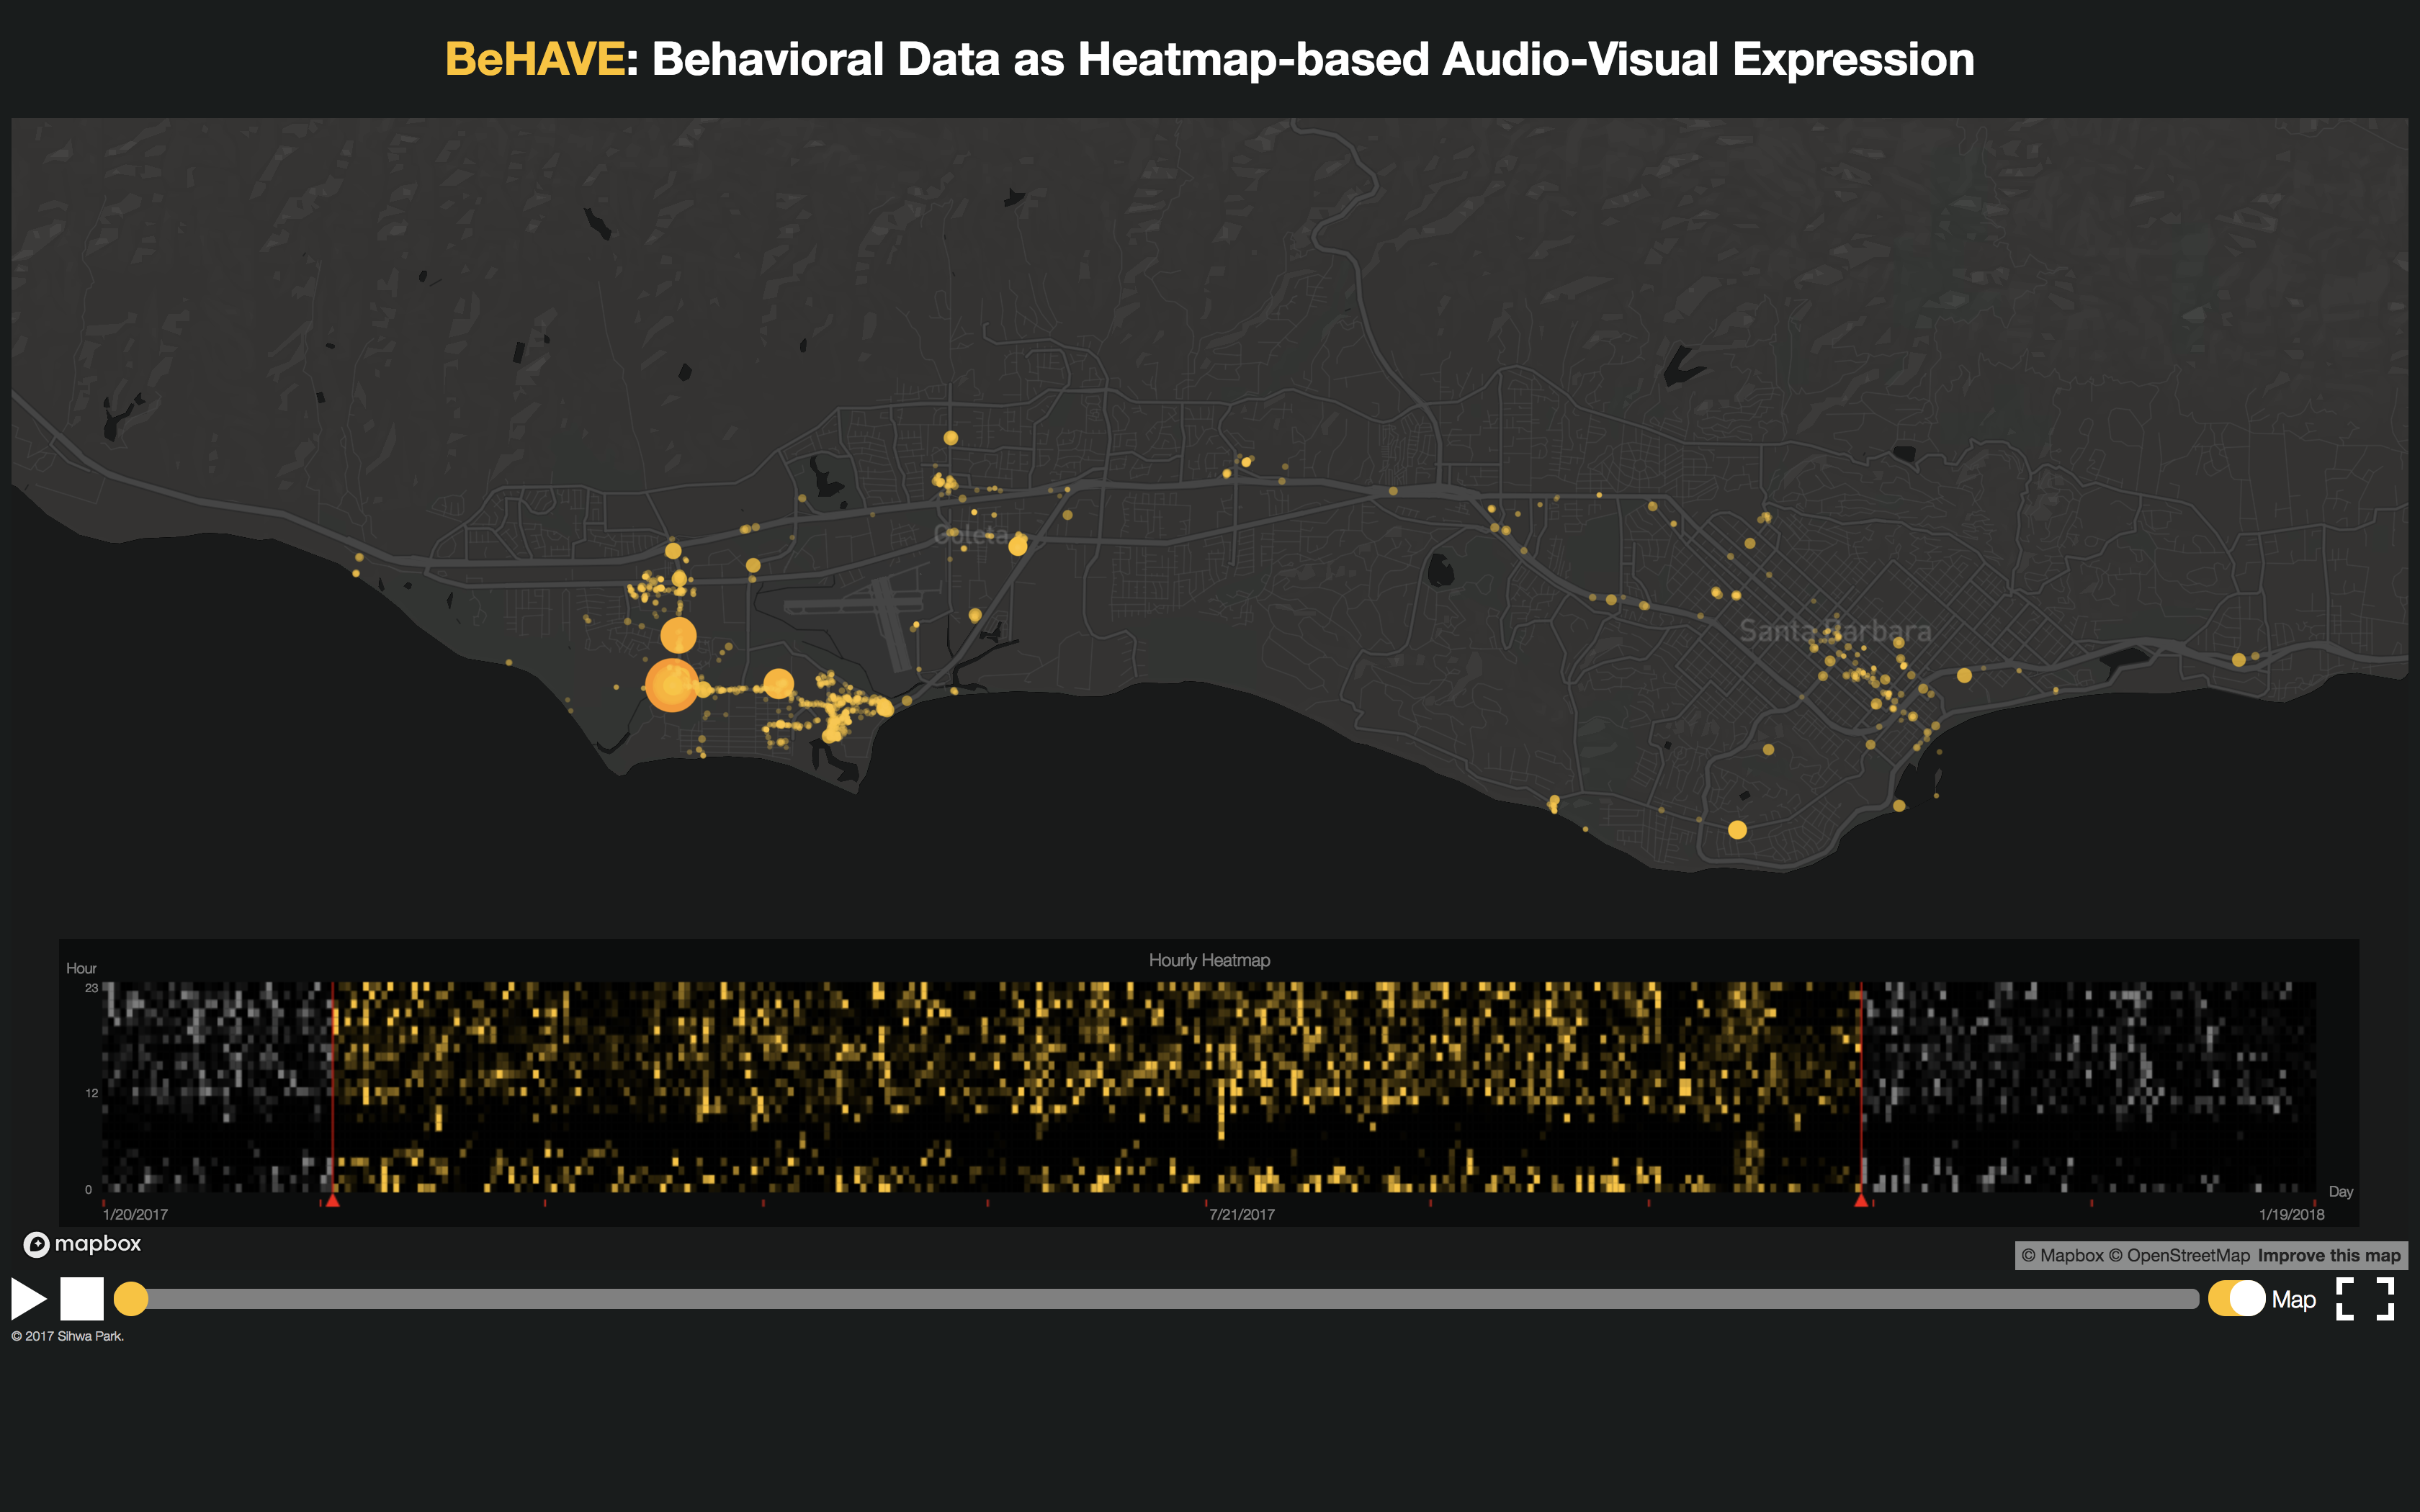
To plot GeoJSON data on an online map, MapBox GS JS (https://www.mapbox.com/mapbox-gl-js), which is a WebGL based JavaScript library for rendering interactive maps, is used. The coordinates information of GeoJSON data determines locations of circles on a map and the use duration of each pickup is mapped onto the radius and color of each circle. According to a zoom level, it reveals detailed data points or makes clusters of closest circles. Also, an hourly heatmap at the bottom of a map that shows how long I used my phone hourly is used to select a date range of data to be plotted.
Temporal Data Exploration
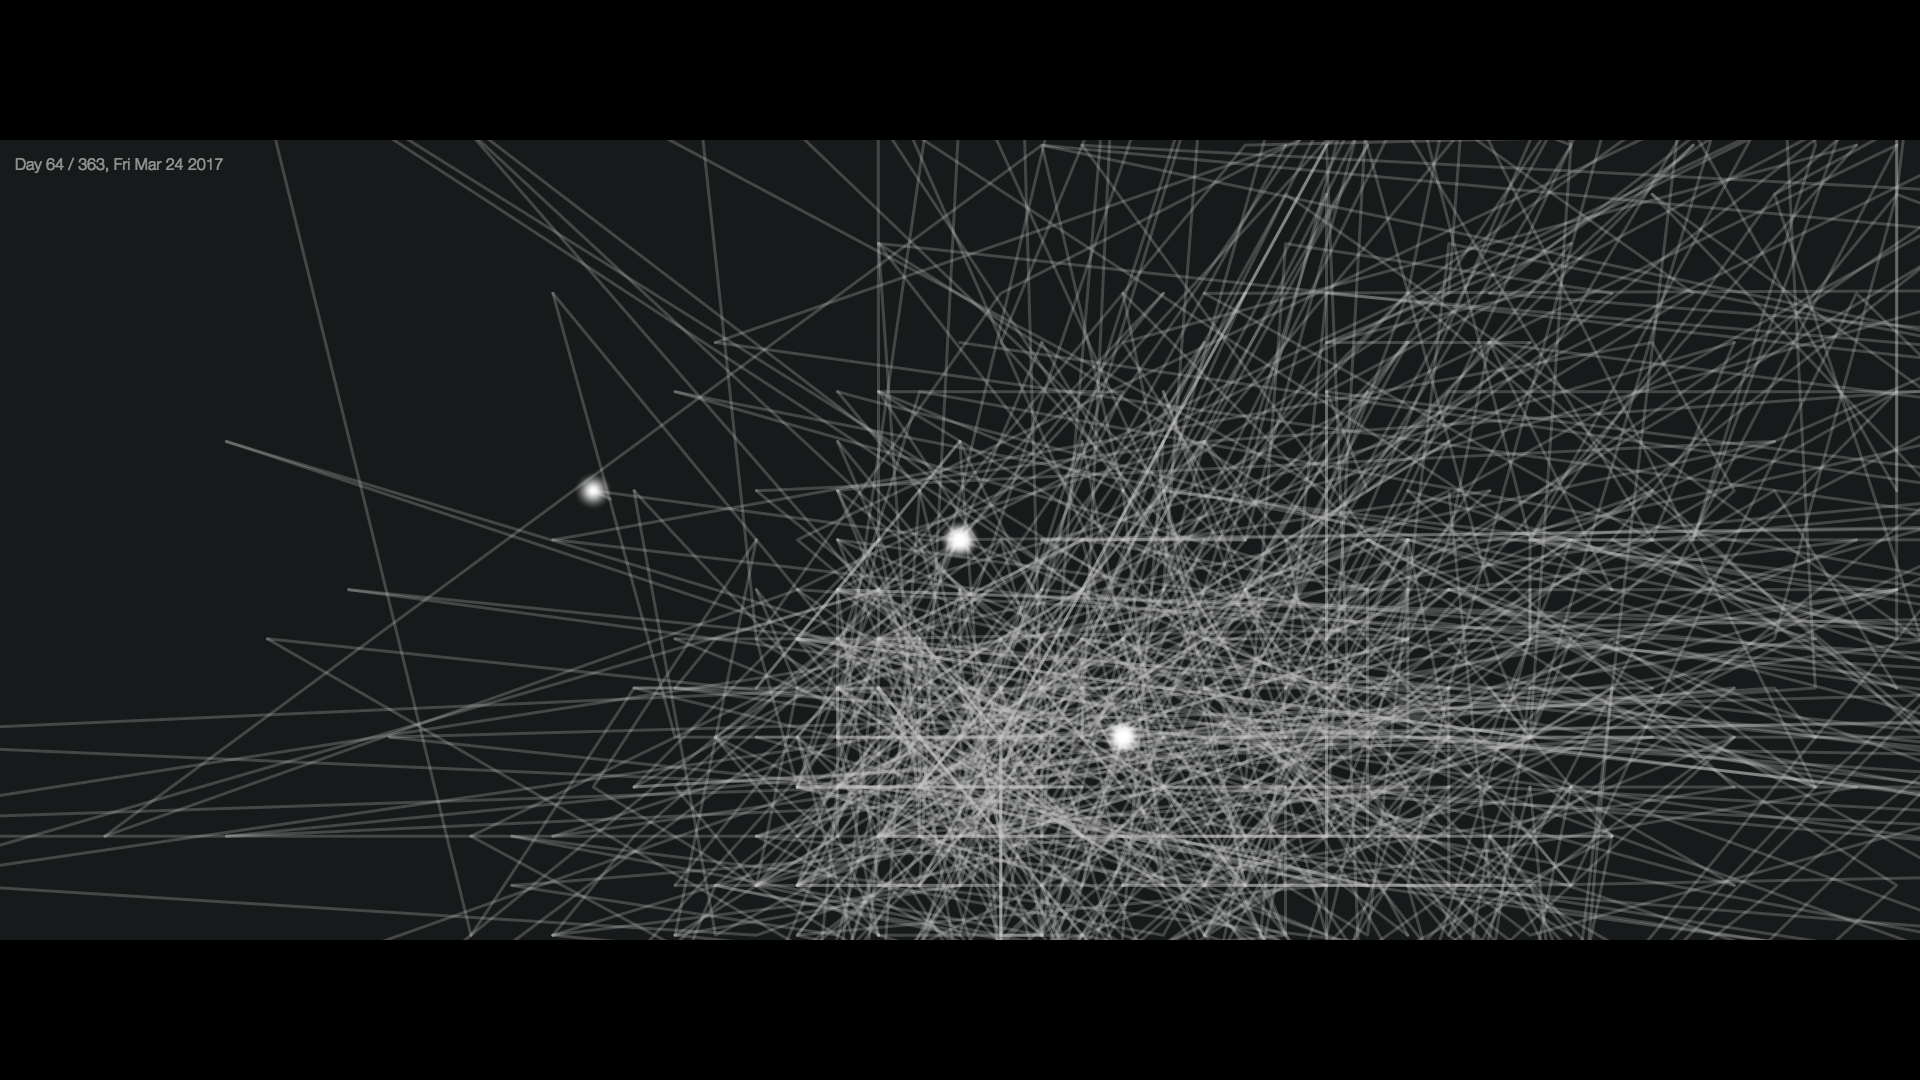
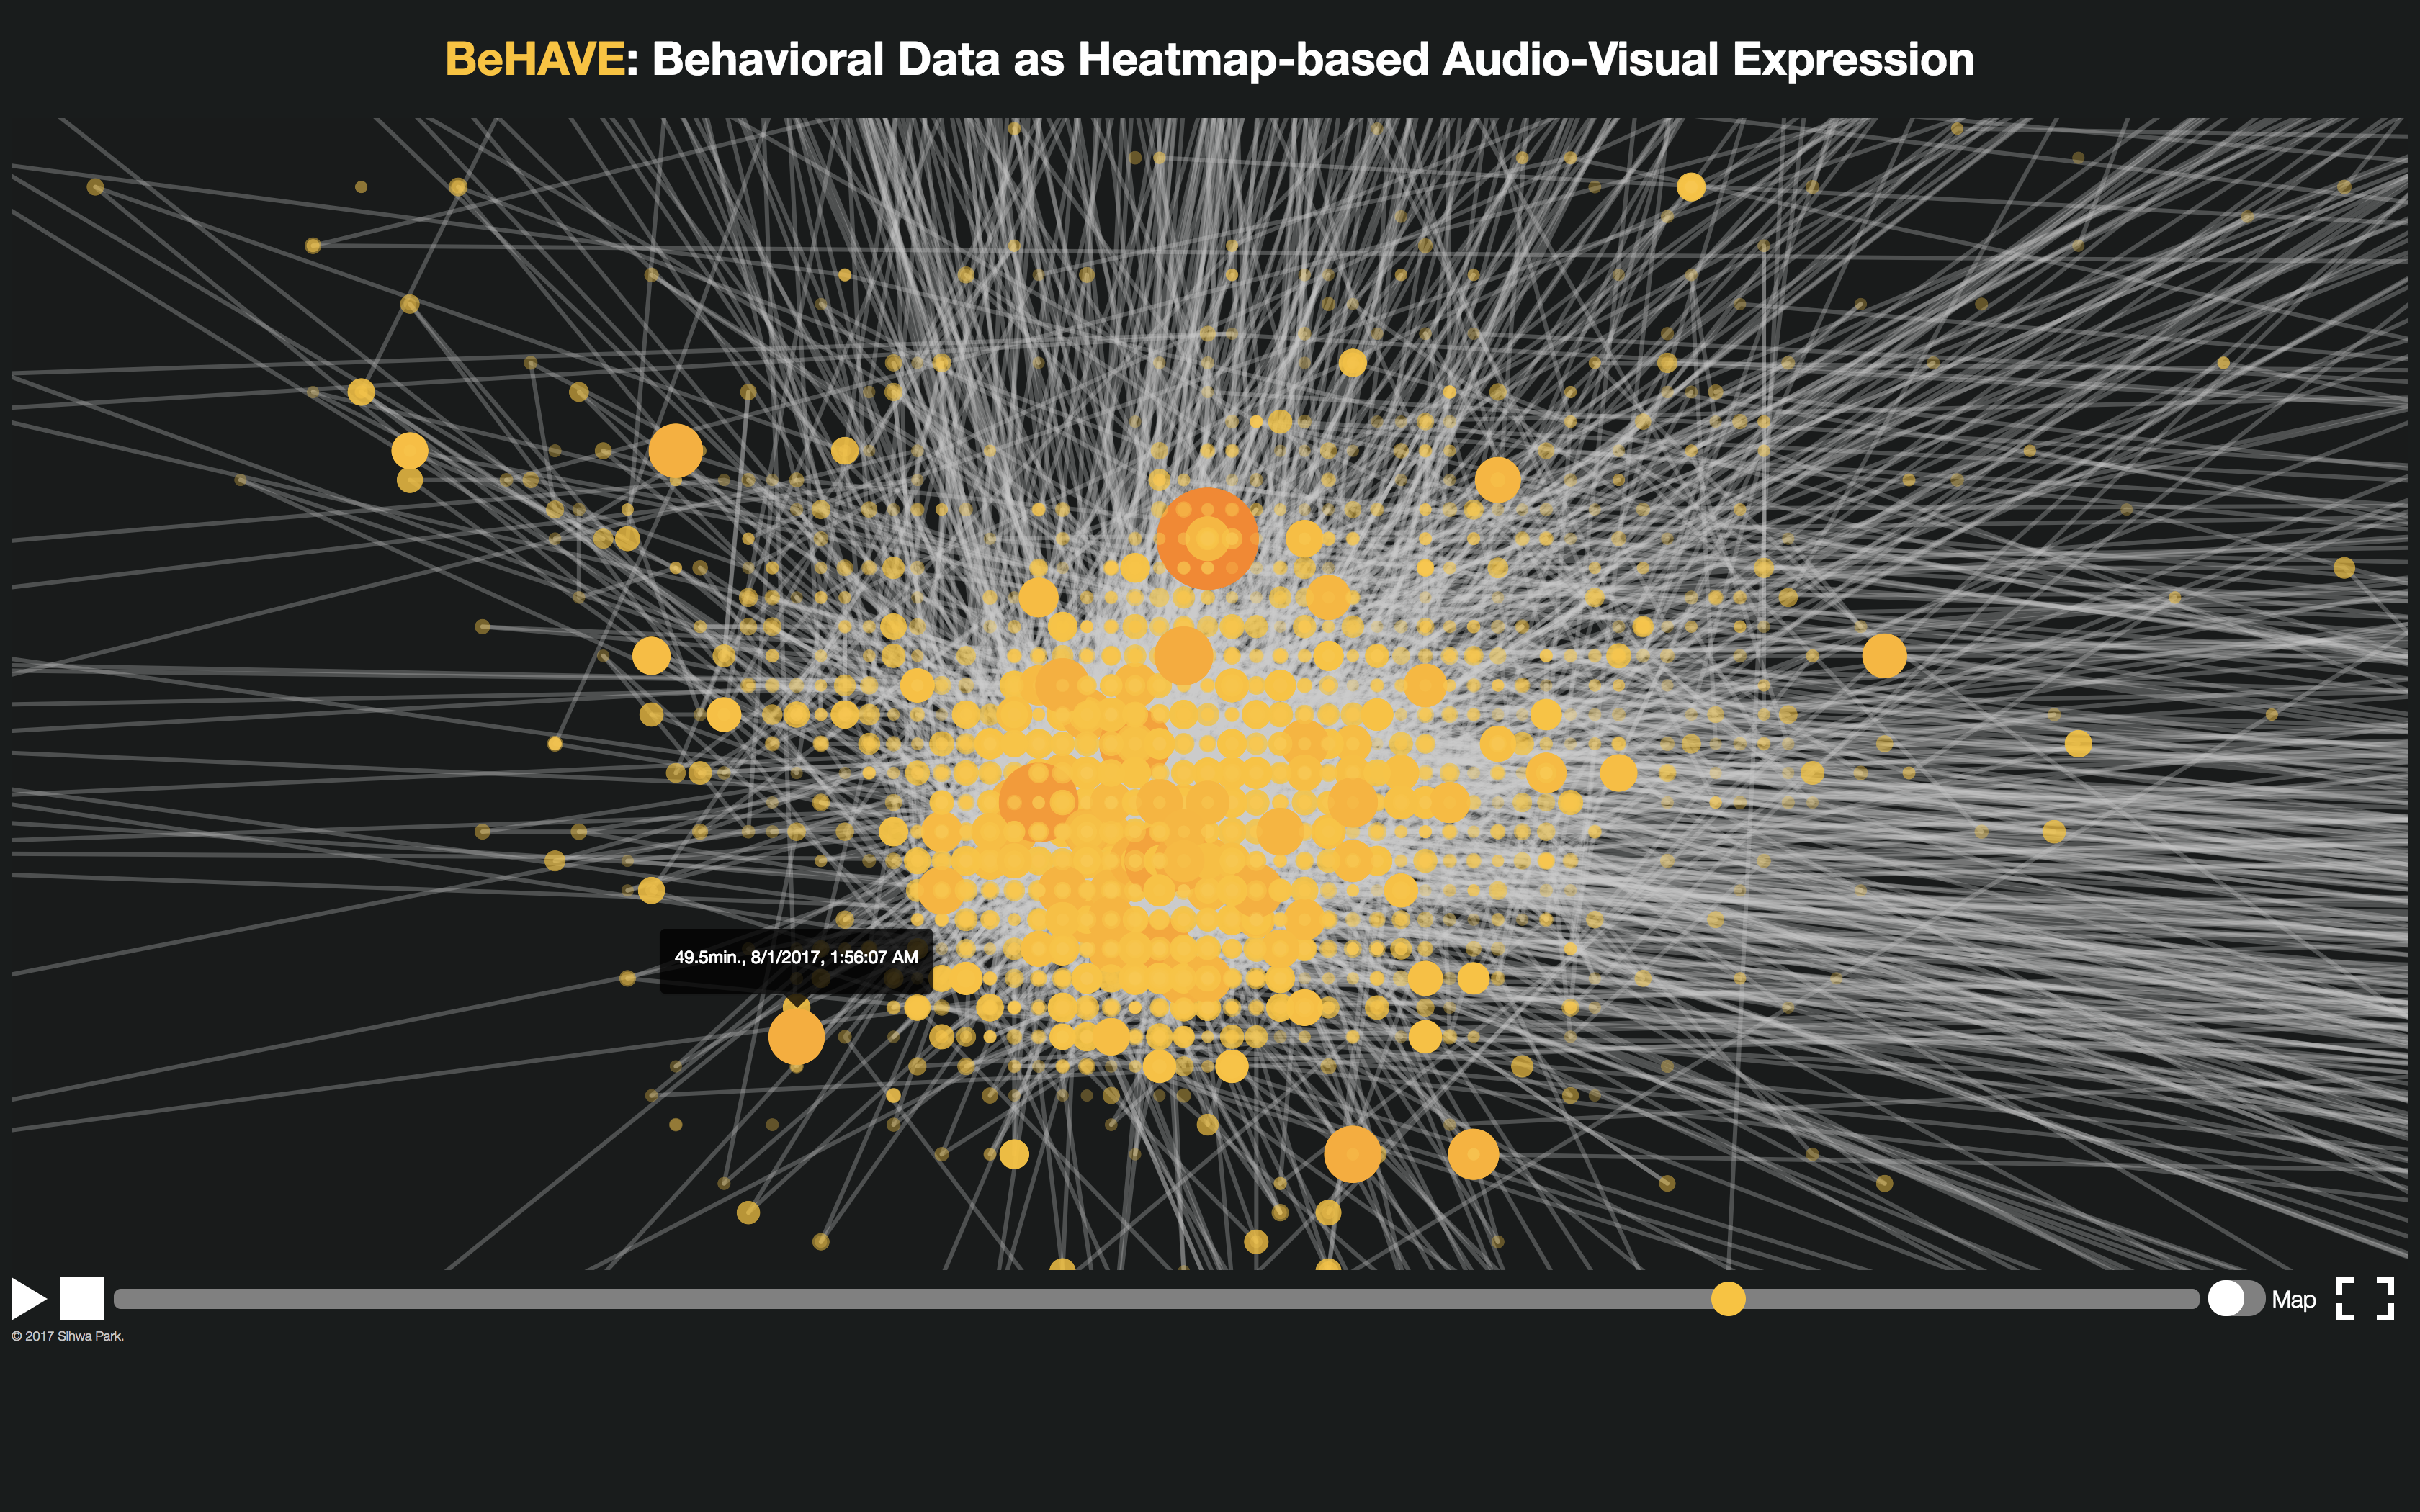
For data exploration, the time field of GeoJSON data is mainly used. And, it is necessary to transform a time range of data into a shorter range to reveal and perceive a set of long-term records. BeHAVE basically represents the data set of a day in 2 seconds and as a result, iterates the data of 365 days for about 12 minutes, but it is flexible to change it. To allow audiences to focus on instant data occurrence over time, a drawn circle fades out in a short period which is proportional to a use duration value. Also, it draws an opaque line which connects a location of the previously shown data with a location of data will be displayed next so that audiences can recognize the routes of data.
Data Sonification
The main issue of sonification in this project is how to reflect the temporal property of data in a short period. The use duration of each pickup can vary from one second to hours and it has to be transformed into the sound of a fraction of a second which is proportional to a seconds-per-day value; e.g., when it is 2 seconds per day, 1 minute is (1/60)/24×2 = 0.0013s (=1.3ms)and the maximum value 283 minutes is 383 ms. This means that it is appropriate to deal with sound on a microsound timescale in which an acoustic event occurs within a duration near the threshold of human auditory perception from one to a hundred milliseconds.
Gibberish for Web-based Sound Synthesis
To build a stand-alone web application, a JavaScript sound synthesis and scheduling library, Gibberish (https://github.com/gibber-cc/gibberish>) is used as a sound engine. One of the unique features Gibberish has is an ability to process and synthesis sound one sample at a time. This per-sample basis processing enables sample-accurate timing. BeHAVE can benefit from this feature because it generates microacoustic events.
Parameter Mapping for Microsound Events
Inspired by granular synthesis (https://mitpress.mit.edu/books/microsound), which is the most renowned microsound synthesis technique, the main idea for sonification is to control the amplitude envelope of a waveform according to a use duration value. BeHAVE uses Gibberish’s Synth instrument, which provides a single oscillator feeding a selectable filter, and it has envelope properties such as attack, decay, sustain, release (ADSR), and sustain level. Synth is connected to Freeverb for a reverberation effect so that it makes a sound with a longer envelope duration linger long. BeHAVE reflects a distance between the last and next locations in a frequency. This approach brings about a more dynamic change in terms of the pitch of sound because a small difference between locations can be a discernible frequency change.
User Interaction and GUI
BeHAVE has a GUI for controlling playback and exploring data on a map. An audience can play or pause the data exploration mode and control the position of a timeline scrollbar to jump to a certain date. Also, it is possible to toggle full-screen mode and decide whether to see the background map information or not. During the data exploration, an audience can zoom in and out or move the center location of a map with a mouse to look over the overall shape or detail of drawn lines.
For obtaining phone use data, an active screen time tracking iPhone application ‘Moment (https://inthemoment.io)’ has been used since January 20, 2017. Basically, this app detects a phone pickup which means when and where a user turns on or off his/her phone screen and calculates the duration between them. The app exports all pickup data as a JSON format file that includes a daily using time in minutes, the number of pickups, a location, date, and duration in seconds of each pickup, and most used apps based on apps’ battery usage. The exported file size of a year of data was about 5.6 Mb including the records of total 11,367 pickups. By using Python in the Jupyter Notebook (https://jupyter.org/), this raw data was parsed and processed to change it into a GeoJSON format, which is a geographic data structure and is used in a map-based visualization. The minimum, maximum, mean, and standard deviation value of the phone use duration are 0.017, 283.667, 6.243, and 14.465 minutes, respectively.
{
"type": "FeatureCollection",
"features": [
{
"type": "Feature",
"properties": {
"lengthInMinutes": 0.15,
"time": 0.0020833333333333333,
"date": "2017-01-20T00:03:44-08:00"
},
"geometry": {
"type": "Point",
"coordinates": [
-119.87071185363754,
34.41795049805089
] }
},
... ]
}
Visualization
A conventional way in visualizing geographic data is to plot data on an interactive or static map. A geographic heatmap is a particular way to identify where data occurs and depict the density of data in areas or at points. In this regard, a heatmap visualization is an appropriate way to represent the behavioral data of the phone use including location and time information. Due to the fact that the data is also temporal records, a feature for exploring and unfolding data over time is the key point to not only show a context and story of data but also evoke more aesthetic enjoyment in both visualization and sonification.
The screenshot of an initial interfaceHeatmap Visualization with MapBox
To plot GeoJSON data on an online map, MapBox GS JS (https://www.mapbox.com/mapbox-gl-js), which is a WebGL based JavaScript library for rendering interactive maps, is used. The coordinates information of GeoJSON data determines locations of circles on a map and the use duration of each pickup is mapped onto the radius and color of each circle. According to a zoom level, it reveals detailed data points or makes clusters of closest circles. Also, an hourly heatmap at the bottom of a map that shows how long I used my phone hourly is used to select a date range of data to be plotted.
Temporal Data Exploration
For data exploration, the time field of GeoJSON data is mainly used. And, it is necessary to transform a time range of data into a shorter range to reveal and perceive a set of long-term records. BeHAVE basically represents the data set of a day in 2 seconds and as a result, iterates the data of 365 days for about 12 minutes, but it is flexible to change it. To allow audiences to focus on instant data occurrence over time, a drawn circle fades out in a short period which is proportional to a use duration value. Also, it draws an opaque line which connects a location of the previously shown data with a location of data will be displayed next so that audiences can recognize the routes of data.
Data Sonification
The main issue of sonification in this project is how to reflect the temporal property of data in a short period. The use duration of each pickup can vary from one second to hours and it has to be transformed into the sound of a fraction of a second which is proportional to a seconds-per-day value; e.g., when it is 2 seconds per day, 1 minute is (1/60)/24×2 = 0.0013s (=1.3ms)and the maximum value 283 minutes is 383 ms. This means that it is appropriate to deal with sound on a microsound timescale in which an acoustic event occurs within a duration near the threshold of human auditory perception from one to a hundred milliseconds.
Gibberish for Web-based Sound Synthesis
To build a stand-alone web application, a JavaScript sound synthesis and scheduling library, Gibberish (https://github.com/gibber-cc/gibberish>) is used as a sound engine. One of the unique features Gibberish has is an ability to process and synthesis sound one sample at a time. This per-sample basis processing enables sample-accurate timing. BeHAVE can benefit from this feature because it generates microacoustic events.
Parameter Mapping for Microsound Events
Inspired by granular synthesis (https://mitpress.mit.edu/books/microsound), which is the most renowned microsound synthesis technique, the main idea for sonification is to control the amplitude envelope of a waveform according to a use duration value. BeHAVE uses Gibberish’s Synth instrument, which provides a single oscillator feeding a selectable filter, and it has envelope properties such as attack, decay, sustain, release (ADSR), and sustain level. Synth is connected to Freeverb for a reverberation effect so that it makes a sound with a longer envelope duration linger long. BeHAVE reflects a distance between the last and next locations in a frequency. This approach brings about a more dynamic change in terms of the pitch of sound because a small difference between locations can be a discernible frequency change.
User Interaction and GUI
BeHAVE has a GUI for controlling playback and exploring data on a map. An audience can play or pause the data exploration mode and control the position of a timeline scrollbar to jump to a certain date. Also, it is possible to toggle full-screen mode and decide whether to see the background map information or not. During the data exploration, an audience can zoom in and out or move the center location of a map with a mouse to look over the overall shape or detail of drawn lines.
Final result
Code
All work is developed with JavaScript, HTML, and CSS.
Due to a privacy concern, the code and data are only available upon request.
Due to a privacy concern, the code and data are only available upon request.