Visualization of global natural hazards
MAT 259, 2018
Qiaodong
Concept
I'd like to visualize the global hazard events happens over the year. The data can be obtained from NOAA website: https://www.ngdc.noaa.gov/hazard/hazards.shtml. I can obtain the data for three major hazards: volcano, tsunami and earthquakes. For each hazards, I obtained a csv files contain all the information for that hazard. Each row of the csv file is a log related to one specific events. There are several important information related to one event, for example, the latitude, longitude of each events, the year that events happened. There are also some other interesting information related, for example, the magnitude of the earthquake/volcano/tsunami, in which country, and how many people died as the result. I download all three csv files containing the above information. There are over 6000 events of both earthquakes and tsunami, and about 800 events of volcanos. The time range of the hazards happens from 2000 BC to now.
Query
The dataset can be obtained from NOAA website: https://www.ngdc.noaa.gov/hazard/hazards.shtml
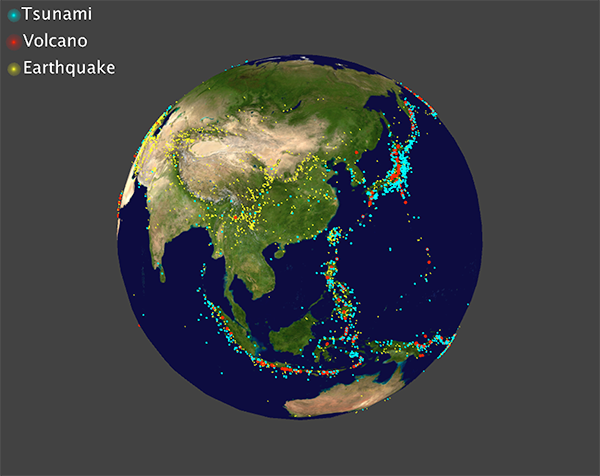
Preliminary sketches
Concept:
To develop the visualization, I'd like to map the location of the data to the earth sphere. This can be done by using latitude and longitude of given by the csv files. Initially I just mapped all the events happens over the earth sphere:
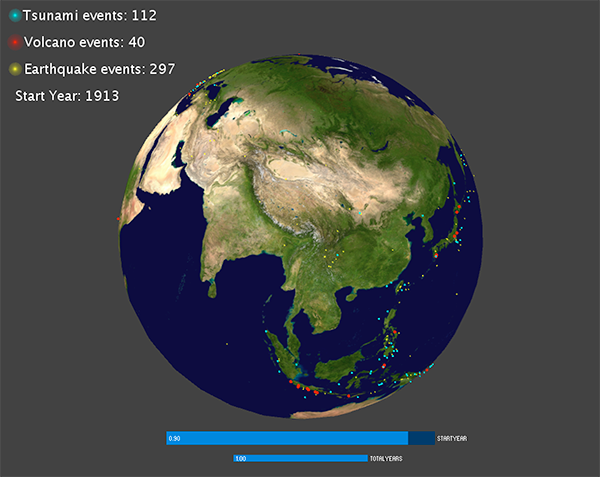
Process
Then I noticed the events are too cluttered, so it may be better to display the events that happens at specific range of time. To do this, I added a slider for user to choose year with CP5, and another slider for user to choose how many events are displayed on the screen.
Since each events contains some interesting information, I'd like to display the information related to that events when the cursor is close to a specific events.
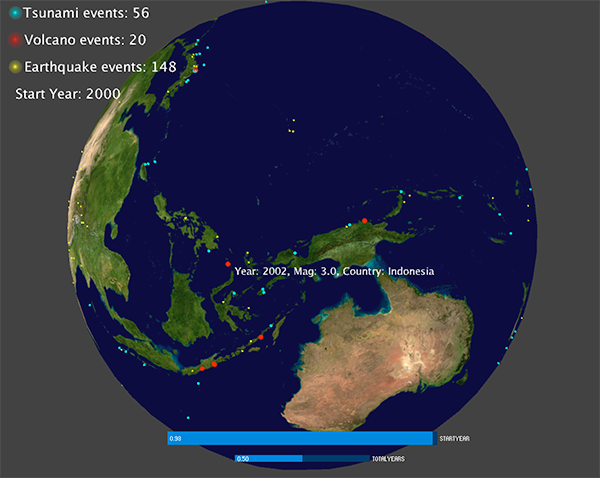
Since each events contains some interesting information, I'd like to display the information related to that events when the cursor is close to a specific events.
Final result
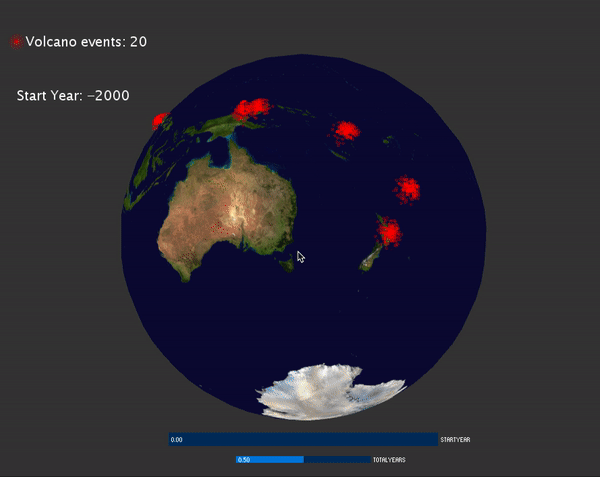
Next, to make the display of each events more interesting, I decided to use a line shader to display the tsunami and the earthquake events. And use particle system to display the volcano events. The magnitude of the volcano events is mapped to the size of the particle system.
I use a a sphere shape and a line shader to visualize Tsunami and Earthquake events.The magnitude of the tsunami and earthquake events is mapped to the radius of the displayed circle.
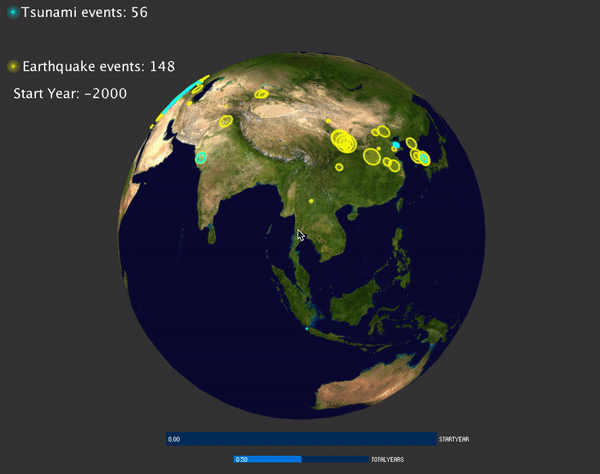
I use a a sphere shape and a line shader to visualize Tsunami and Earthquake events.The magnitude of the tsunami and earthquake events is mapped to the radius of the displayed circle.
Code