3D Visualization of New York City Taxi Data
MAT 259, 2018
Benson Li
Concept
For my final project, I decided to create an interactive visualization of New York City taxi data. Because I have never created a Javascript project before, I decided to use this project as an opportunity to do so.
The specifics of my visualization are(best read after running the code):
* The endpoint on the bottom plane is mapped to the pickup location of an entry of the dataset.
* The endpoint on the top plane is mapped to the dropoff.
* The time it took for the ride is mapped to the curveTightness. So in theory, longer rides should be more loopy. But, due to the way I chose the control points, it didn't create the contrast that I had hoped for.
* The payment is mapped to the color of each curve using the jet colormap. Meaning, blue is low, and red is high.
Query
The "Taxi.ipynb" Jupyter notebook in the data folder will take the raw New York City Taxi dataset "trial_data.csv" and extract the pickup longitude/latitude, dropoff longitude/latitude, total payment, and duration of the ride. It will also apply a ceiling to the payment and duration.
Process
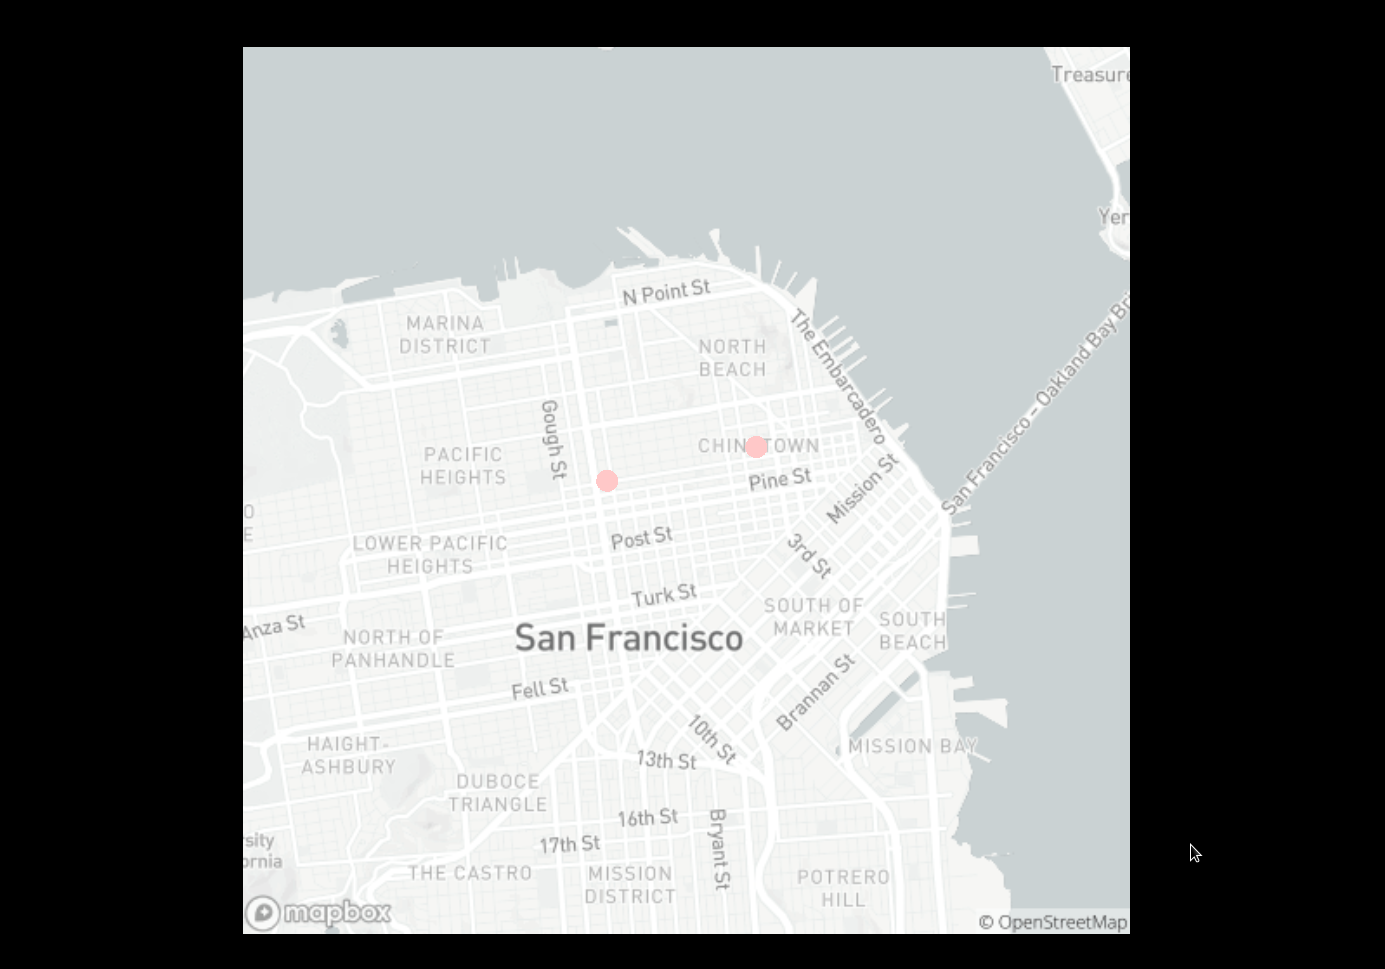
First, to check that my world to plane map was working properly, I mapped a few locations that I knew.
Then I mapped the datapoints to lines, with time dictating the length of the line. This didn't turn out so great.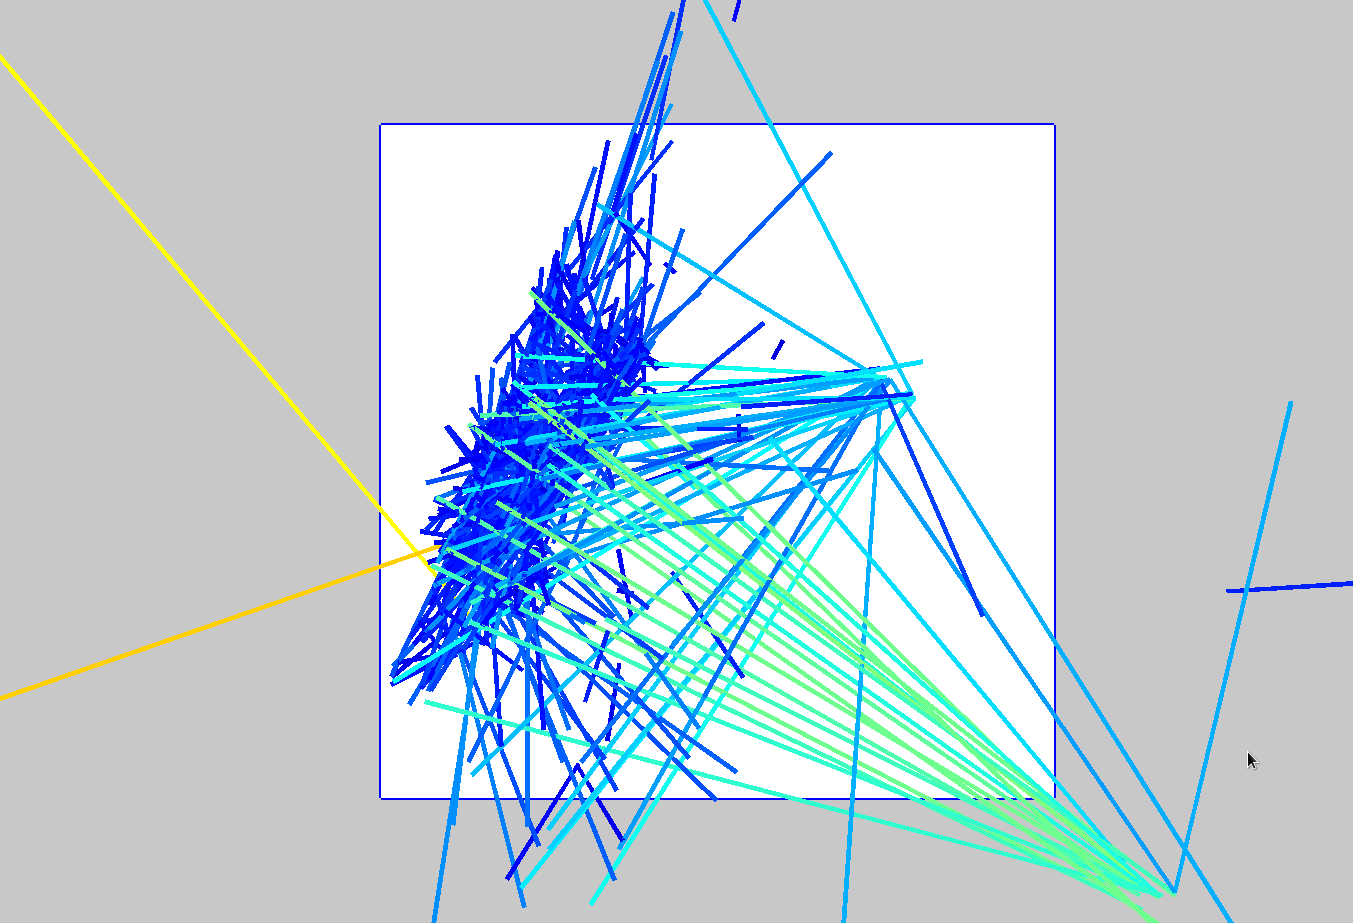
So instead, the made the length of the lines a fixed distance, changed the lines to curves, and attached another plane on top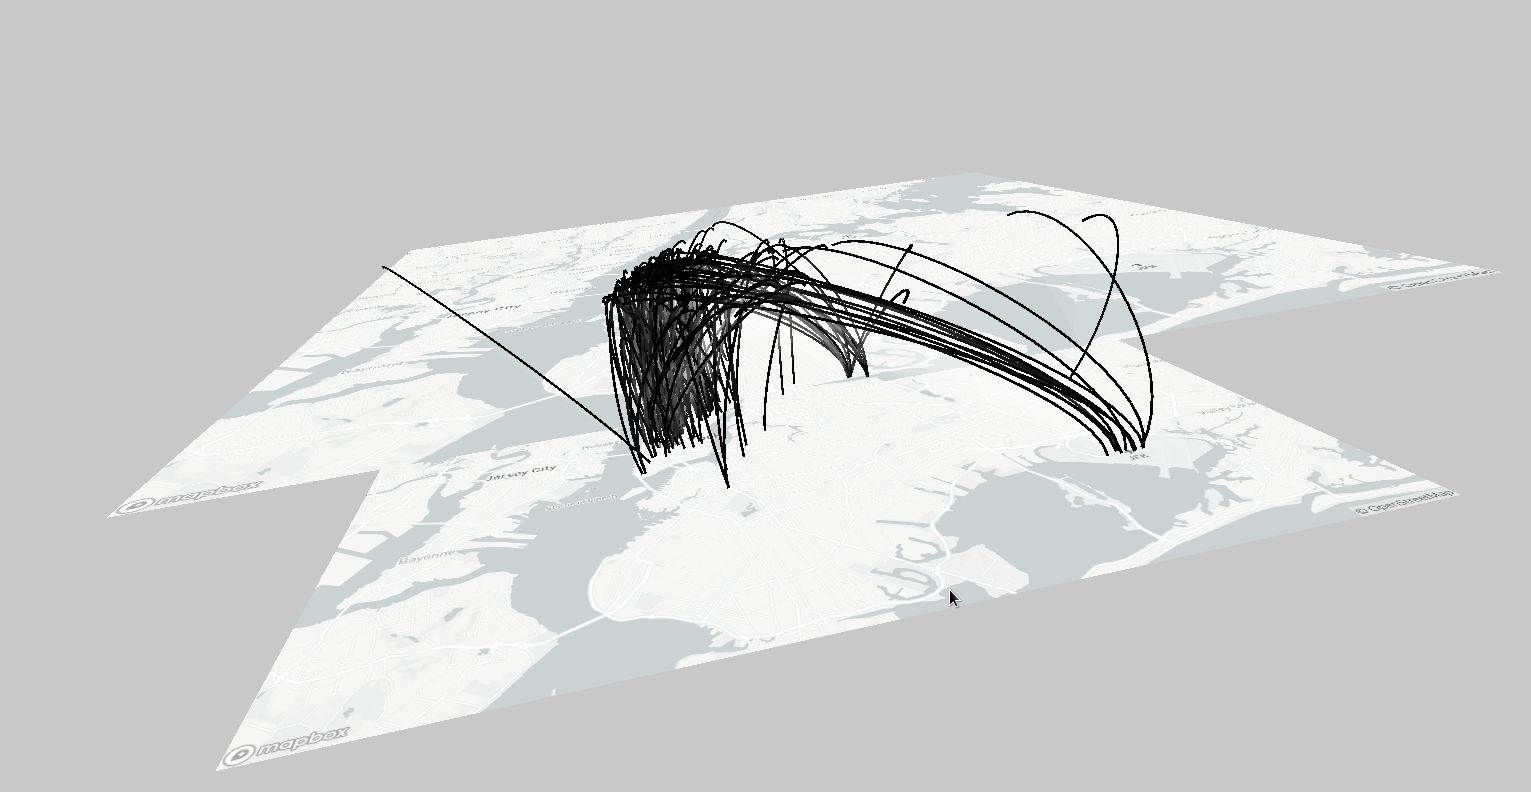
Then I mapped the datapoints to lines, with time dictating the length of the line. This didn't turn out so great.
So instead, the made the length of the lines a fixed distance, changed the lines to curves, and attached another plane on top
Final result
I decided to only use 2500 out of a possible 10,000 datapoints so the project would run smoothly. The map of New York City was taken using MapBox's Static API Playground.
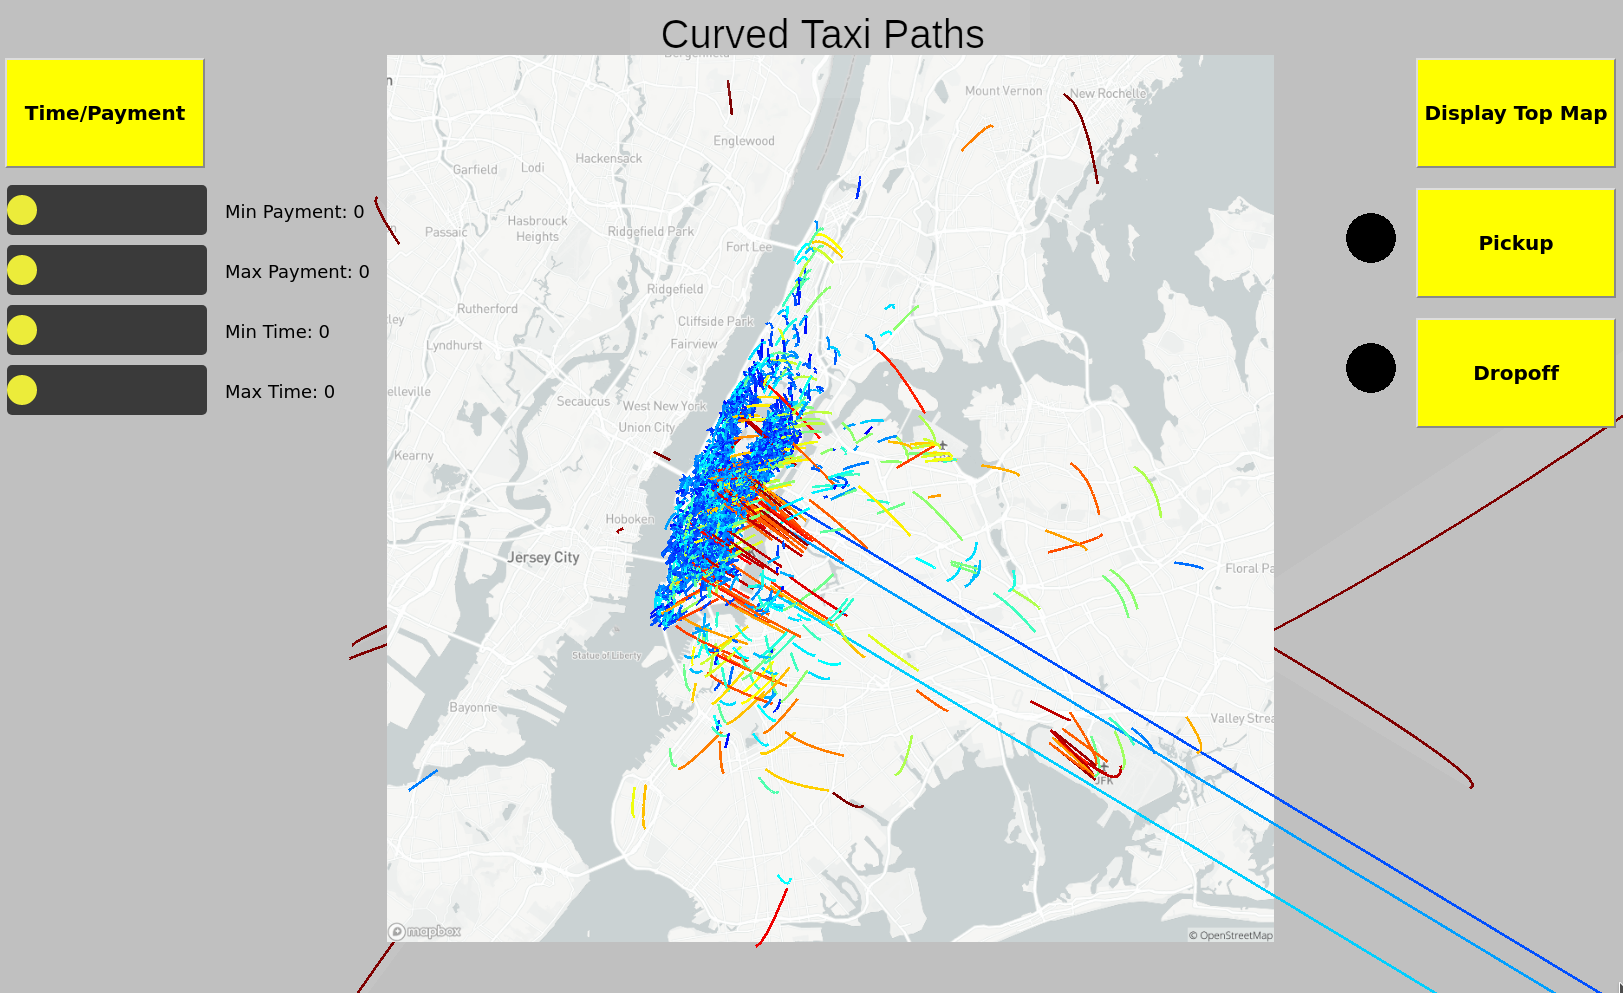
By adjusting the sliders, you can filter the curves based on the payment and time interval you specify.Note that in order to update, the Max sliders need to be greater than their Min counterparts. Also the times and payments have a cutoff, so that I can utilize a larger range of the spectrum.
The purpose of Top Map Button is so you can see where each datapoint's exact pickup location is, as it is somewhat blocked by top plane.
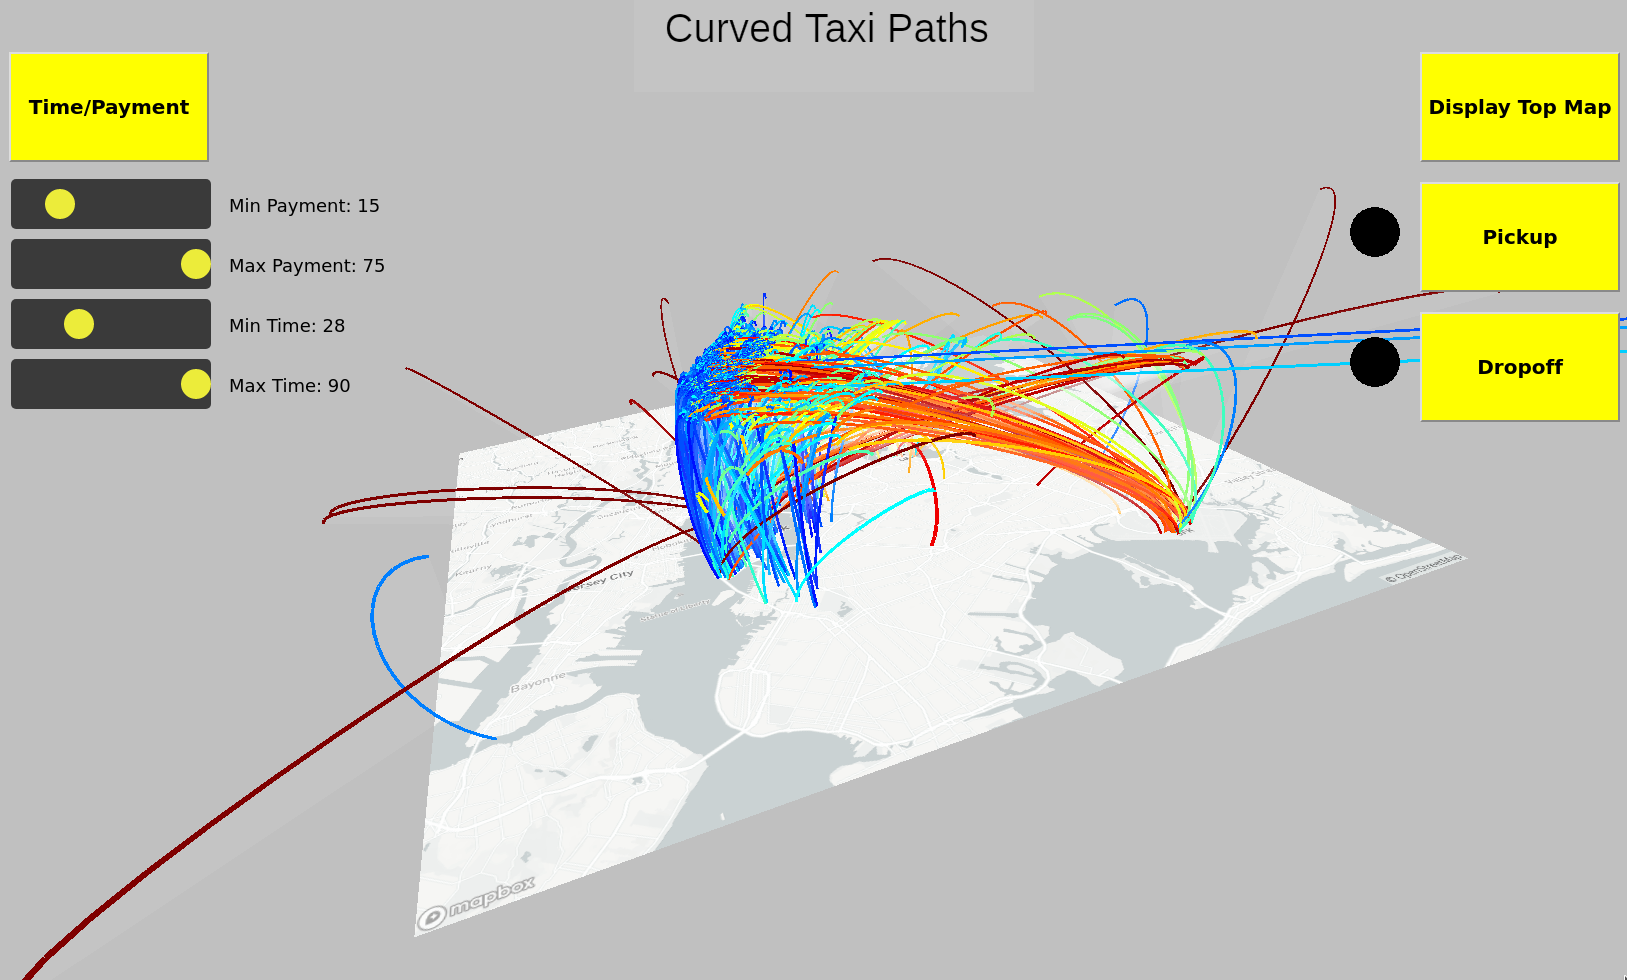
When you click on the Pickup/Dropoff Button, you will be shown a different display with the map plane and a yellow circle. The purpose of this is to allow the user to also filter pickup/dropoff locations. Click and drag the circle to the pickup/dropoff location you want to see, and use the mouseWheel to increase the location radius.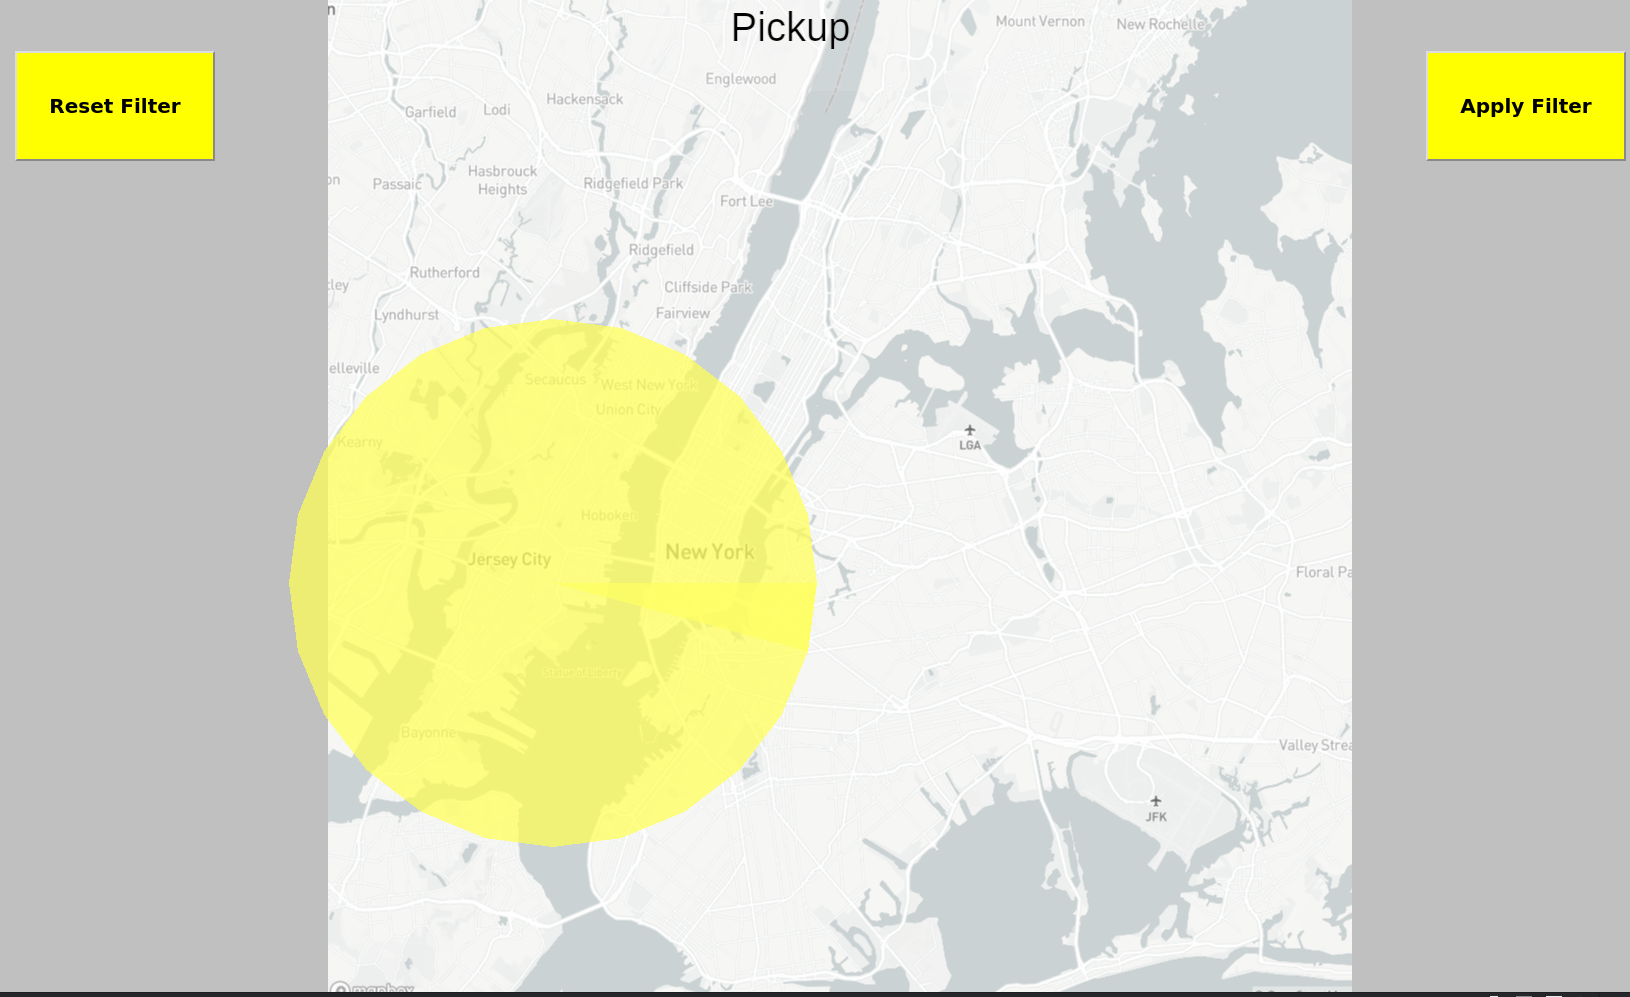
Then, clicking the "Apply Filter" button will filter out the datapoints based on the current setting of the pickup and dropoff circle, as well as the slider's current settings. Notice now that the circle next to the "Pickup" button is now yellow, indicating that we have chosen a filter for the pickup location. To not have any pickup location filter, click the "Reset" button on the Pickup title screen.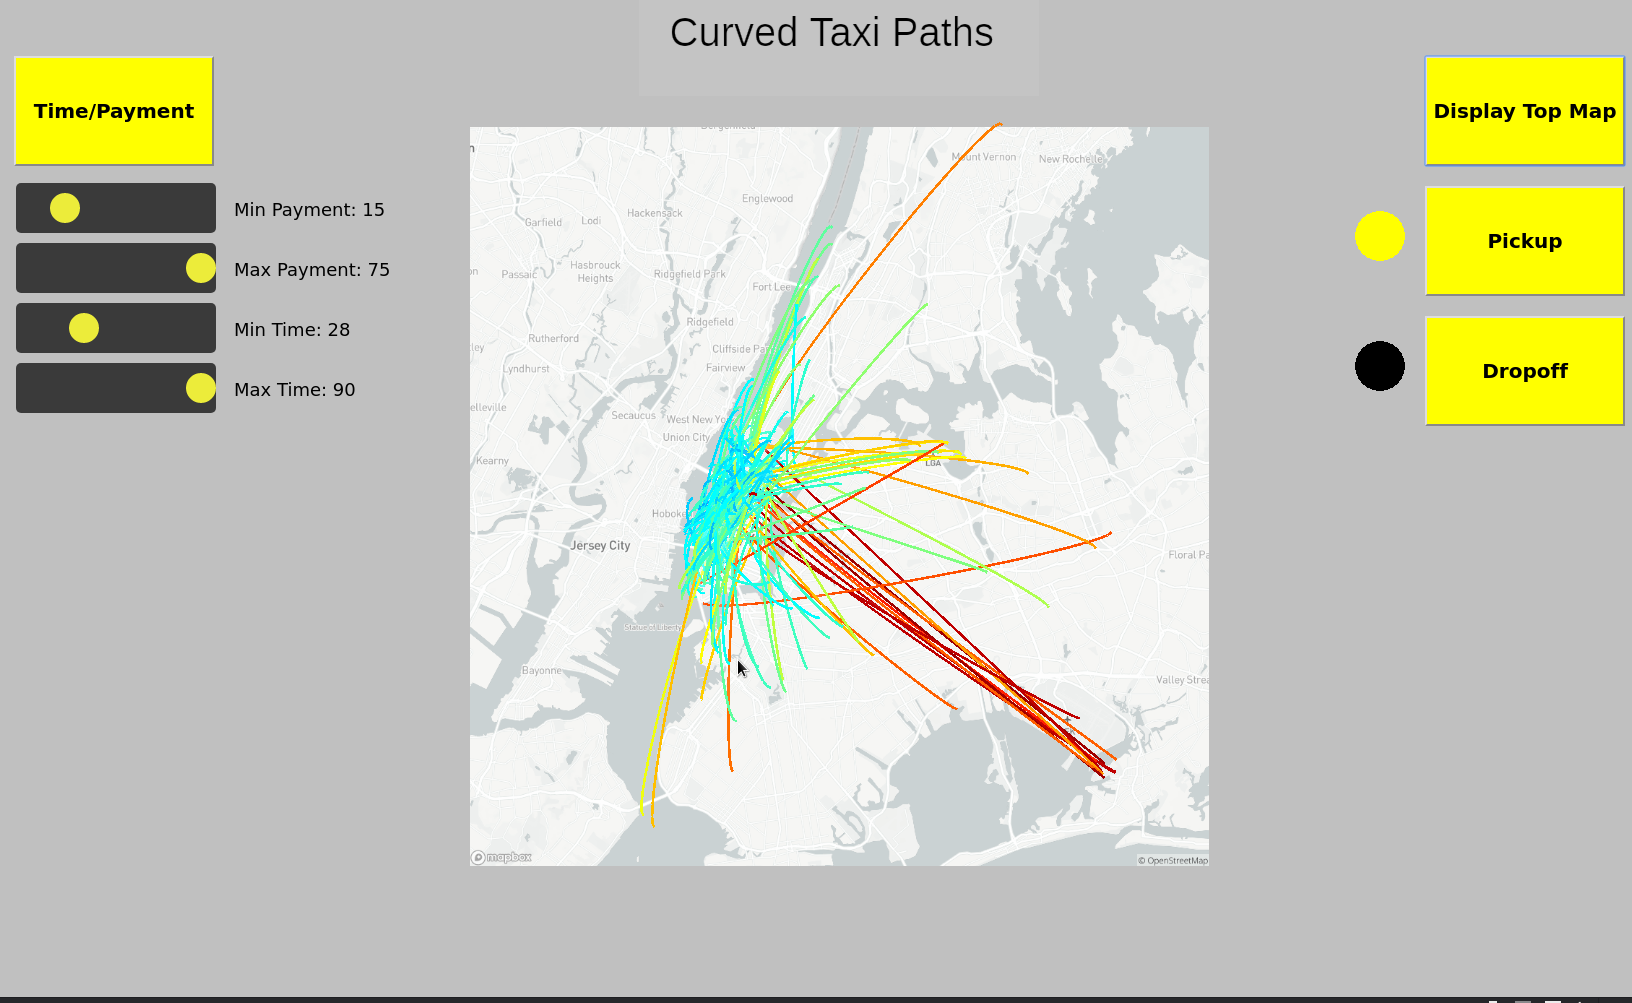
By adjusting the sliders, you can filter the curves based on the payment and time interval you specify.Note that in order to update, the Max sliders need to be greater than their Min counterparts. Also the times and payments have a cutoff, so that I can utilize a larger range of the spectrum.
The purpose of Top Map Button is so you can see where each datapoint's exact pickup location is, as it is somewhat blocked by top plane.
When you click on the Pickup/Dropoff Button, you will be shown a different display with the map plane and a yellow circle. The purpose of this is to allow the user to also filter pickup/dropoff locations. Click and drag the circle to the pickup/dropoff location you want to see, and use the mouseWheel to increase the location radius.
Then, clicking the "Apply Filter" button will filter out the datapoints based on the current setting of the pickup and dropoff circle, as well as the slider's current settings. Notice now that the circle next to the "Pickup" button is now yellow, indicating that we have chosen a filter for the pickup location. To not have any pickup location filter, click the "Reset" button on the Pickup title screen.
Analysis/Comments
After finishing the project, I did some exploratory data analysis.
1. What rides are high in payment and time spent?
It turns out the ones coming out of JFK airport and into the heart of New York City.
2. Are there rides that are low in time, but high in payment?(Perhaps there is a location with a higher density of wealthy and generous patrons)
No, I guess not. The rides looked fairly random.
* Although I had to spend more time debugging little errors due to the dyanmicaly typed nature of Javascrpt, I found that I didn't need to use as much print statements to get the state of variables, as I could simply open the console in the browse and inspect the state from there.
* The `texture()` function in p5js cannot be contained in a `push()` and `pop()`, and instead is only contained in whatever function it is called in(so it has function scope, like Javascript's keyword var). The implications of this is that p5js would try to apply the texture to all the other geometric objects, such as the curves. Now, clearly this is ridiculous, but either p5js or Javascript is safely failing, and instead of throwing an error, the program will just not show the lines.
* The easyCam constructor does not work with inputing a custom initial state. Same for its `pushResetState` method. I had to bypass by finding the name of the camera's reset state property, and manually setting that myself.
* Apparently p5js does not allow pictures as background in WEBGL mode
Code