Text Mining || TED Talk
MAT 259, 2018
Annika Tan
Concept
The goal of my text mining project is to build a visual classifier that breaks each text into designated clusters.
My dataset if from records of TED Talks (TED.com) until September 21st, 2017 (brought to us by Kaggle). It contains information about TED Talks. The dataset includes 17 attributions like name, title, description, event, tags, and so forth. For my project, I am only focusing on tags which holds a list of themes associated with the talk.
My dataset if from records of TED Talks (TED.com) until September 21st, 2017 (brought to us by Kaggle). It contains information about TED Talks. The dataset includes 17 attributions like name, title, description, event, tags, and so forth. For my project, I am only focusing on tags which holds a list of themes associated with the talk.
Process
The original dataset holds more than 2,500 rows. However, due to technical issues and fatal errors, I had to cut my data down to 10 lines. For the tags, I removed special symbols and punctuations and split the word vectors by space.
I have done previously text mining projects and visualized it with word clouds, and simple bar graphs and lines plots. I want to challenge myself and learn how to use a new exploratory analysis.
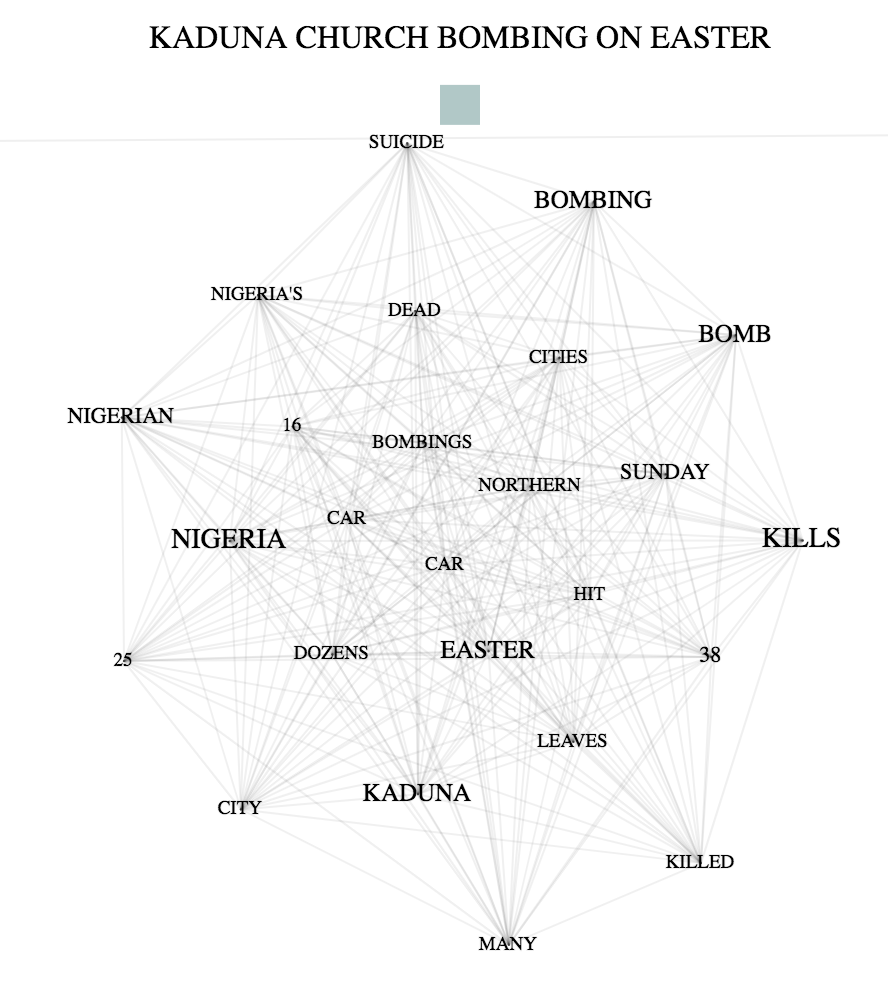
I was inspired by Rodger's "Reporting on Boko Haram" project. He created single text webs by every category. My project is heavily based on the ToxicLibs example, "Force Directed Graph" by Daniel Shiffmann.
I have done previously text mining projects and visualized it with word clouds, and simple bar graphs and lines plots. I want to challenge myself and learn how to use a new exploratory analysis.
I was inspired by Rodger's "Reporting on Boko Haram" project. He created single text webs by every category. My project is heavily based on the ToxicLibs example, "Force Directed Graph" by Daniel Shiffmann.
Final result
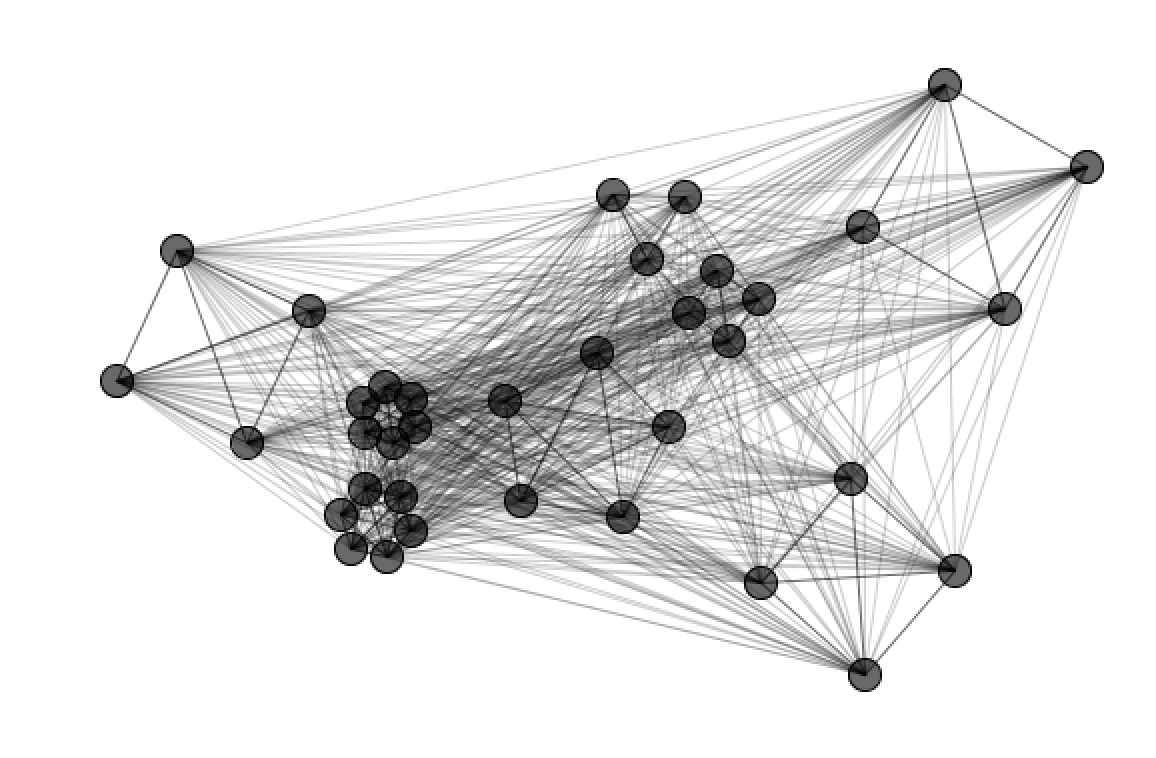
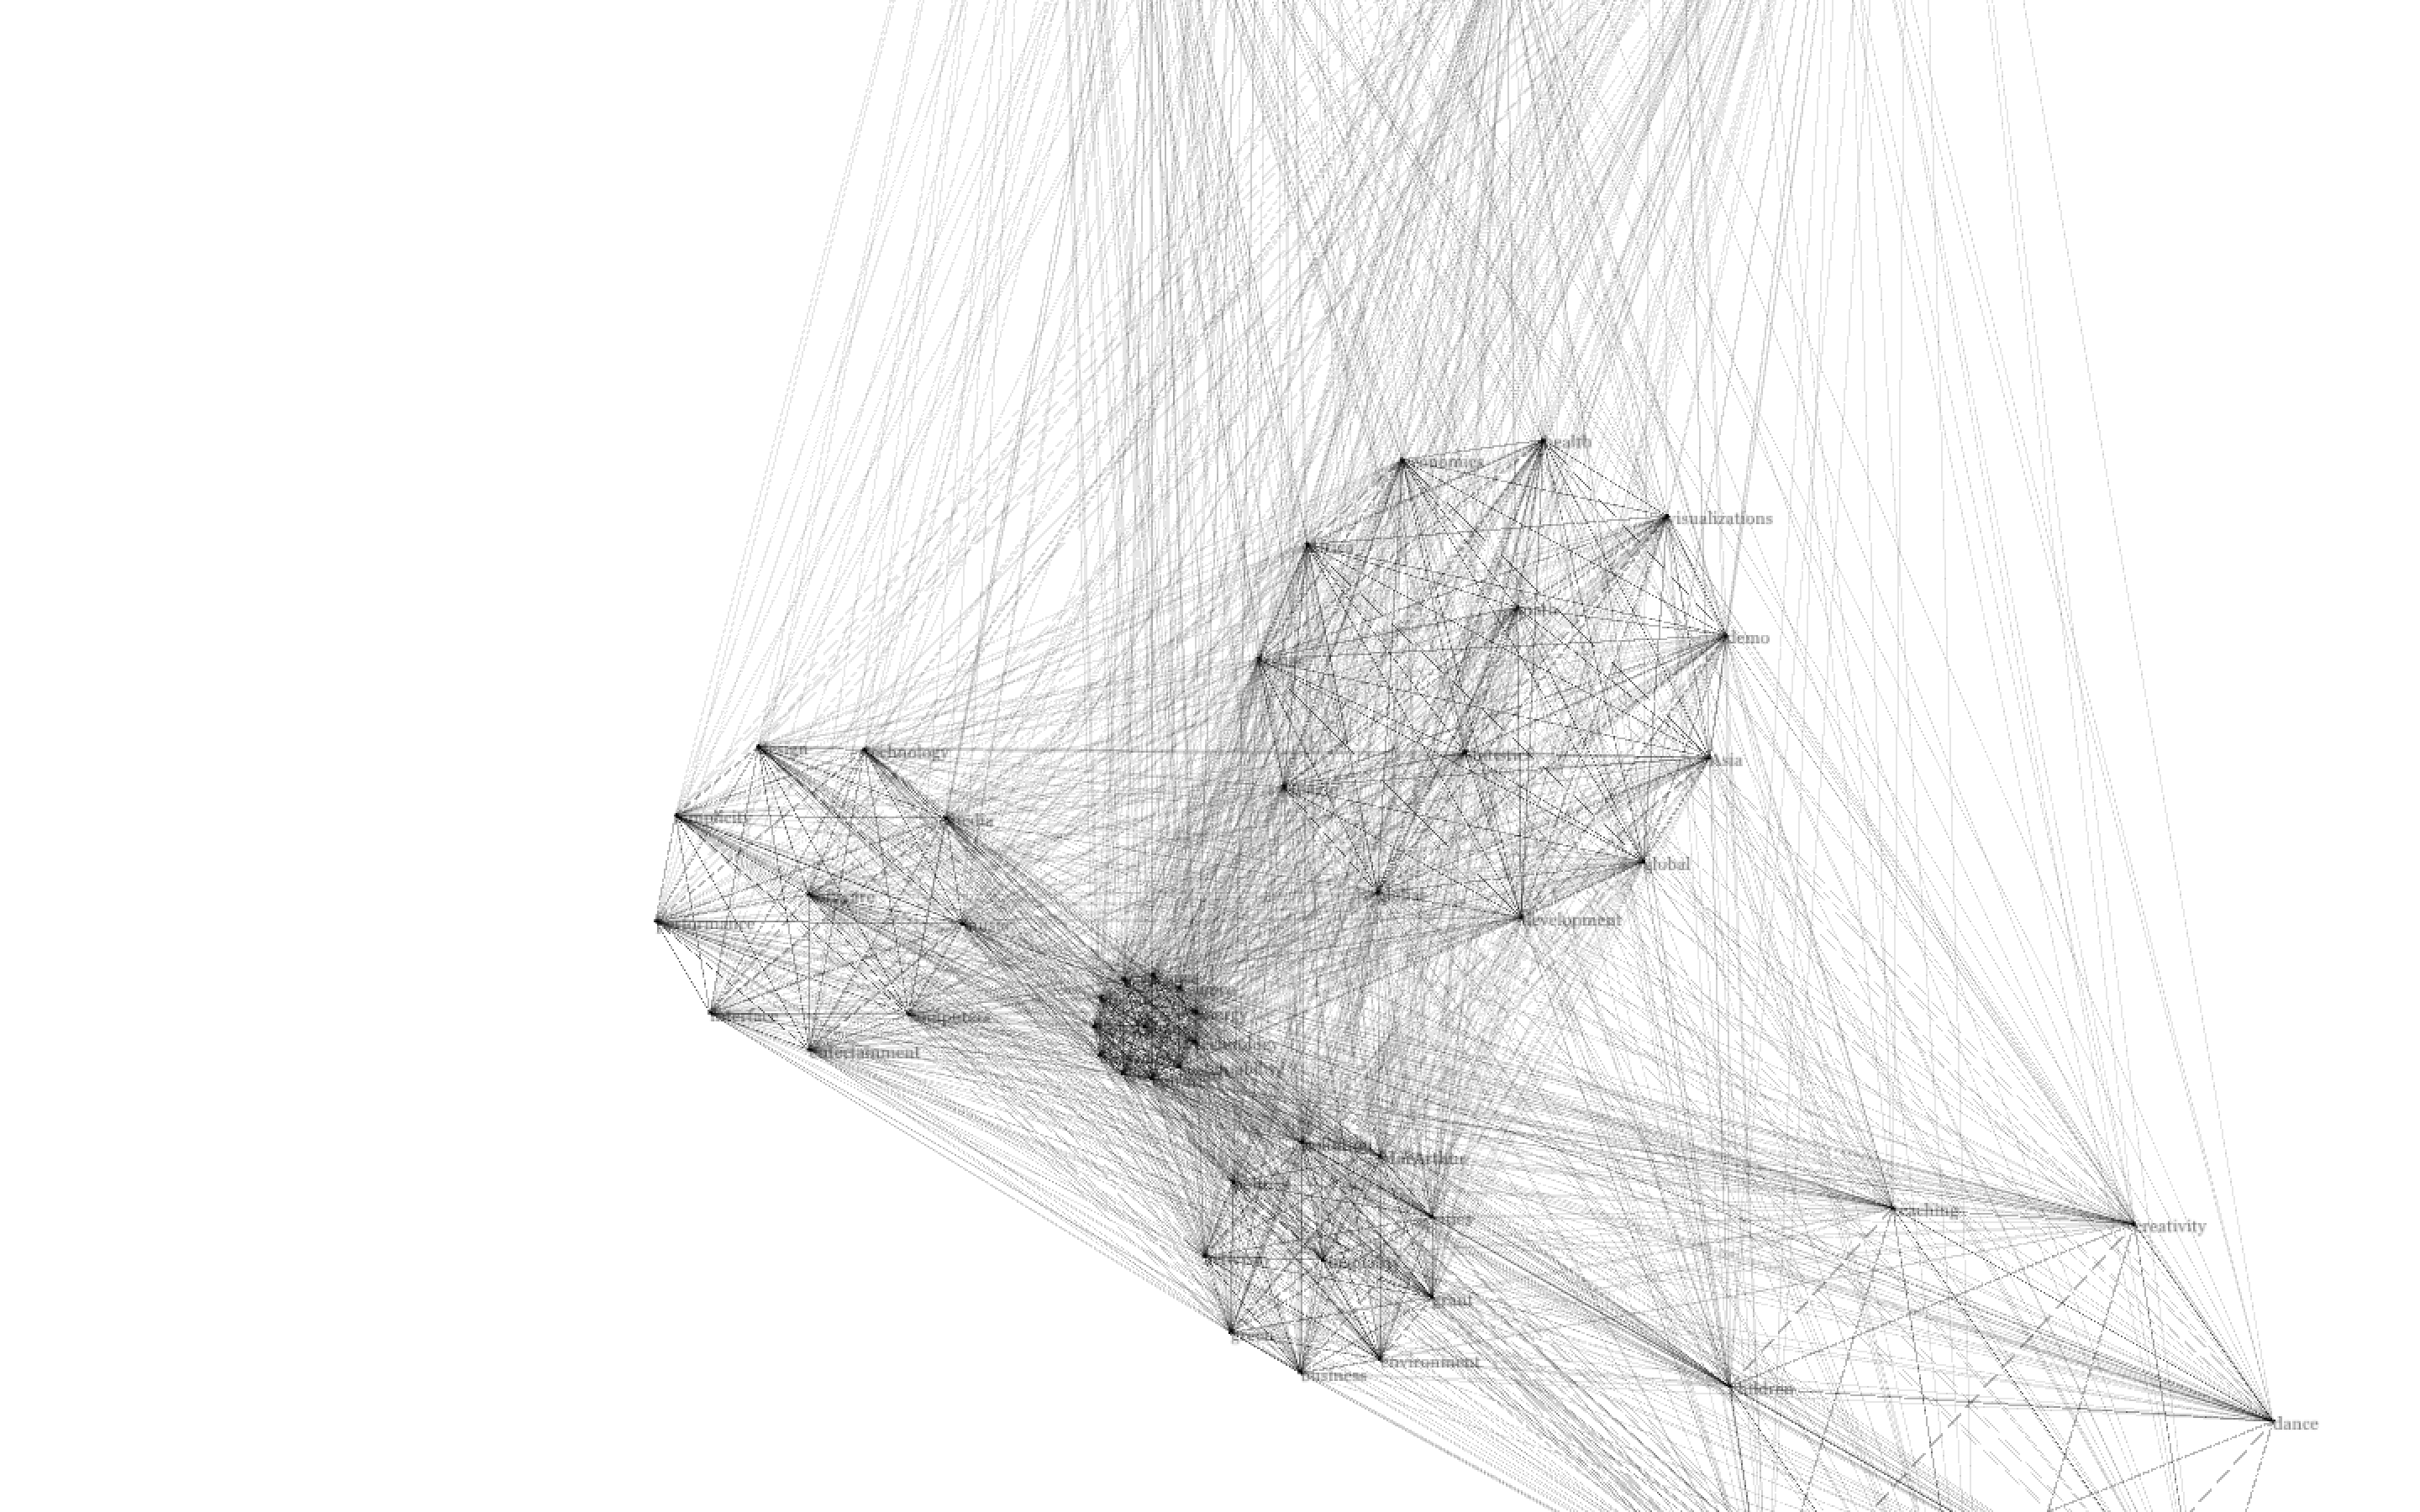
I created two similar models. In the first two image, we can see the clusters overlapping rather than spreading out. In this case, the nodes for each cluster is still connecting to one another, however the clusters do not have a relationship.
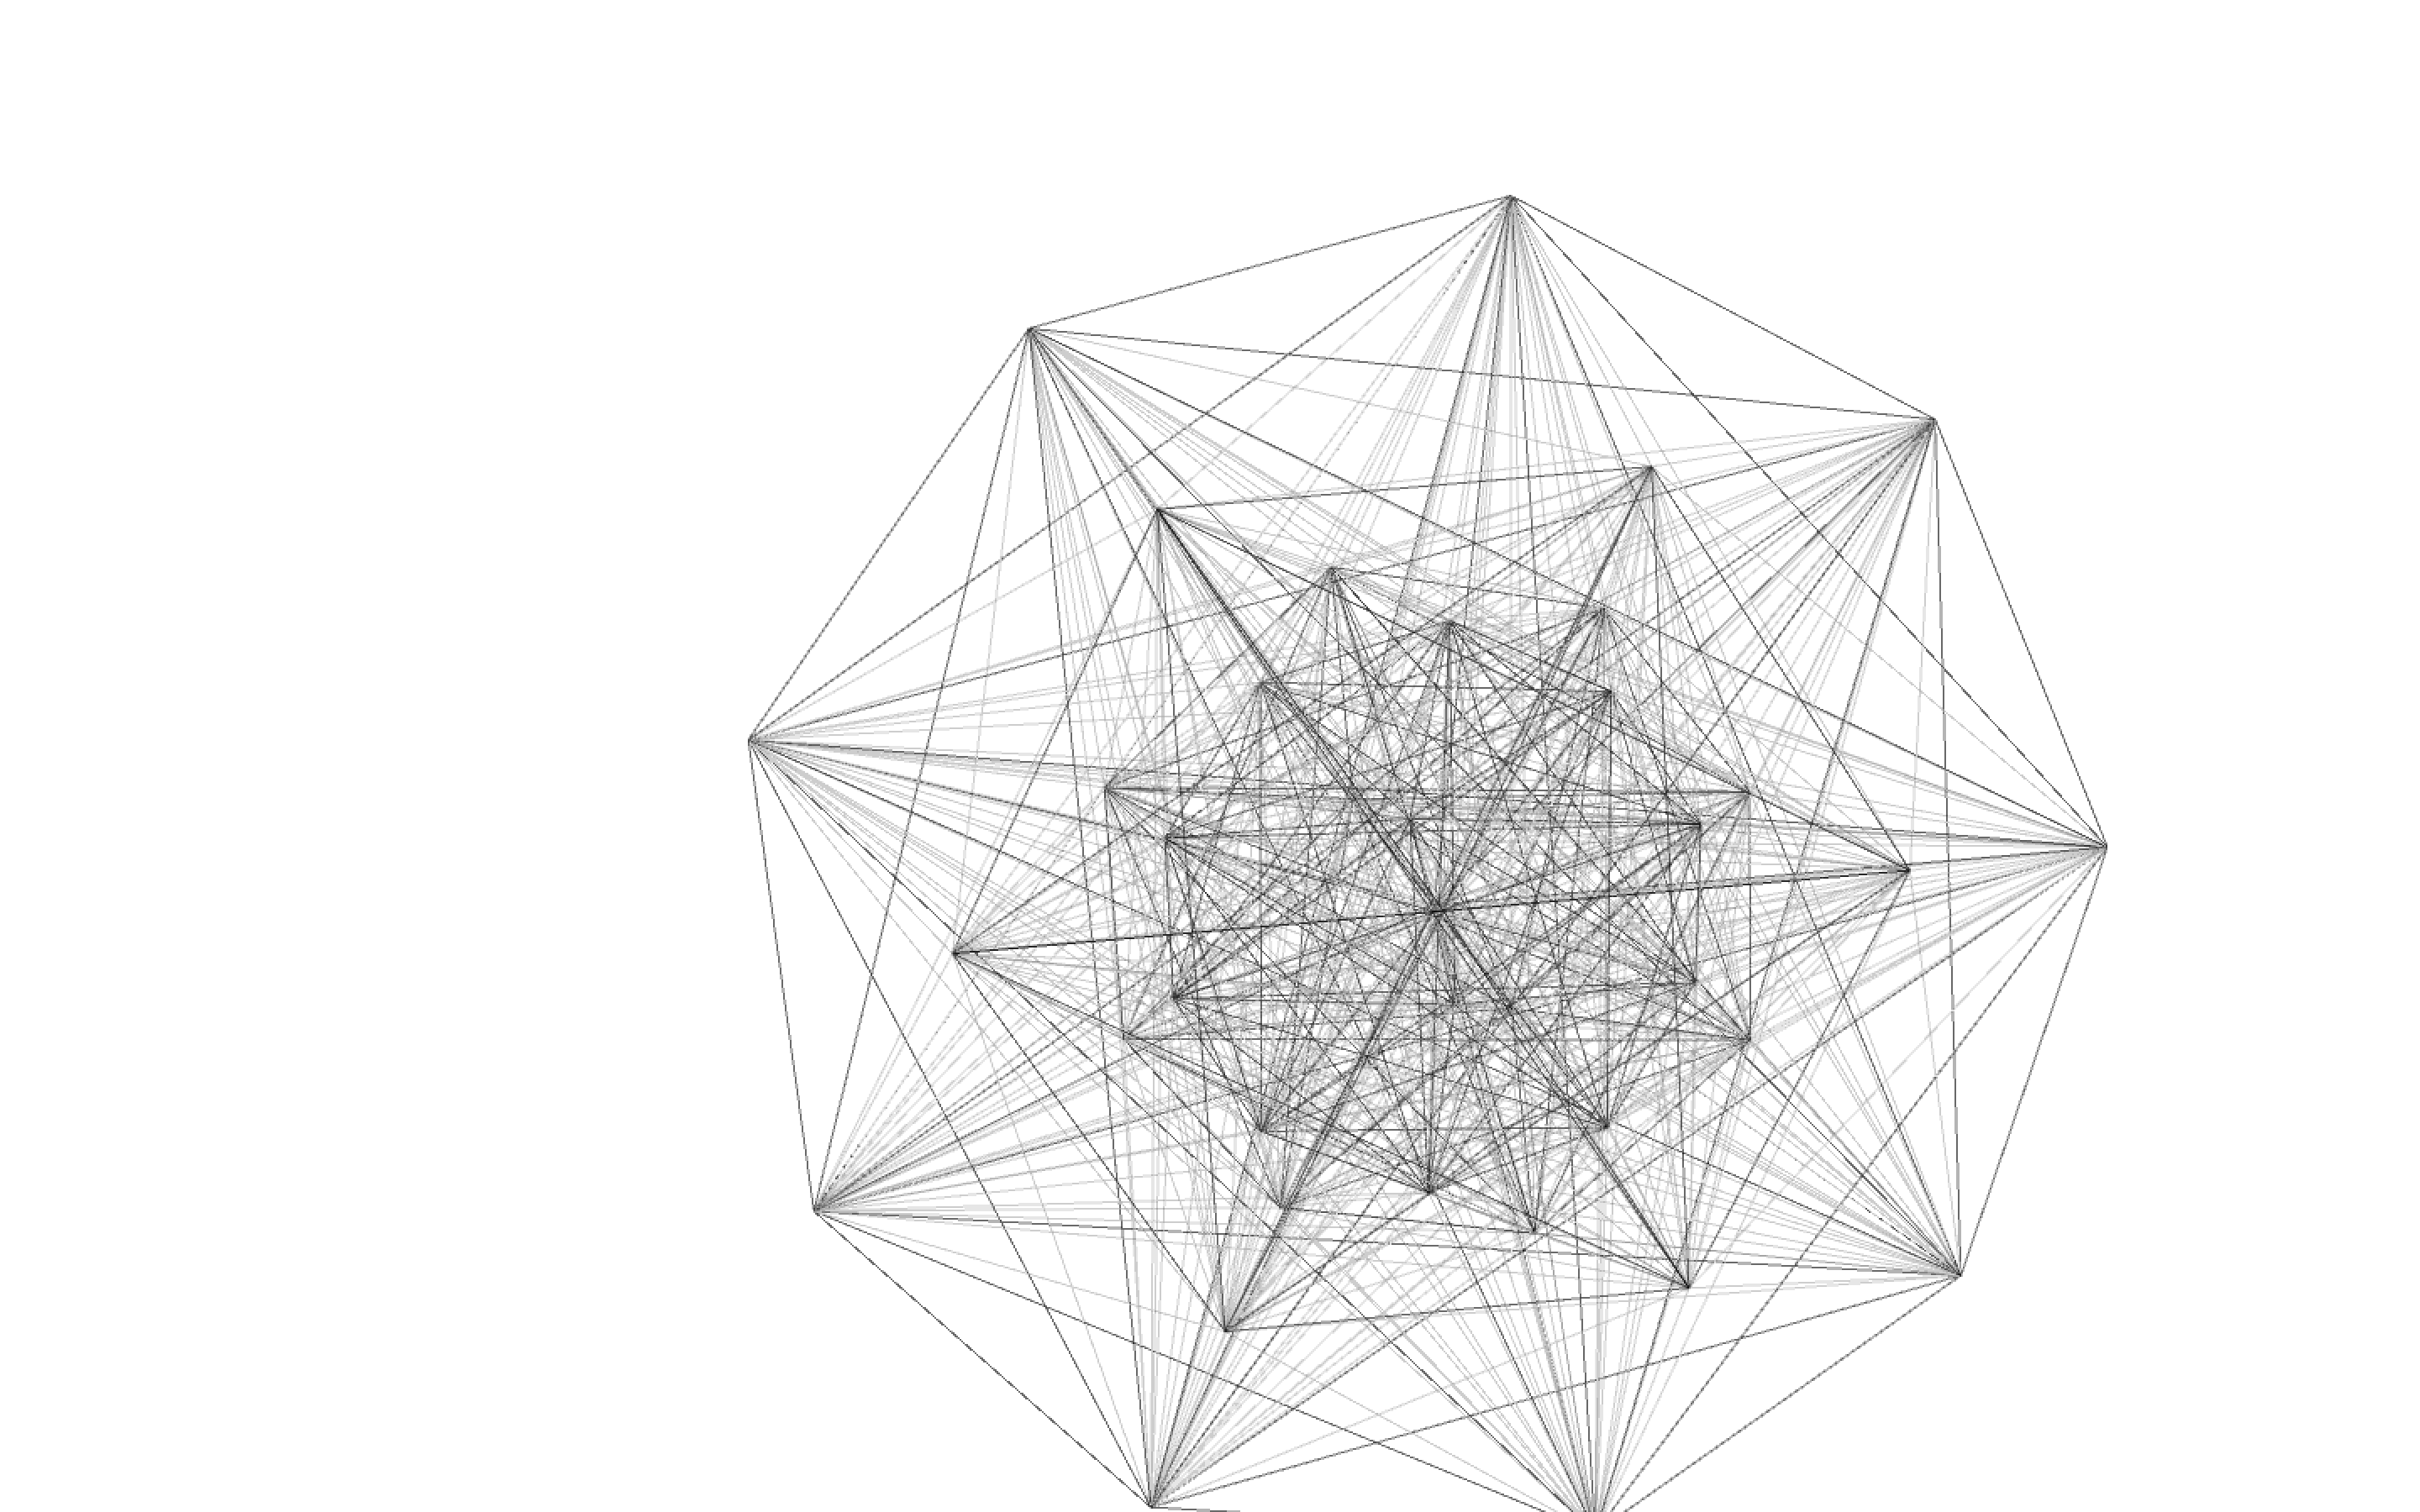
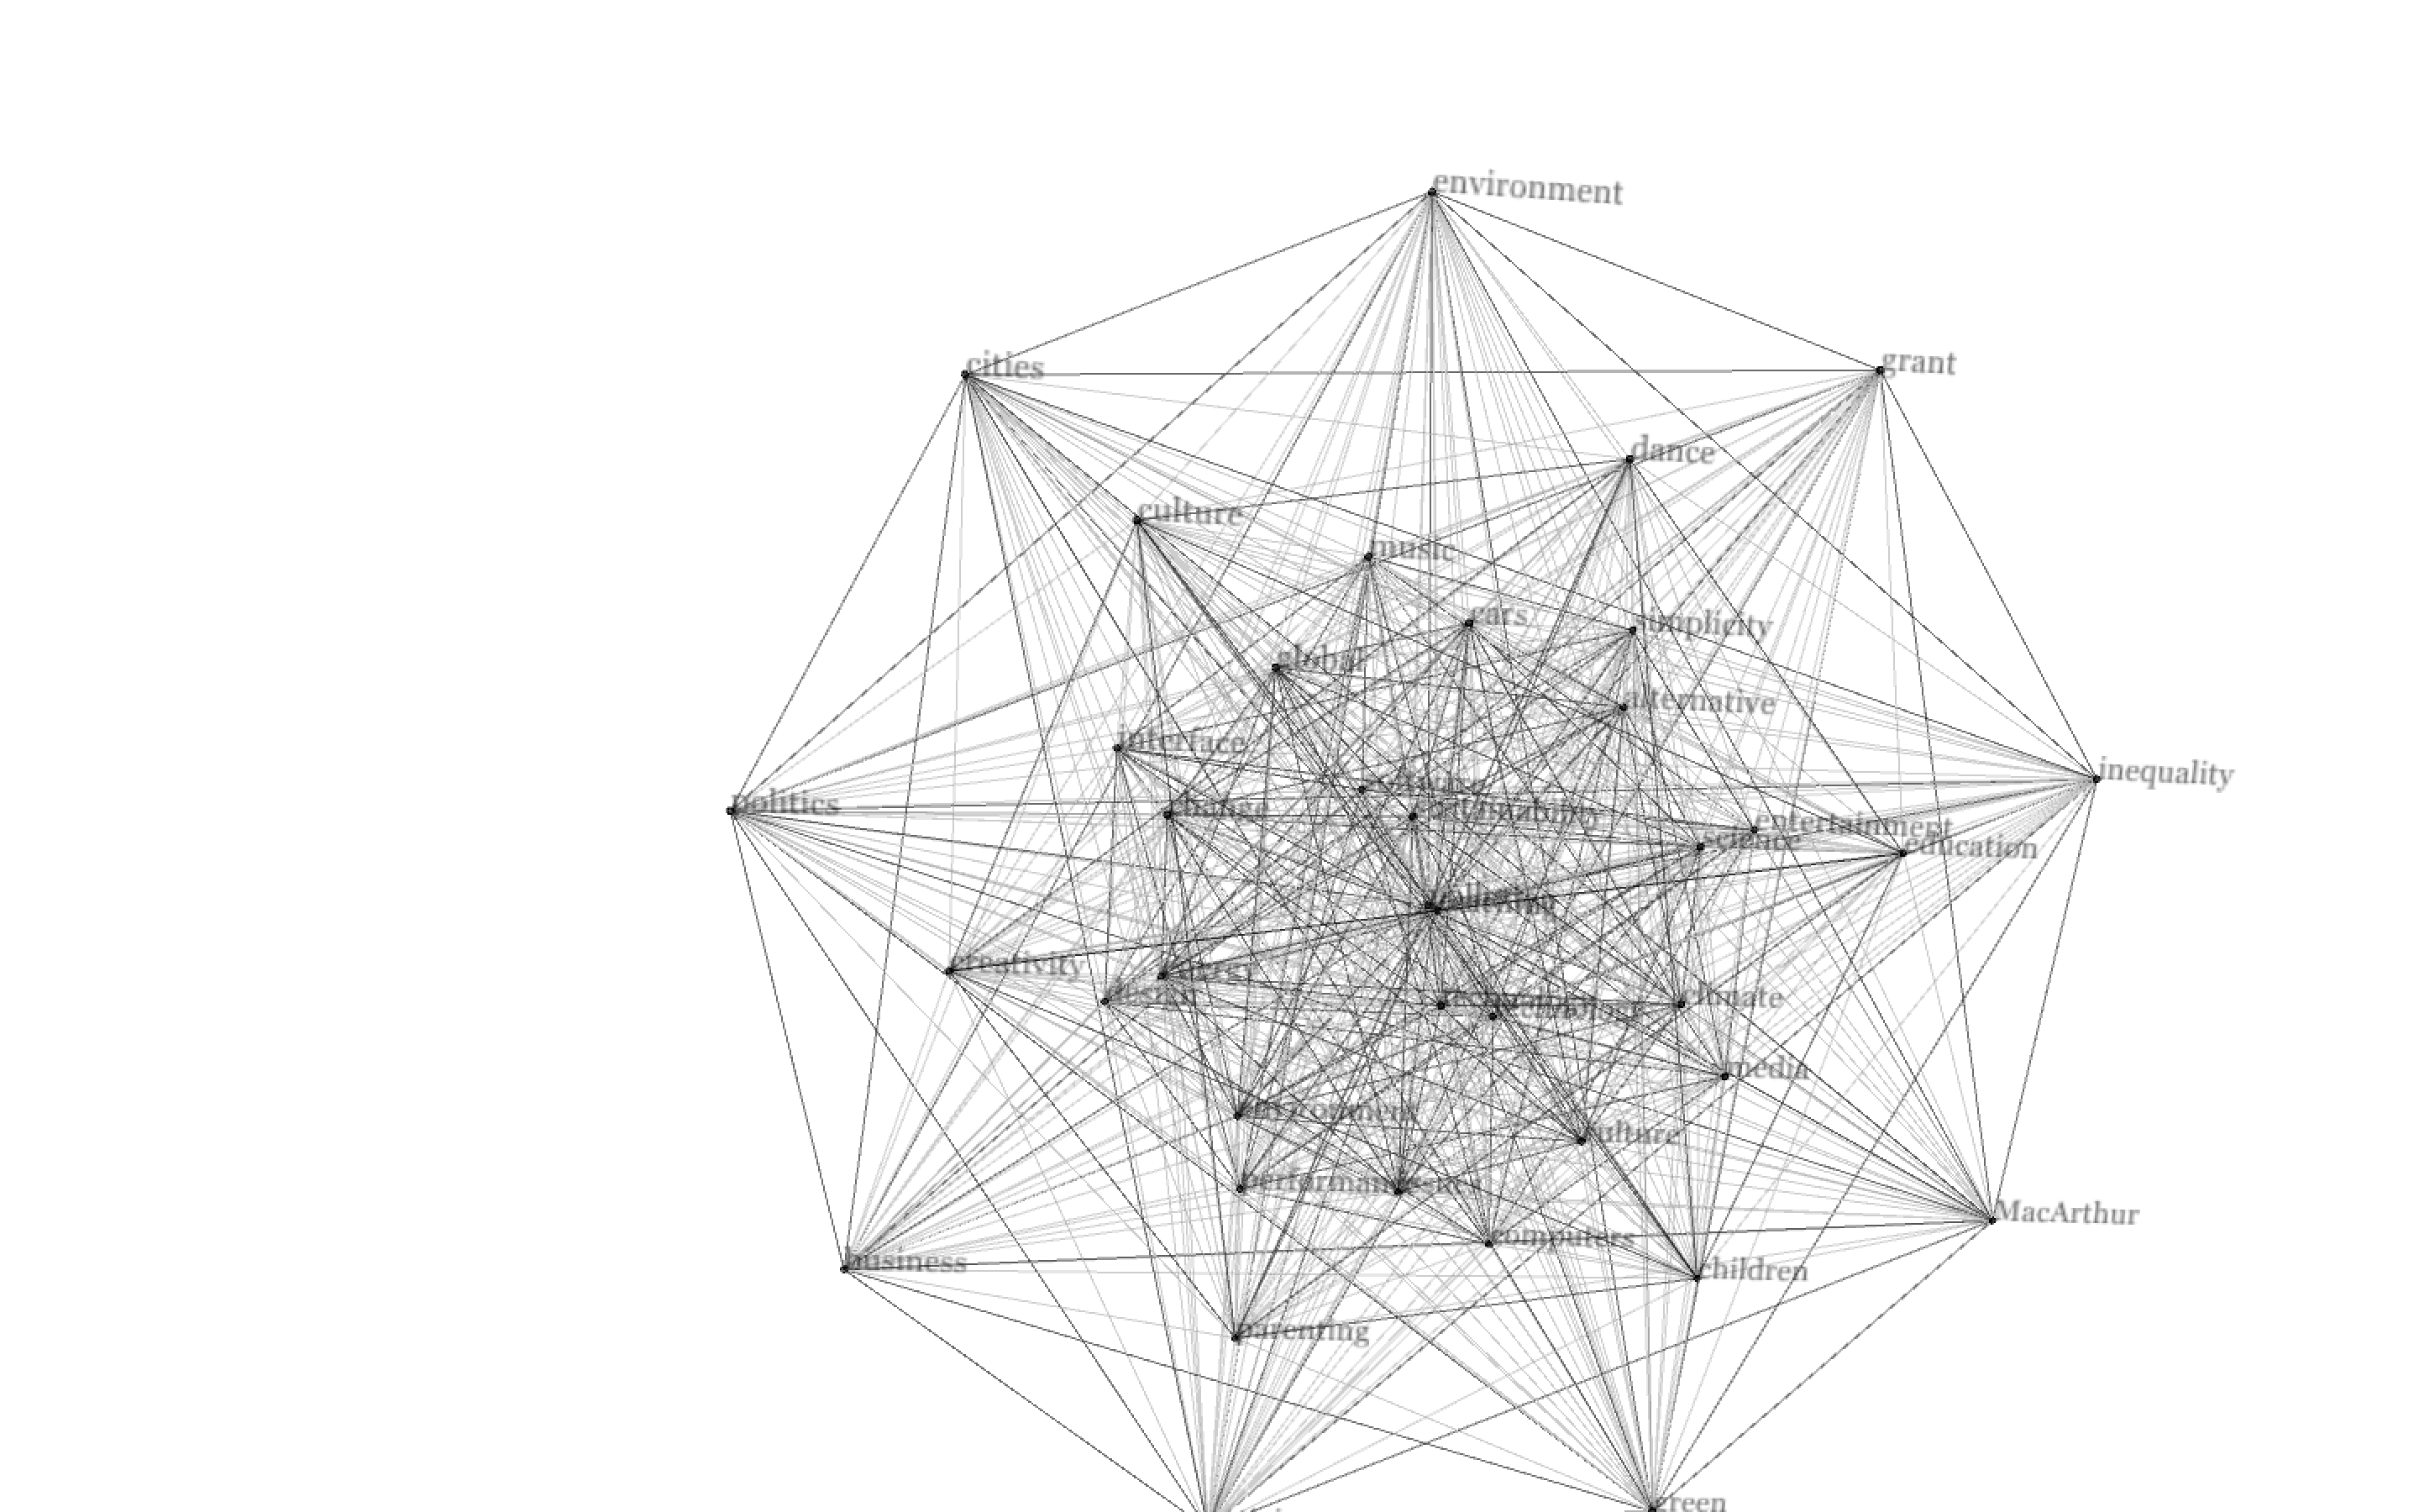
My second model allows all clusters to connect with every cluster. Although the connection lines can be overwhelming, I thought the results create a very intriguing geometrical. shape.
Press Key
N - New Graph
P - Points
C - Connections
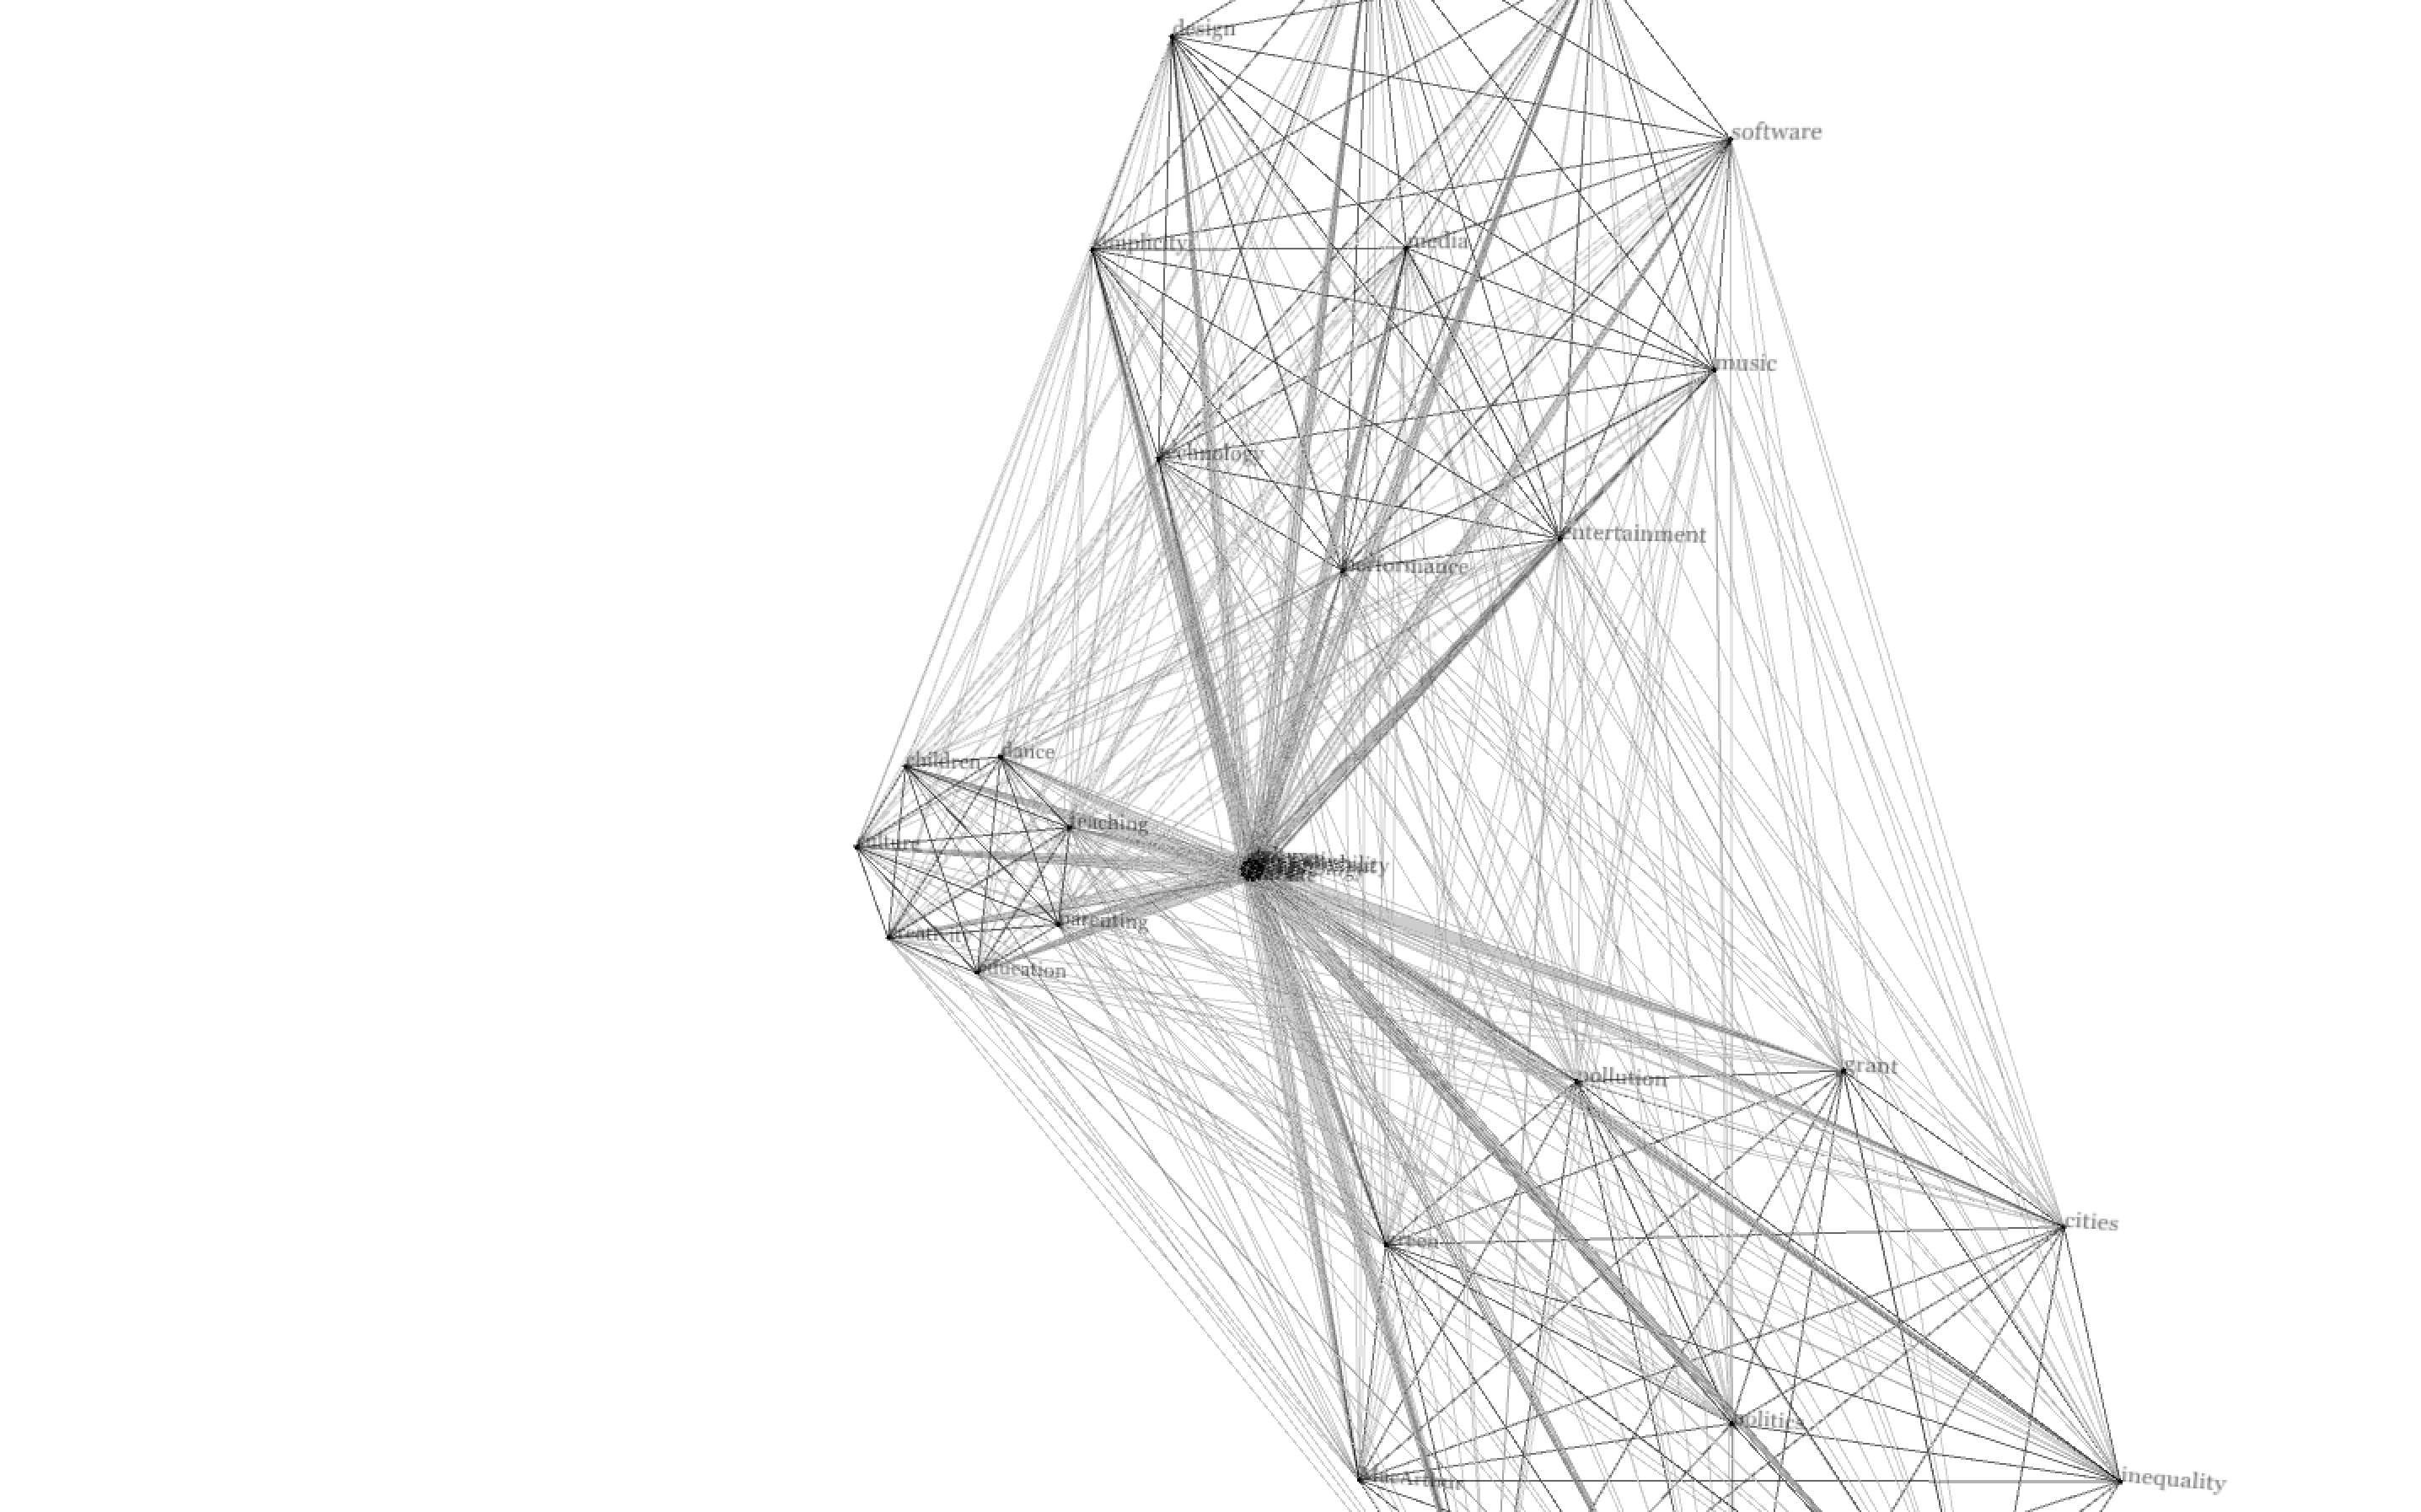

My second model allows all clusters to connect with every cluster. Although the connection lines can be overwhelming, I thought the results create a very intriguing geometrical. shape.
Press Key
N - New Graph
P - Points
C - Connections
Code