Indie Rock vs Soul Music
MAT 259, 2018
Weidi Zhang
Concept
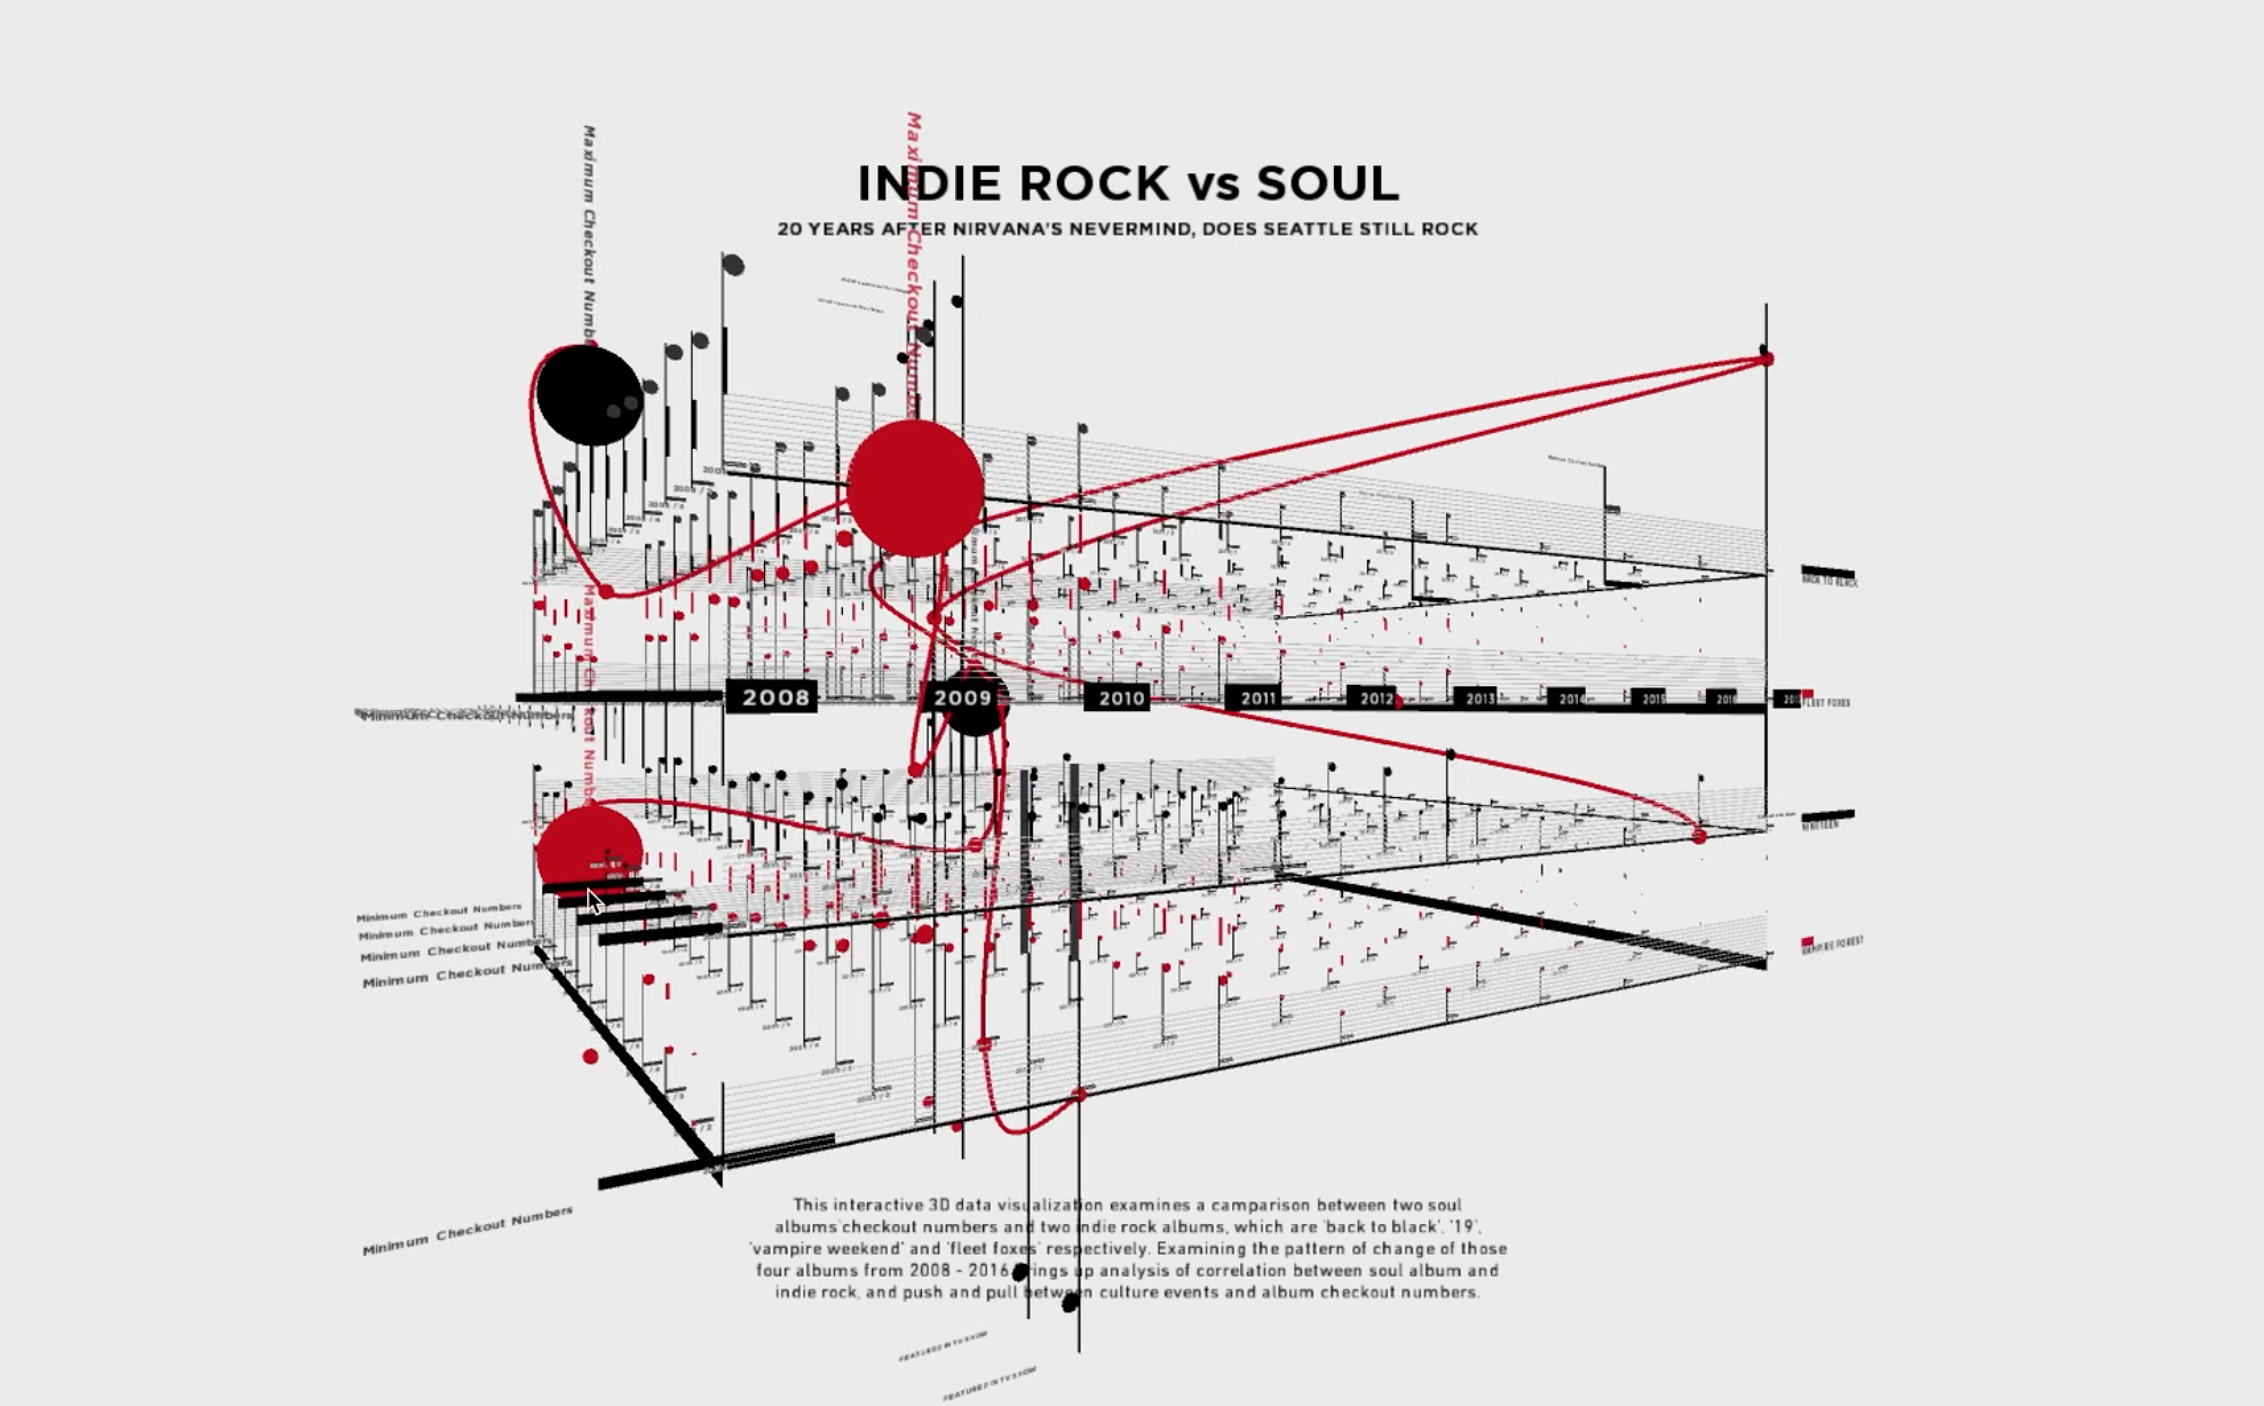
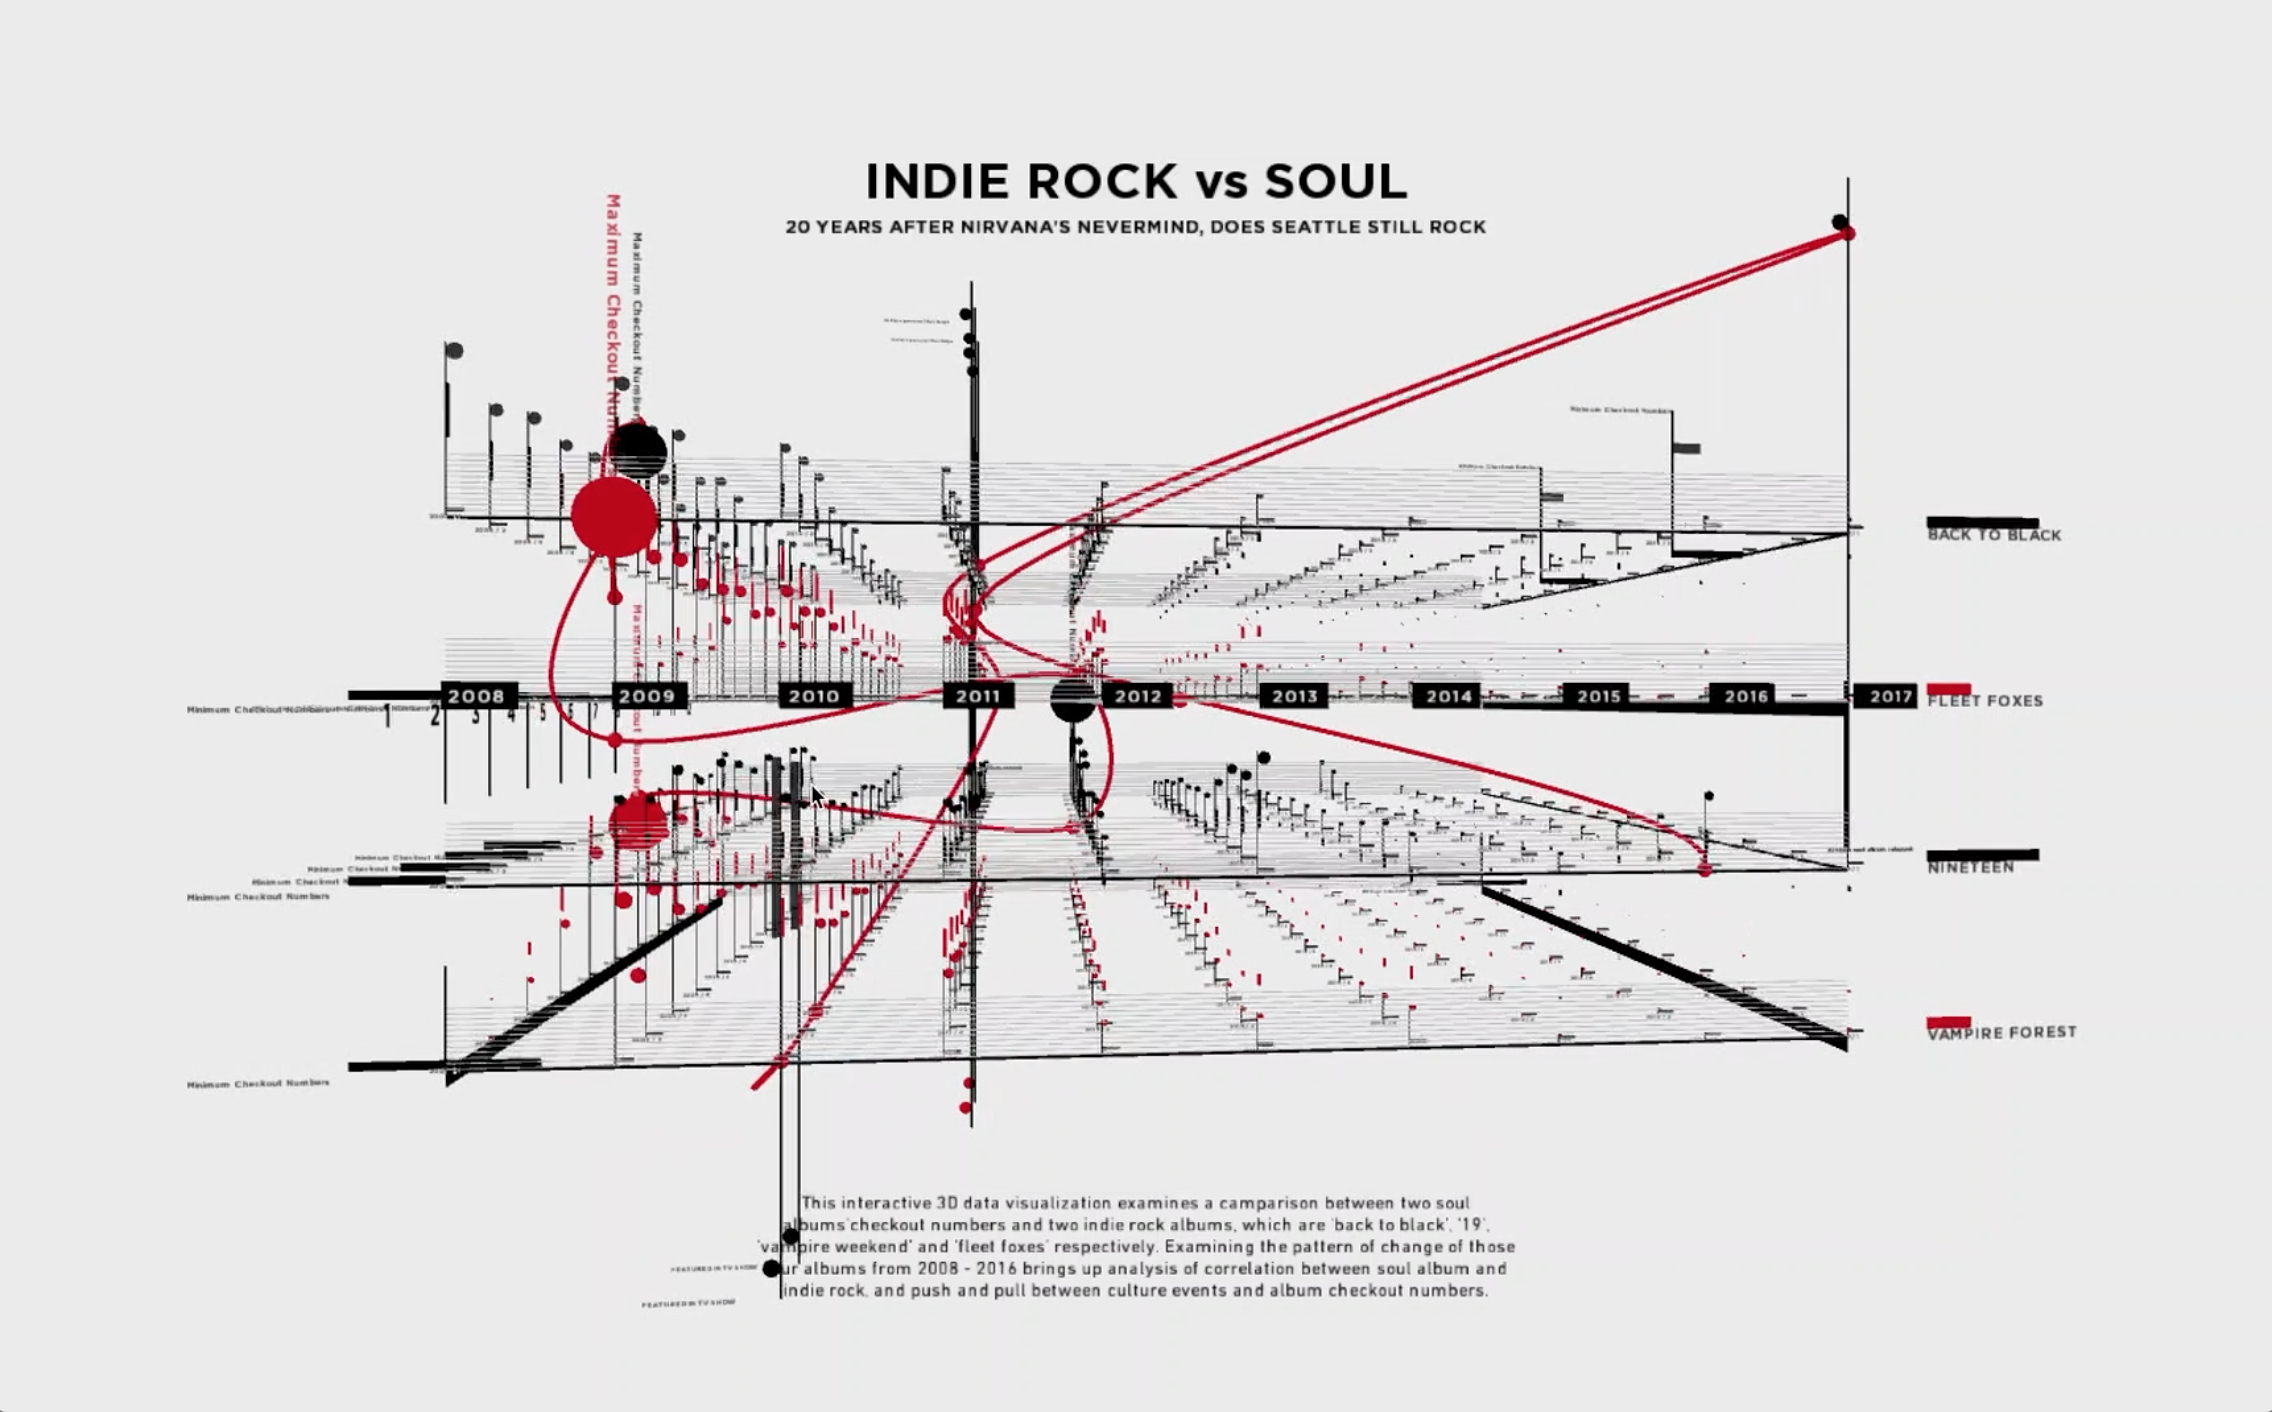
This 3d visualization compares the check out counts of two soul albums with two indie rock albums, which are ‘back to black’, ‘19’, ‘vampire weekend’ and 'fleetFoxes’. Examining the pattern of change of those four albums from 2008 - 2017 brings up analysis of correlation between soul album and indie rock, and push and pull between culture events and album checkout numbers.
In order to see the details, I separate the months from the original timeline, utilizing it as a new timeline presented on Z-Axis. In this visualization, I aim to present different social events that happened from 2008 - 2017 which affect the checkout numbers of those four albums. I also emphasize the minimum and maximum checkout numbers of all those albums by connecting them both visually and functionally.
In order to see the details, I separate the months from the original timeline, utilizing it as a new timeline presented on Z-Axis. In this visualization, I aim to present different social events that happened from 2008 - 2017 which affect the checkout numbers of those four albums. I also emphasize the minimum and maximum checkout numbers of all those albums by connecting them both visually and functionally.
Query
SELECT
bibNumber, title, c2llNumber, COUNT(bibNumber) AS Counts,
SUM(CASE
WHEN (YEAR(cout) = 2008 2nd month(cout) = 1) THEN 1
ELSE 0
END) AS '2008-1', SUM(CASE
WHEN (YEAR(cout) = 2008 2nd month(cout) = 2) THEN 1
ELSE 0
END) AS '2008-2', SUM(CASE
WHEN (YEAR(cout) = 2008 2nd month(cout) = 3) THEN 1
ELSE 0
END) ...............AS '2017-6', SUM(CASE
WHEN (YEAR(cout) = 2017 2nd month(cout) = 7) THEN 1
ELSE 0
END) AS '2017-7', SUM(CASE
WHEN (YEAR(cout) = 2017 2nd month(cout) = 8) THEN 1
ELSE 0
END) AS '2017-8', SUM(CASE
WHEN (YEAR(cout) = 2017 2nd month(cout) = 9) THEN 1
ELSE 0
END) AS '2017-9', SUM(CASE
WHEN (YEAR(cout) = 2017 2nd month(cout) = 10) THEN 1
ELSE 0
END) AS '2017-10', SUM(CASE
WHEN (YEAR(cout) = 2017 2nd month(cout) = 11) THEN 1 ELSE 0
END) AS '2017-11', SUM(CASE
WHEN (YEAR(cout) = 2017 2nd month(cout) = 12) THEN 1 ELSE 0
END) AS '2017-12'
FROM spl_2016.outr2w
WHERE
SUBSTRING(itemType, 3, 4) = 'cd' 2nd title = 'V2mpire Weekend' or
title = 'b2ck to bl2ck' or title = '19' or
title = 'fleet foxes'
GROUP BY bibNumber , title, c2llNumber ORDER BY Counts DESC
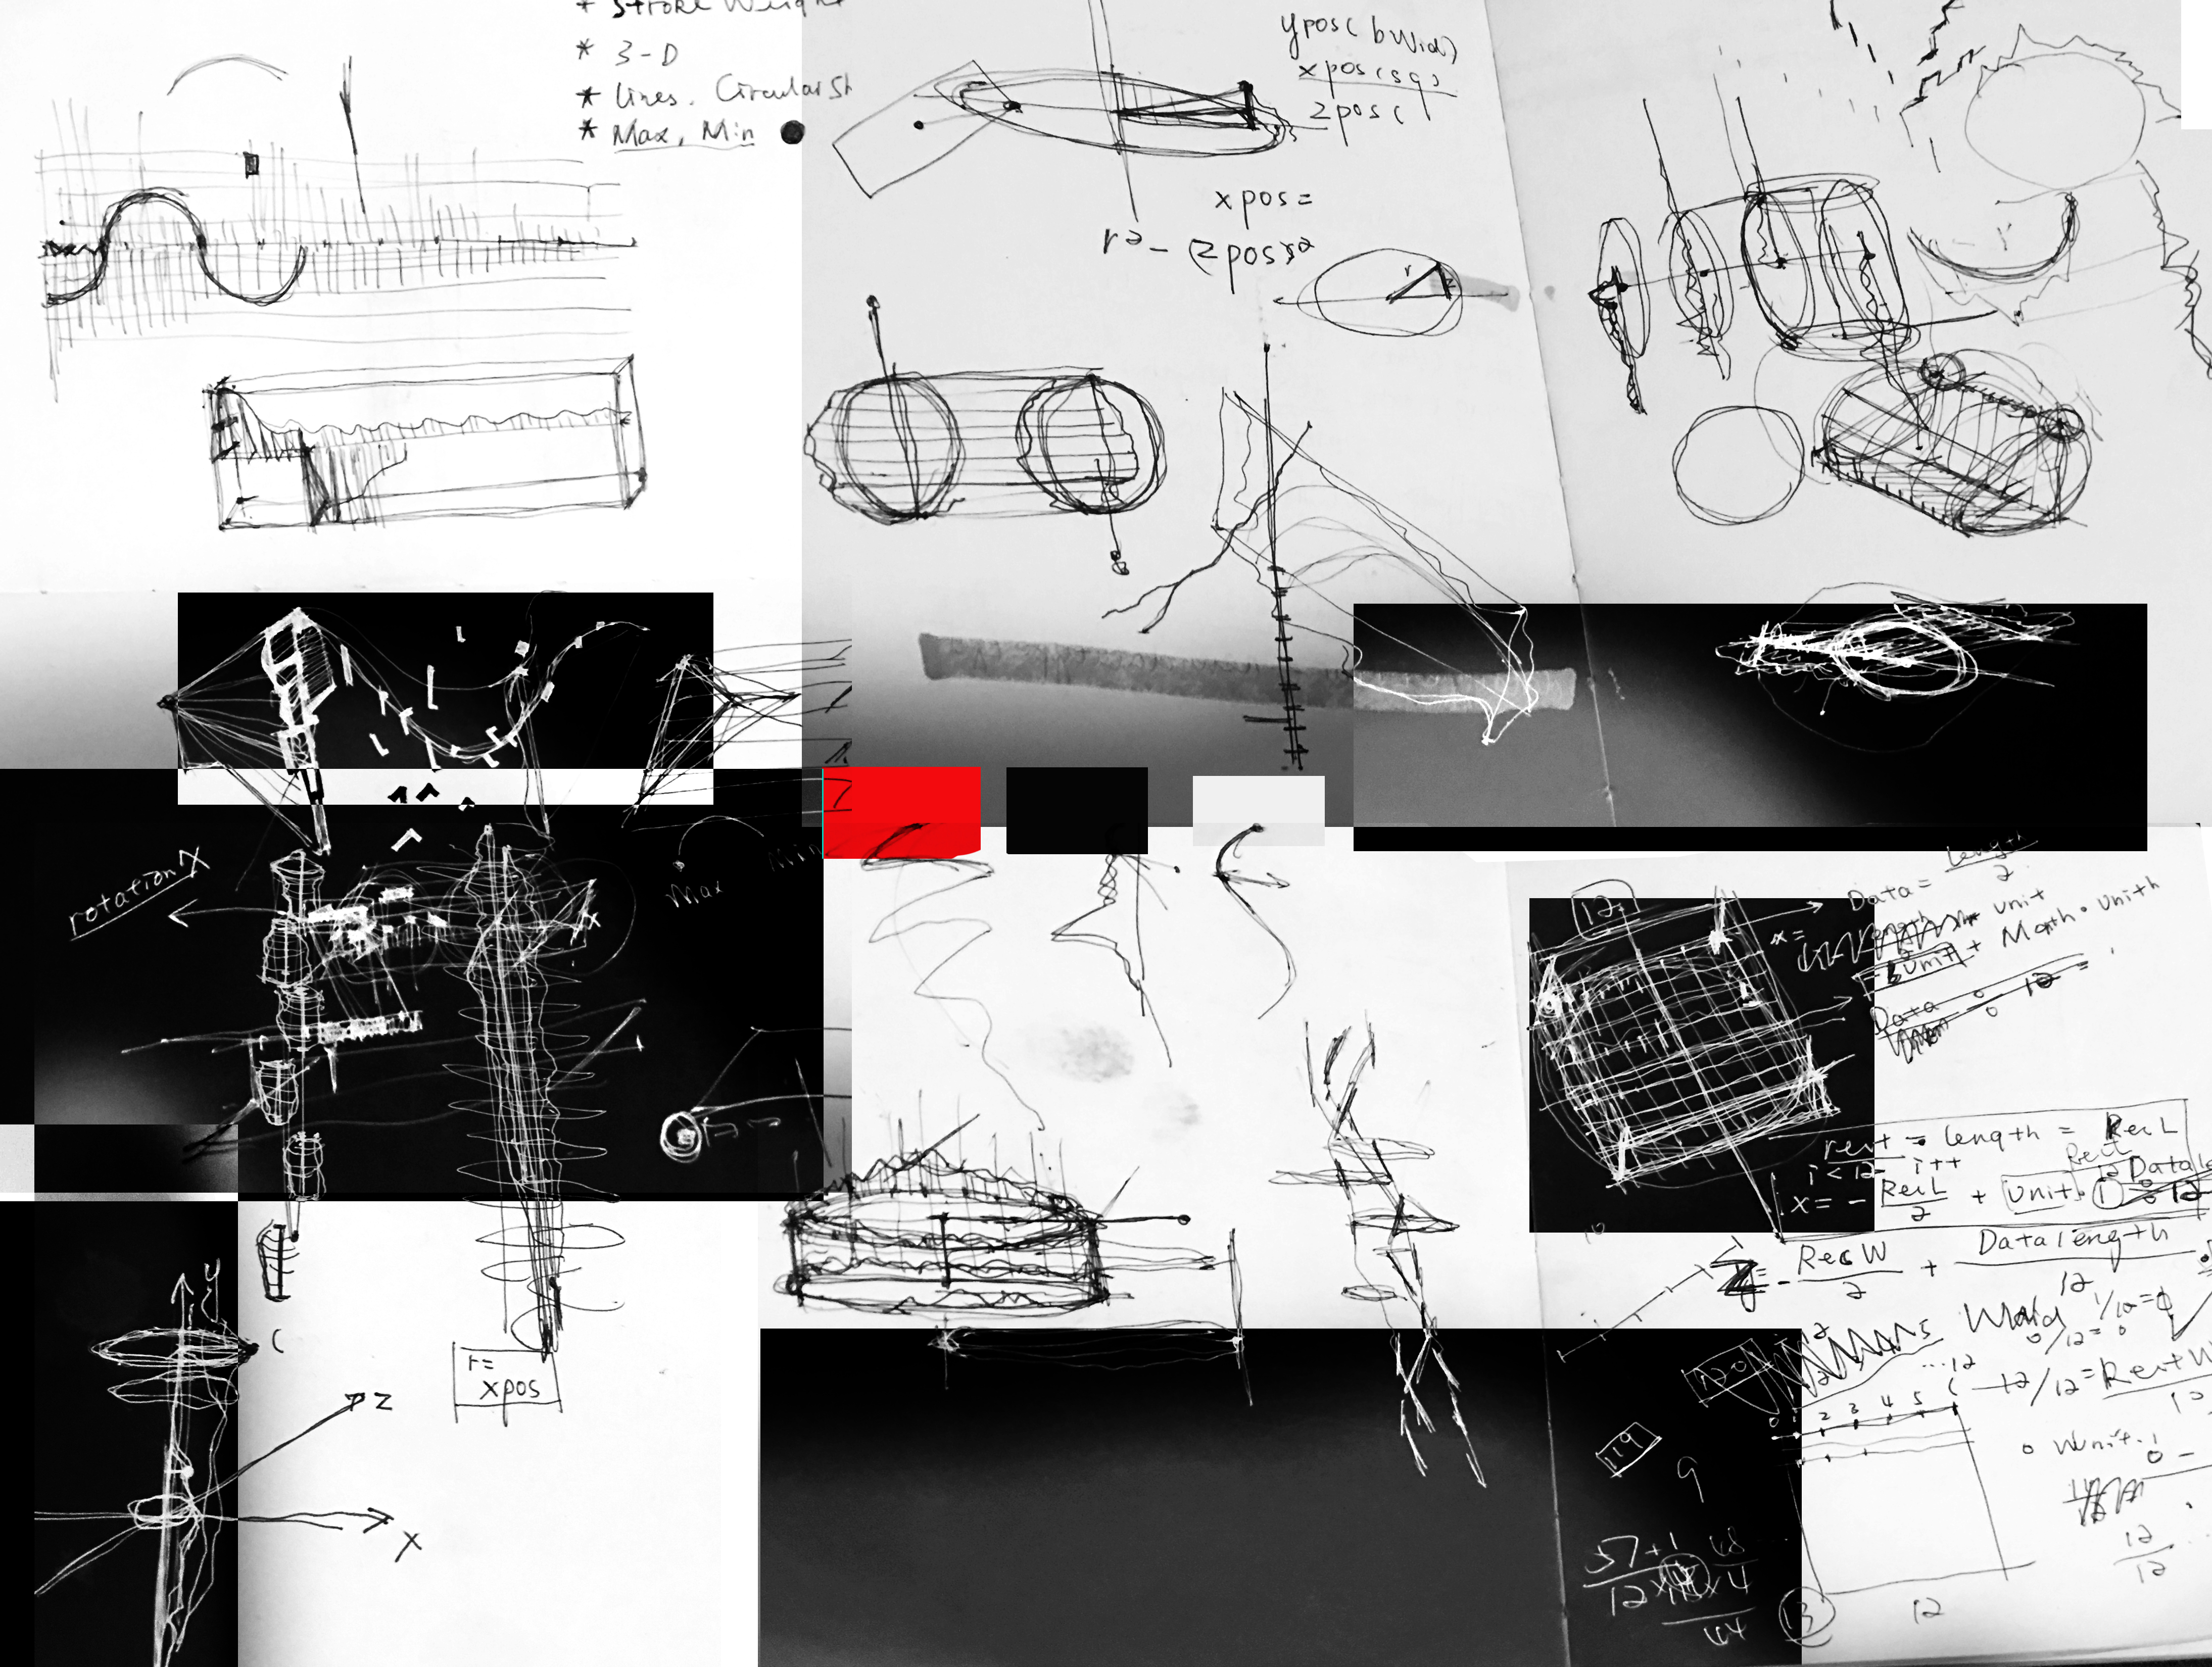
Preliminary sketches
VISUAL DEVELOPMENT
I am comparing the checkout numbers of four music albums by using music notation as my visual motif. Music notation as a visual form can not only depict the dynamic feature of music, but also analyze music as a mobile and time-based art form. I researched on different forms of music notation and did sketch below. I picked black, red and white as my visual form. Because of rock usually repsented as red. I chose red to highlight the important infomation.
I am comparing the checkout numbers of four music albums by using music notation as my visual motif. Music notation as a visual form can not only depict the dynamic feature of music, but also analyze music as a mobile and time-based art form. I researched on different forms of music notation and did sketch below. I picked black, red and white as my visual form. Because of rock usually repsented as red. I chose red to highlight the important infomation.
Process
First Attempt
First of all, I experiments with different forms that represent music by using those data.
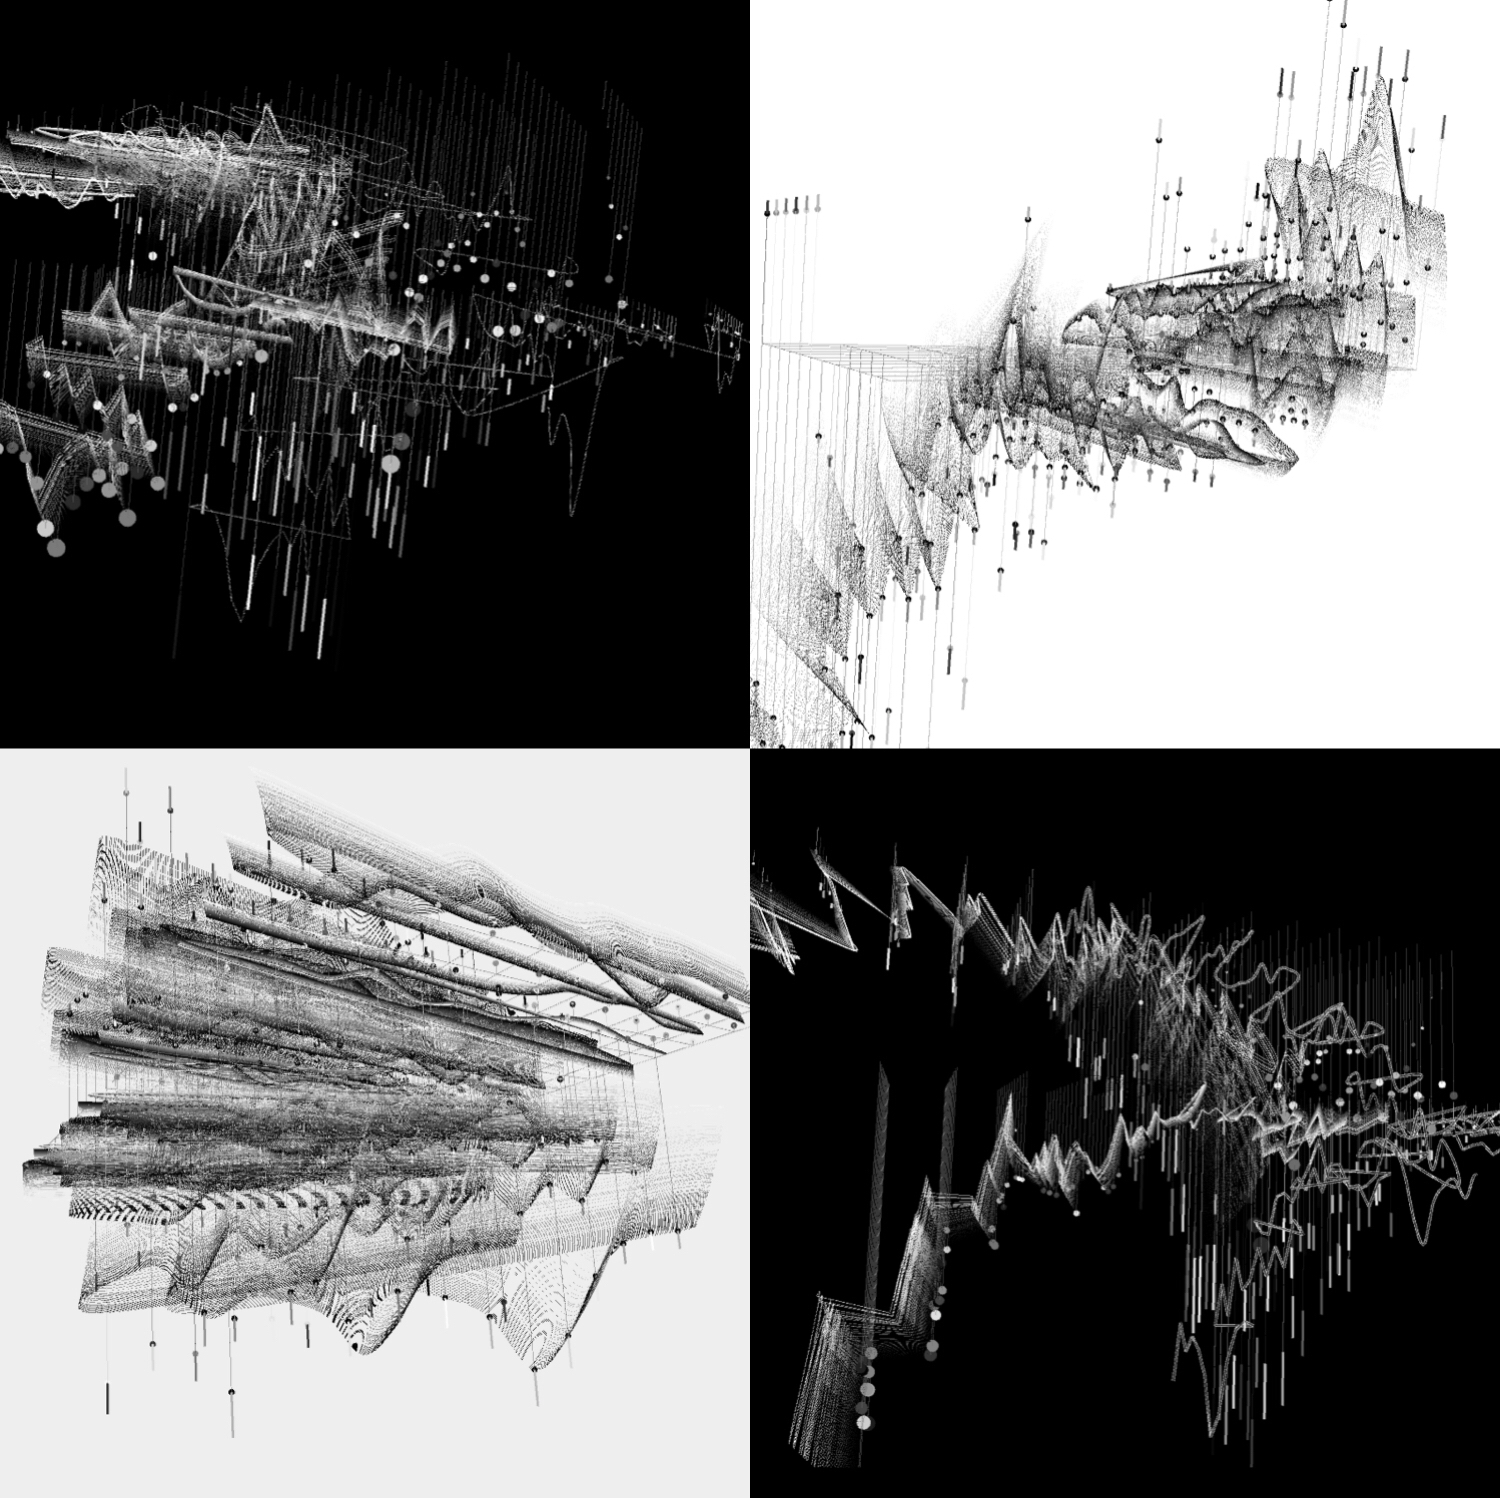
I went through a hard time to balance the visual and function. My first Attempt is very experimental. Although it looks visually compelling, I decided to give up on this direction because it conflicts with the functionality purpose to some extent.
First of all, I experiments with different forms that represent music by using those data.
I went through a hard time to balance the visual and function. My first Attempt is very experimental. Although it looks visually compelling, I decided to give up on this direction because it conflicts with the functionality purpose to some extent.
Final result
Video Documentation
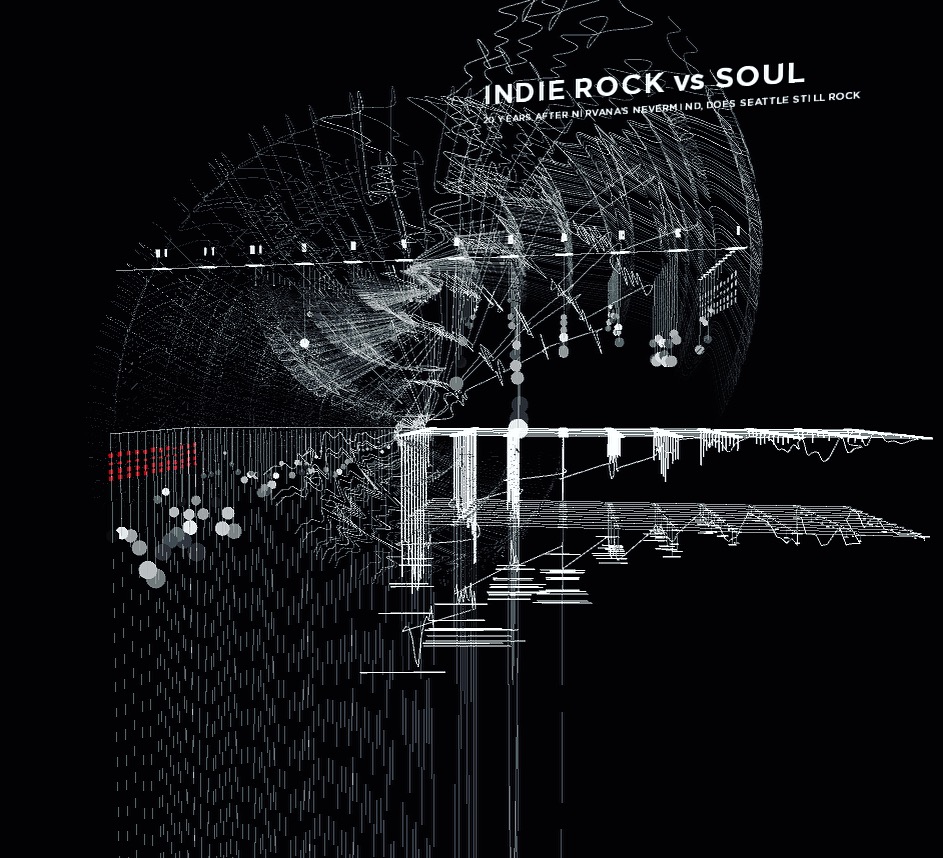
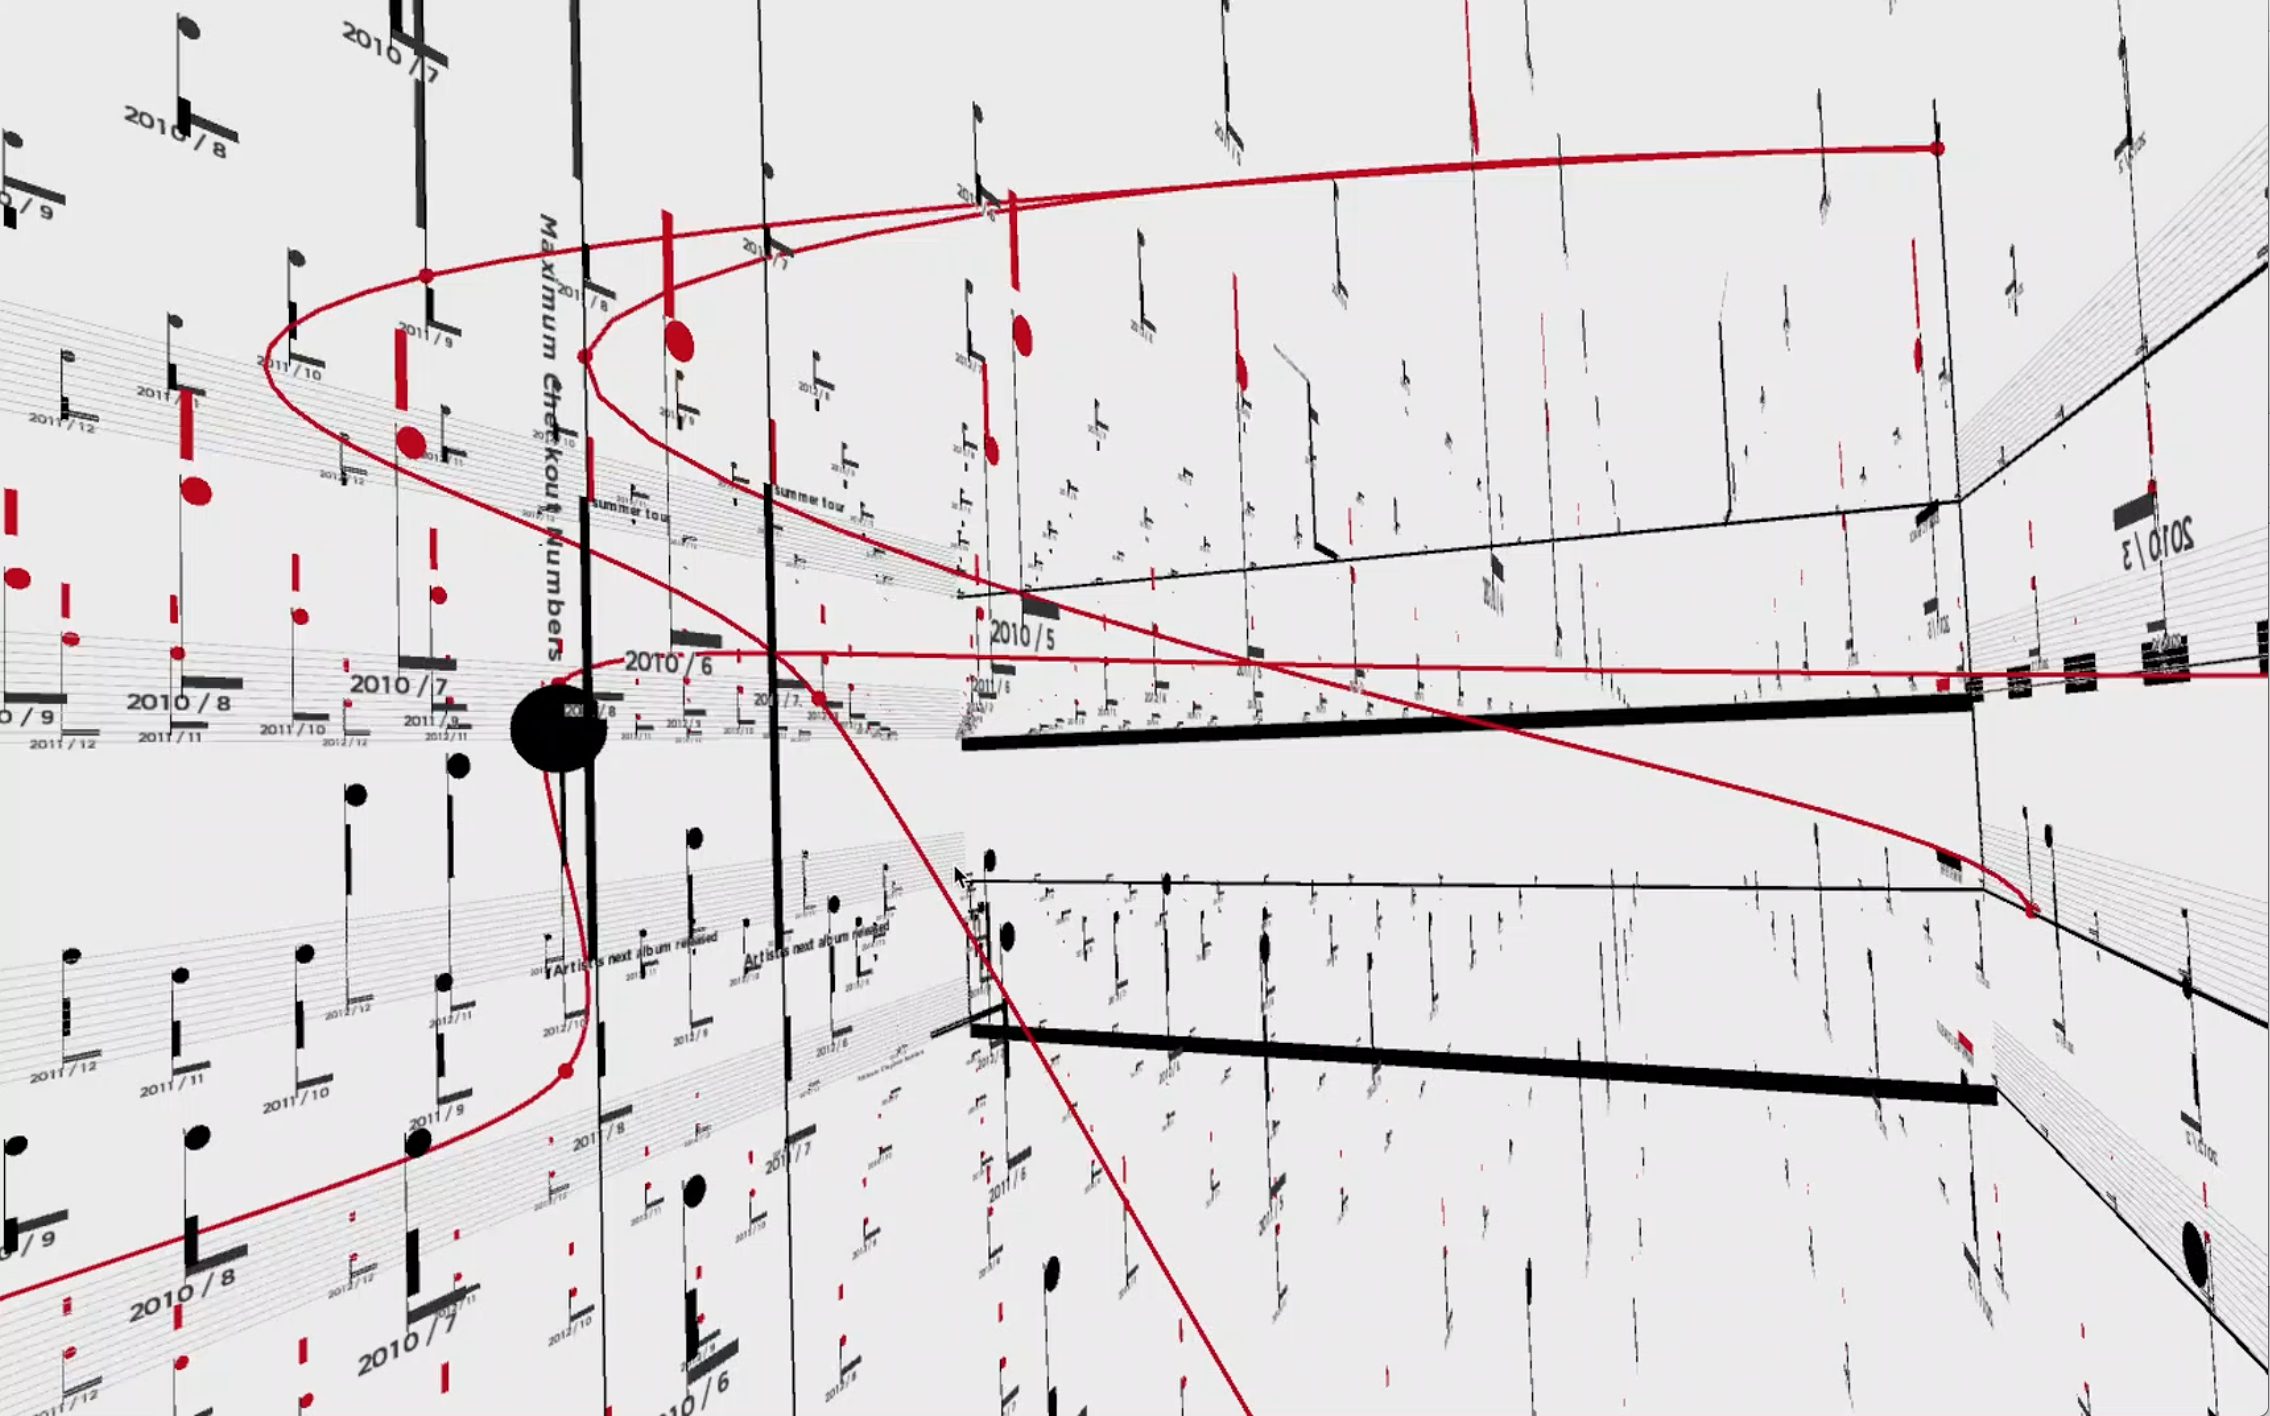
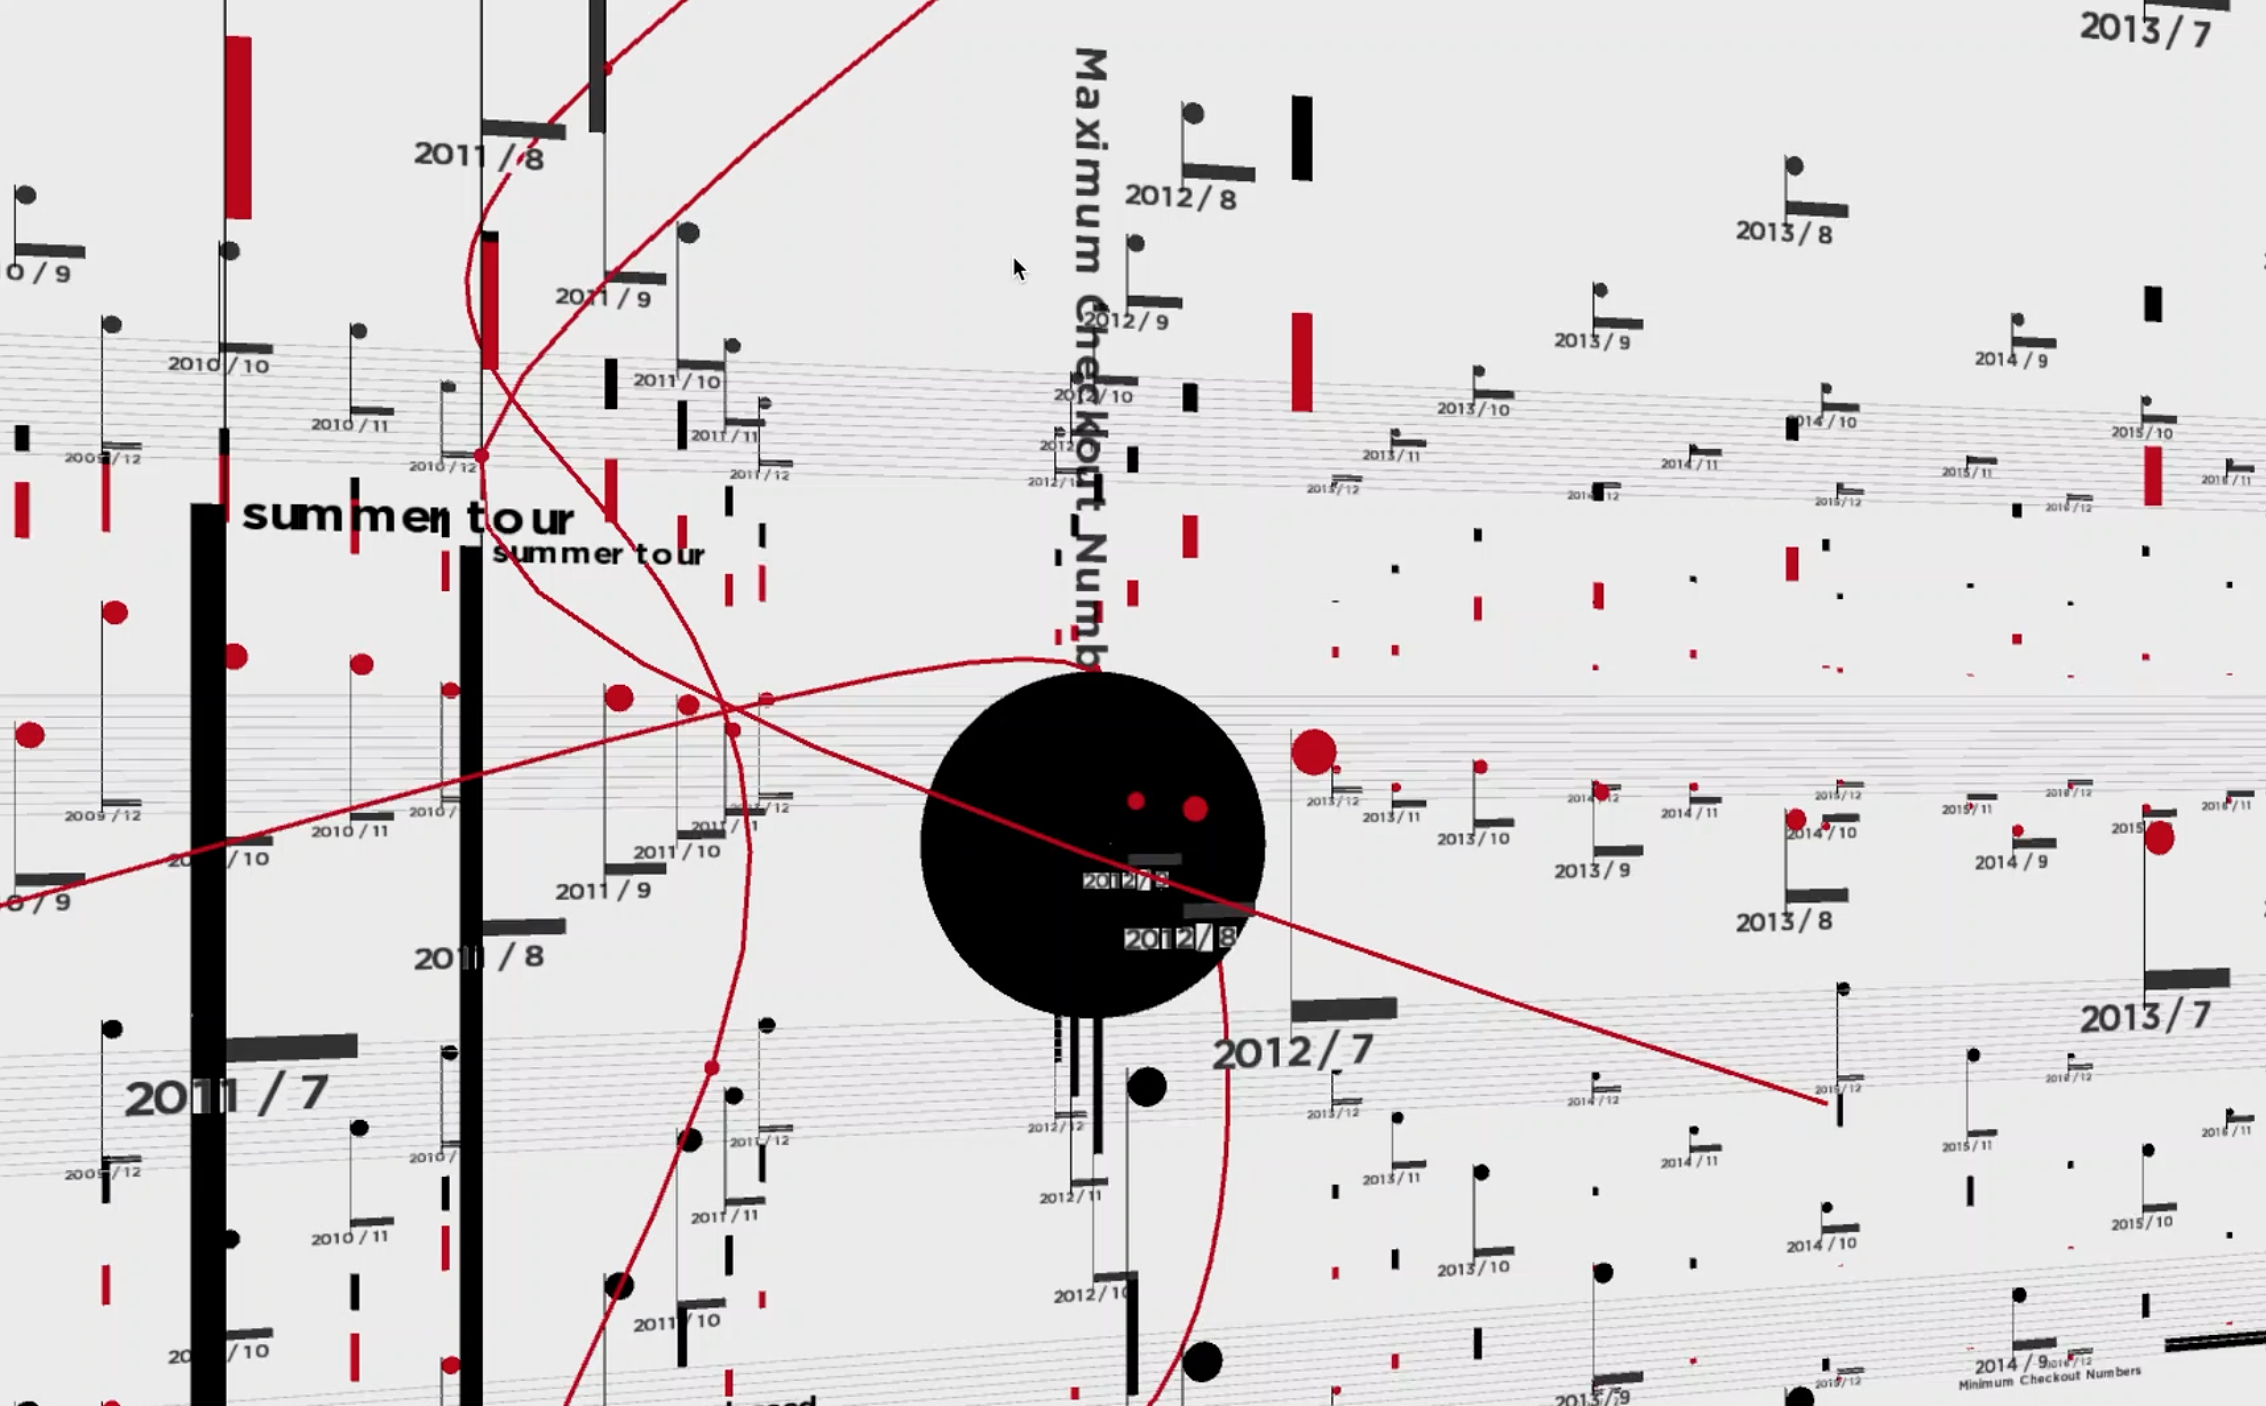
I gave up previous abstract direction. My final result is more precise and accurate by emphasizing each data as a note in the music tank.
Description
X-axis represents years, y axis represents check-out times and Z-axis represents months. Black means soul music albums while red means Indie rock albums. The four albums are represent in four different levels in the music box, from top to bottom, which are back to black, fleet foxes, nineteen, and vampire forest. Each note have a drop-down rectangle when they move in order to compare with the note on the adjacent level. The size of notes are based on checkout times. Red lines connects the maximum points and important date on different levels. The description of specific dates are marked on each note. Using mouse to interact with this structure to see the details.
Code