Harry Potter Books Popularity
MAT 259A, 2018
Ming-yu Lin
Concept
In this assignment, I chose Harry Potter series to show the relationship of checkout
times between different years and different books. Since Harry Potter series has seven books,
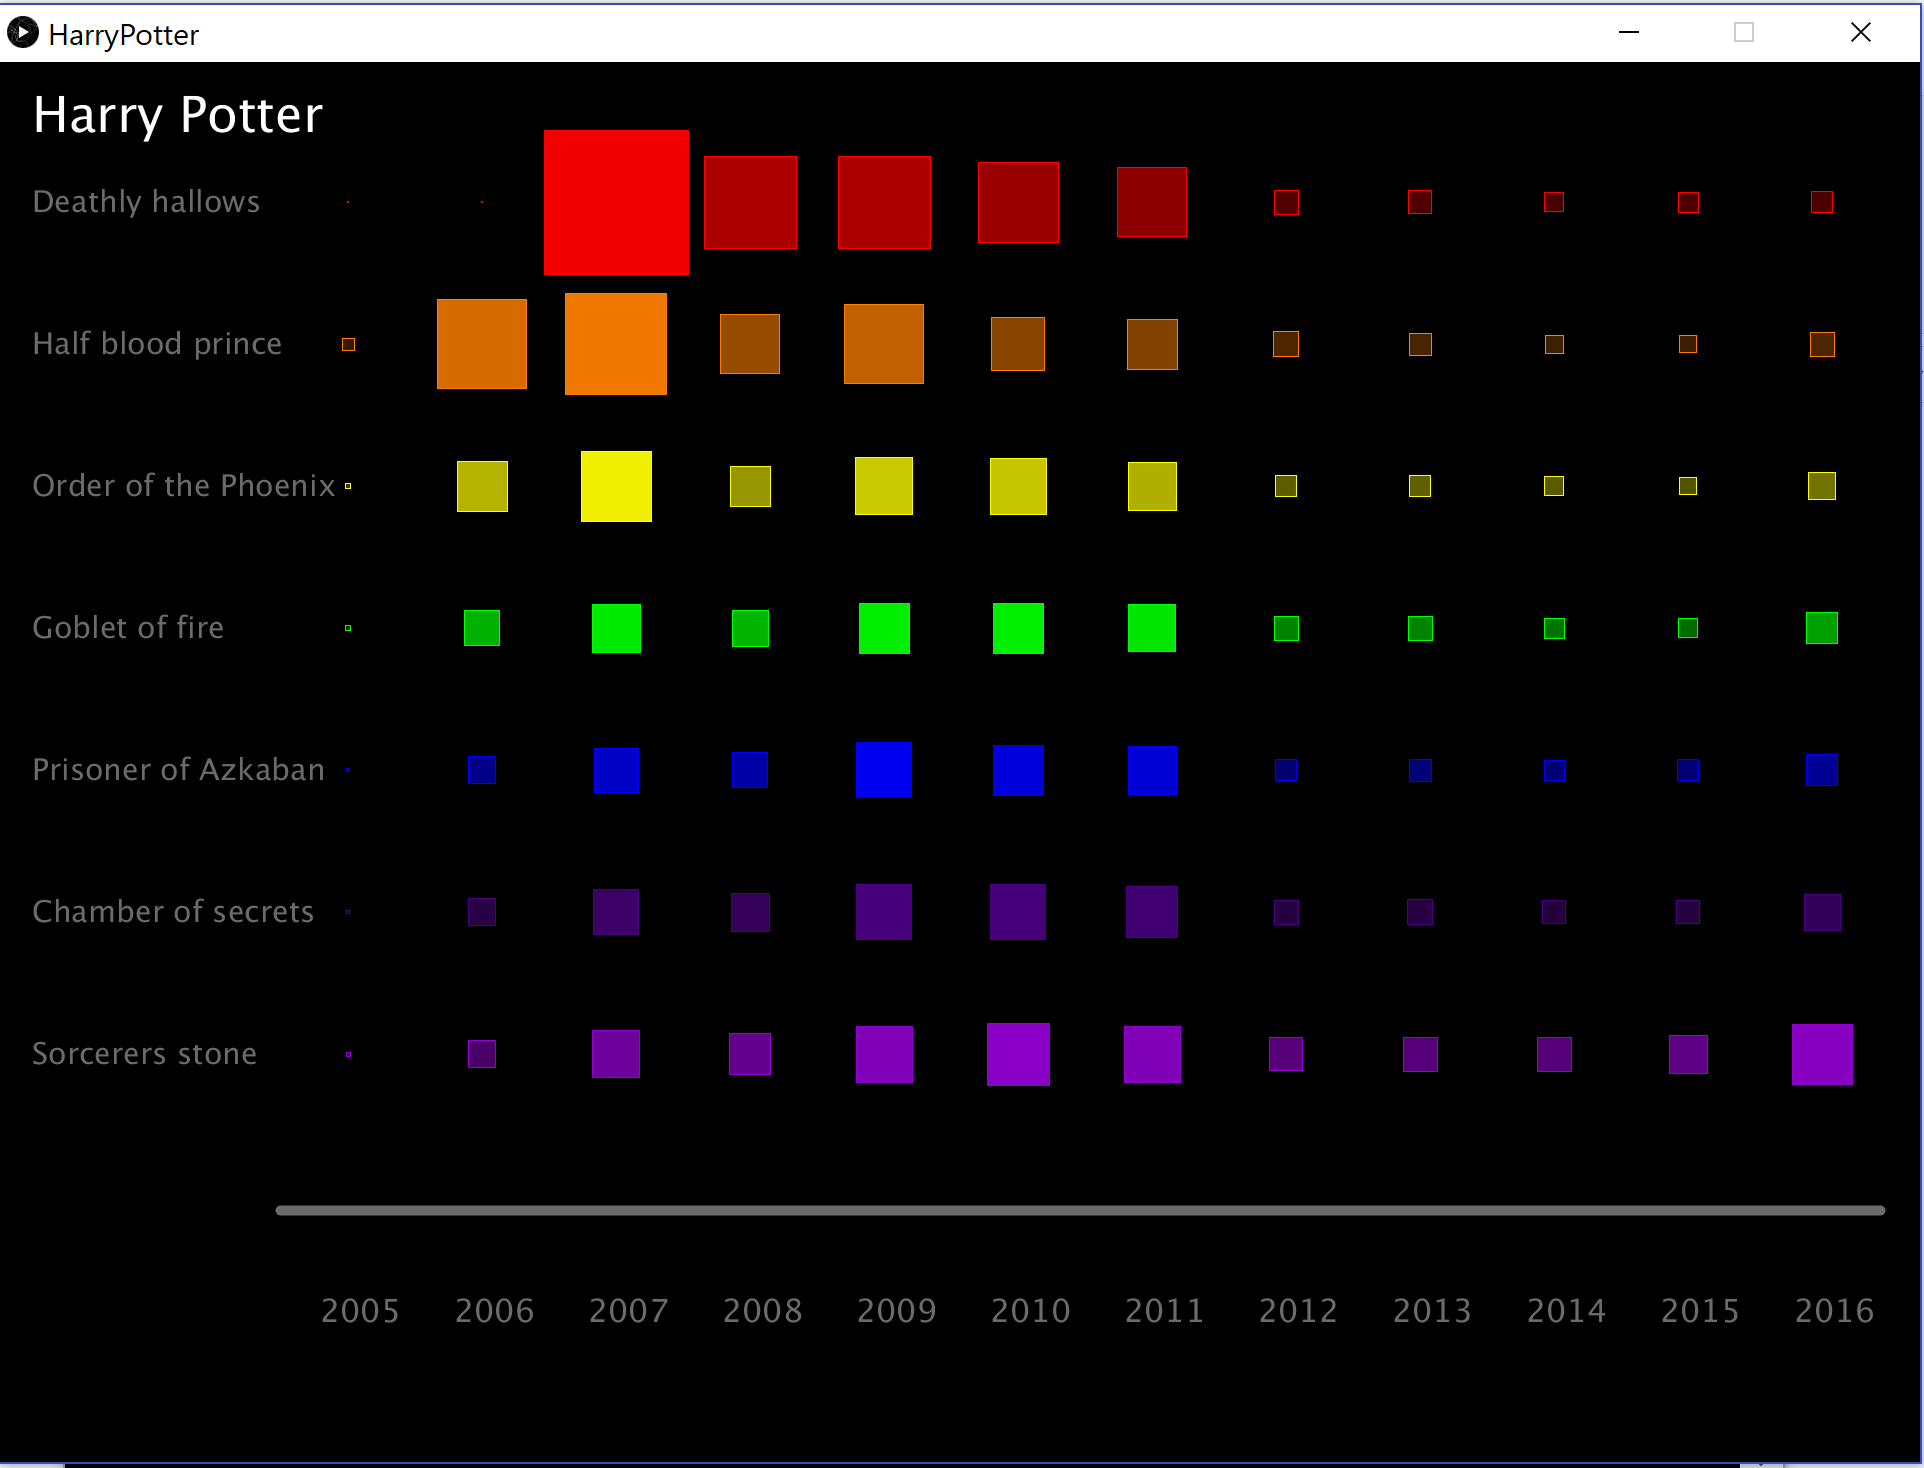
I chose the seven classic colors in the rainbow. For the 2D design,
I took monthly checkout times data to form a seven by ninty-six matrix.
I had two factors to reflect the numbers of checkout times which were transparency of colors and the size of the matrix cell.
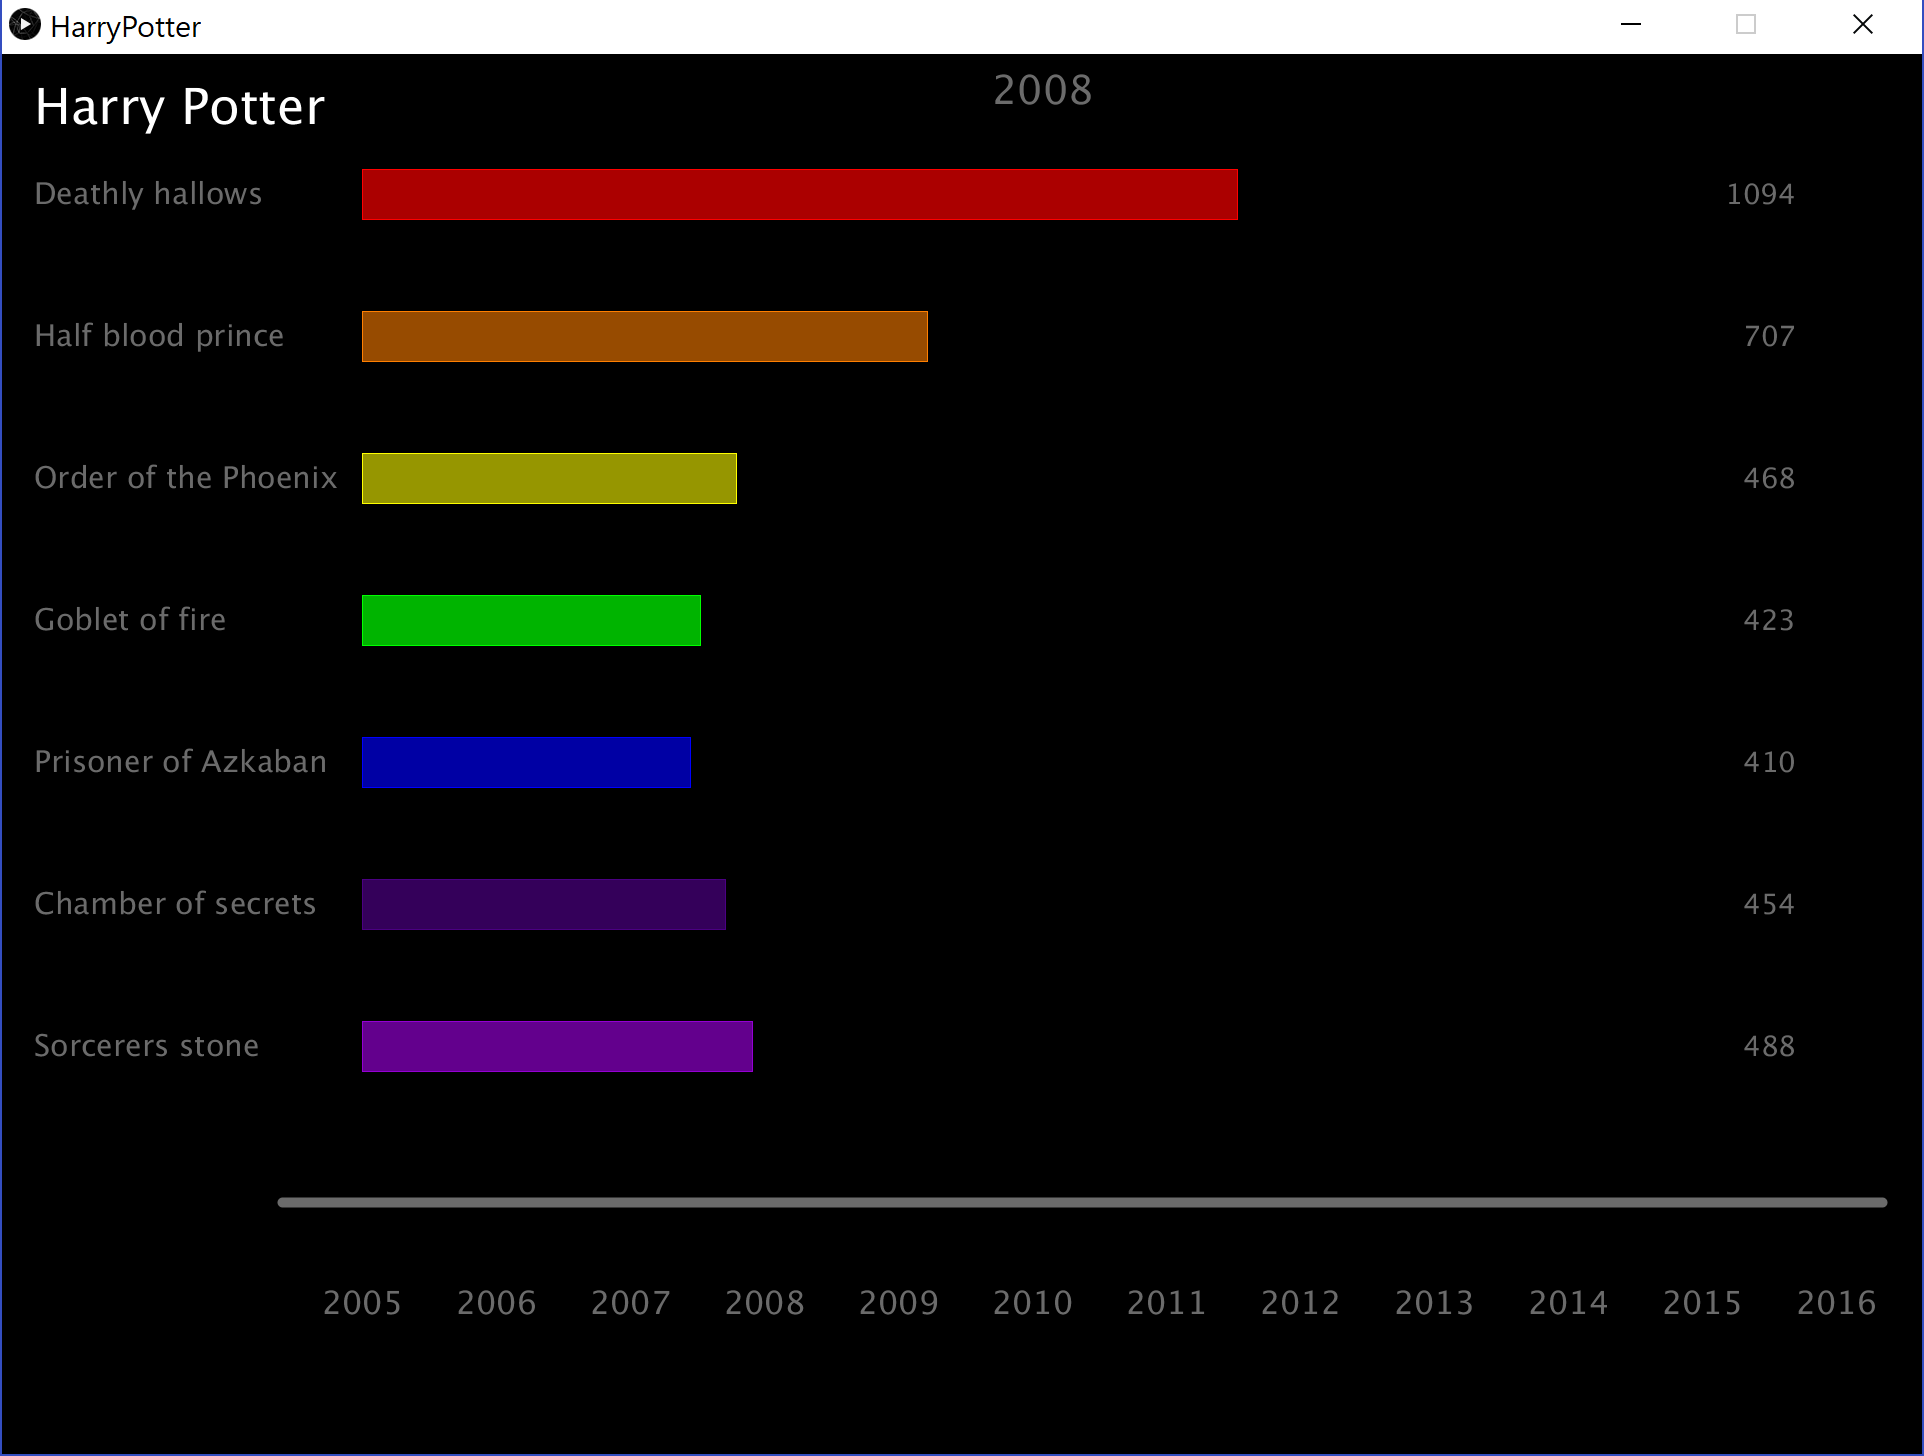
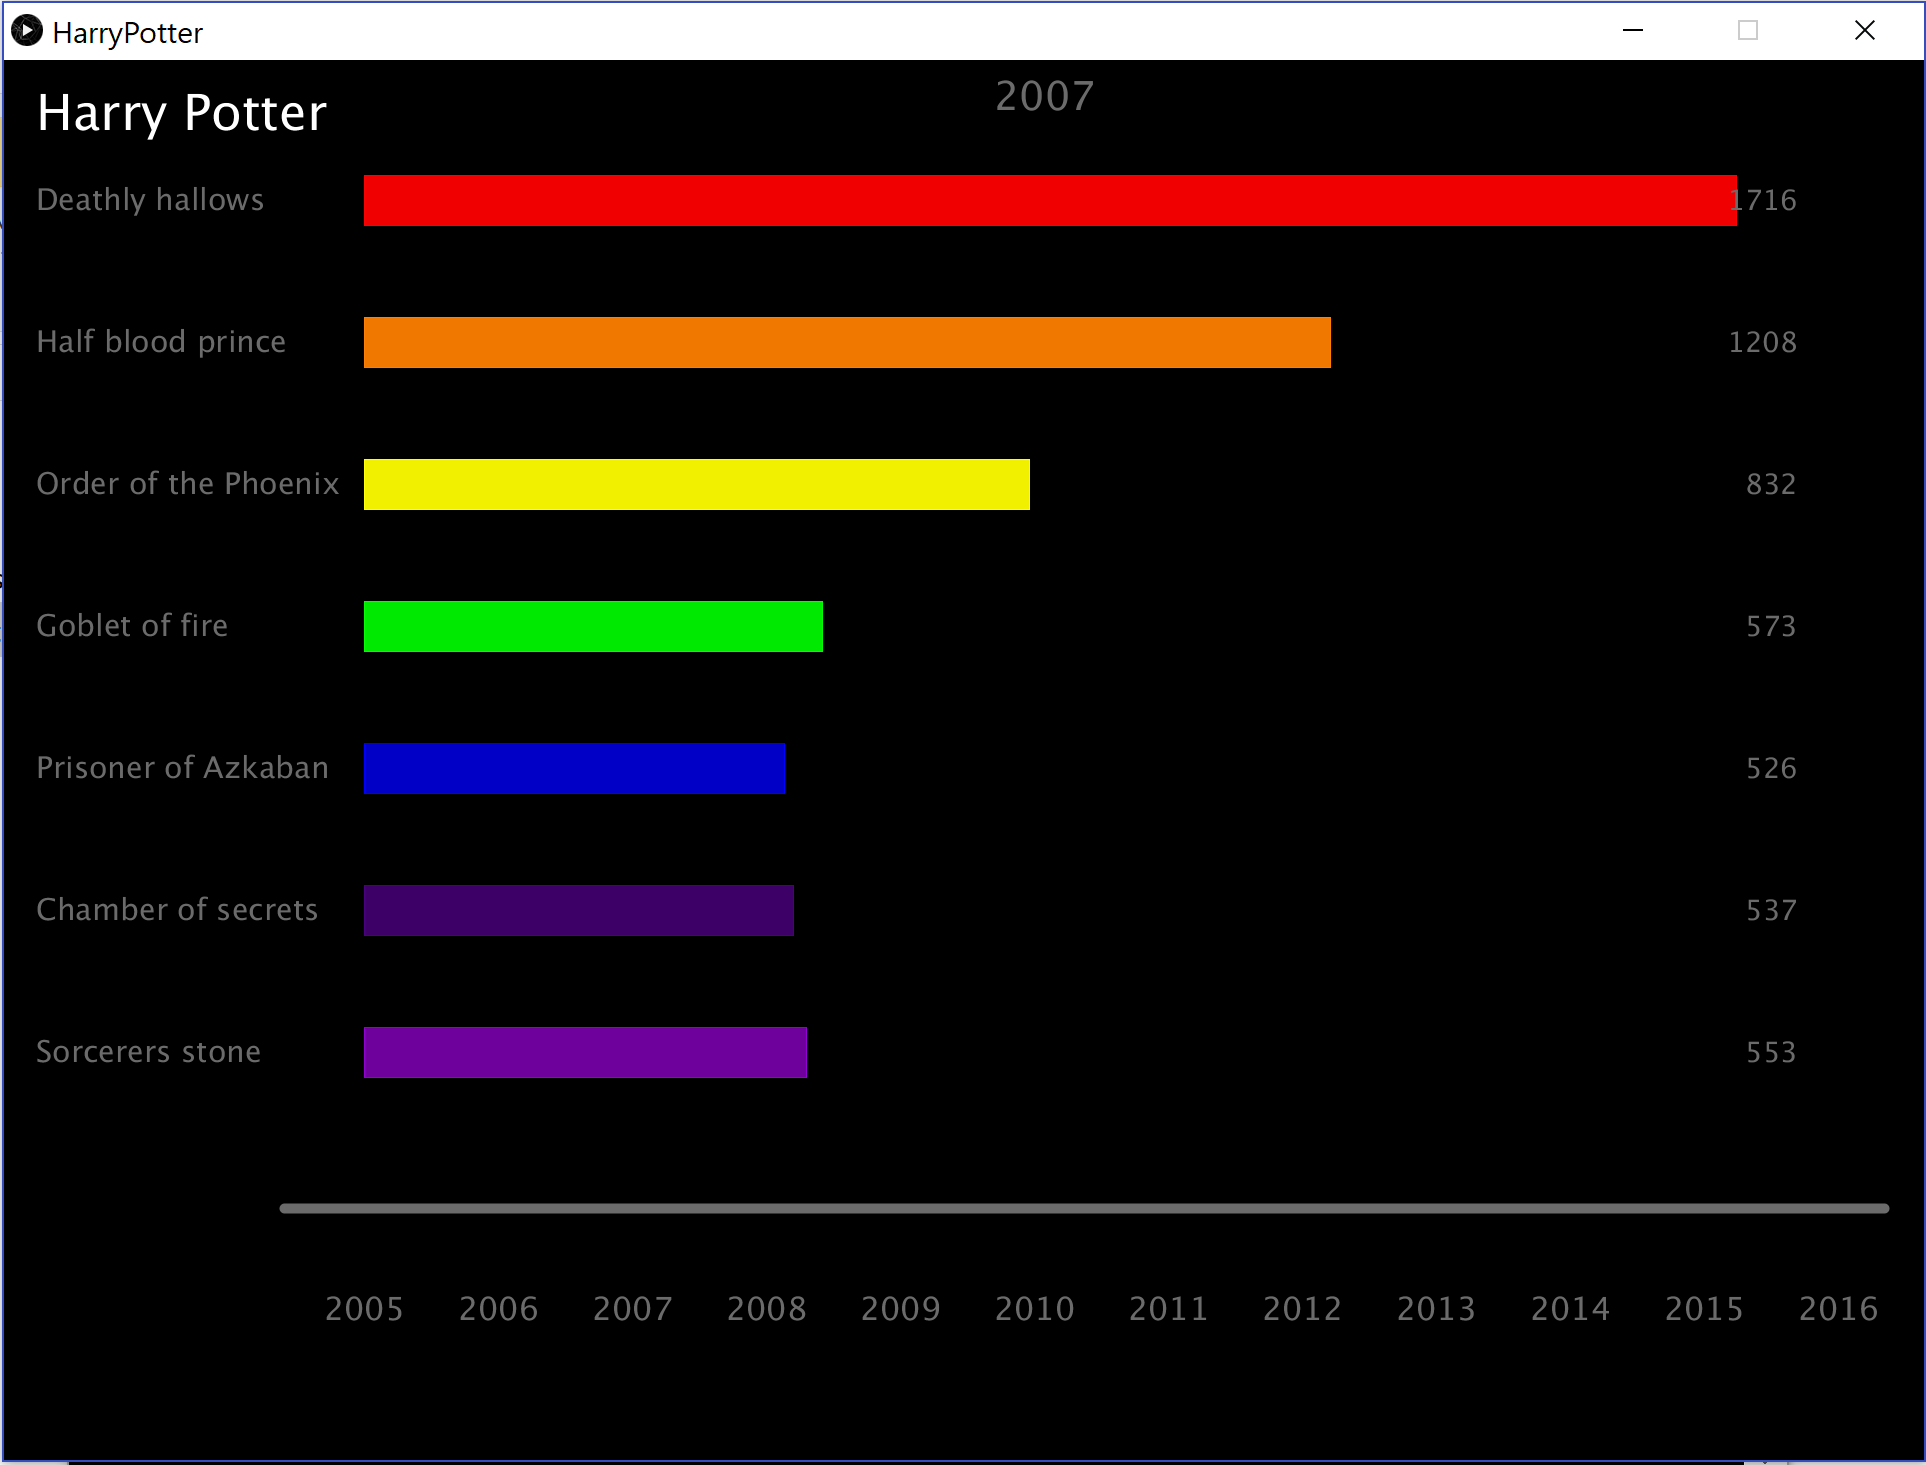
To have more interactive functionalities and specific numbers for each year in the plot, I added a function that if user click on a specific month, the plot will be redrawn into histogram.
Query
This assignment has two version.
First version for year data:
Second updated version for monthly data:
First version for year data:
Second updated version for monthly data:
Preliminary sketches
The idea was inspired by the keyboard from Razer.
Process
The process for version one.
Final result
In the first version, there was 12 years data.
It was interesting to find that seven books share with the same trend in 12 years.
That is to say, the number of checkout for every installment has the same fluctuation pattern.
In addition, I manually sorted every installment by published time.
The bottom one, Sorcerers stones, was the first book and the top one, Deathly hallows, was the last book.
The plot showed that there was no big difference in number of checkout for books published before 2005.
Furthermore, seven books had similar numbers after 2012. One thing should be mentioned was that the number for the first book remained high compared to other books.
In the second version, there was only 8 years but monthly data. It was more clear that the number of times of checkout remained low after July 2012.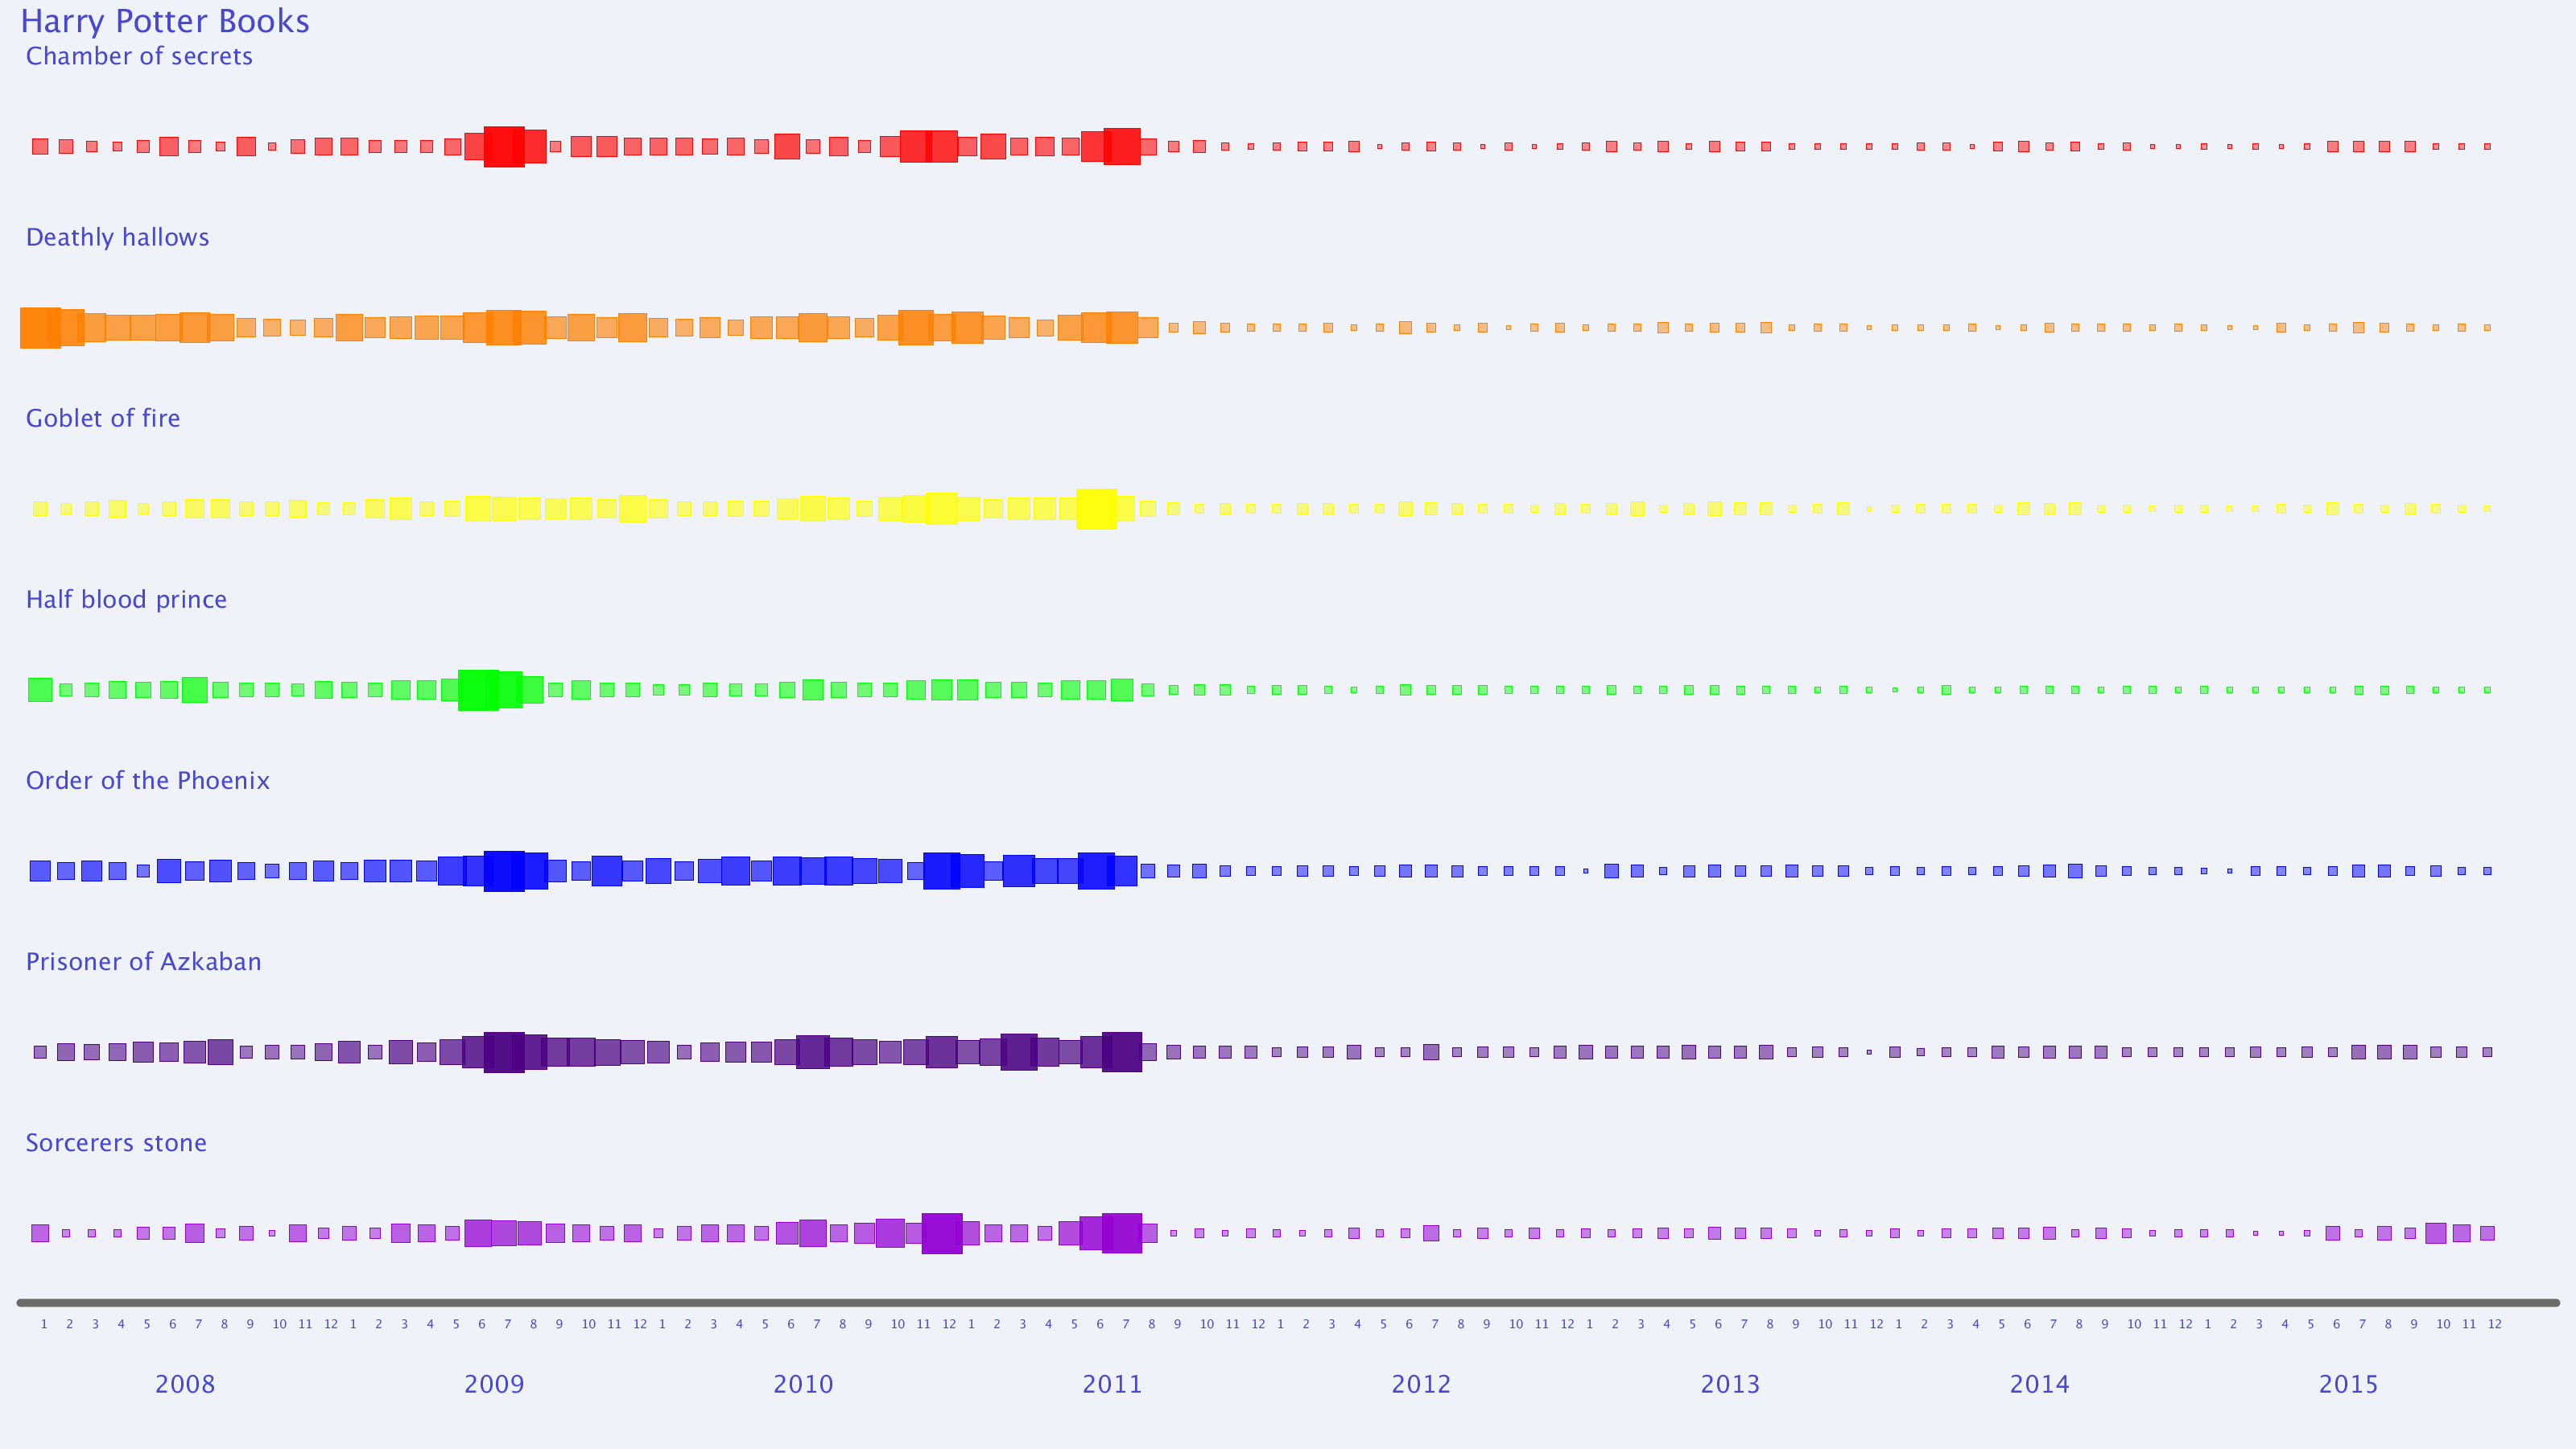
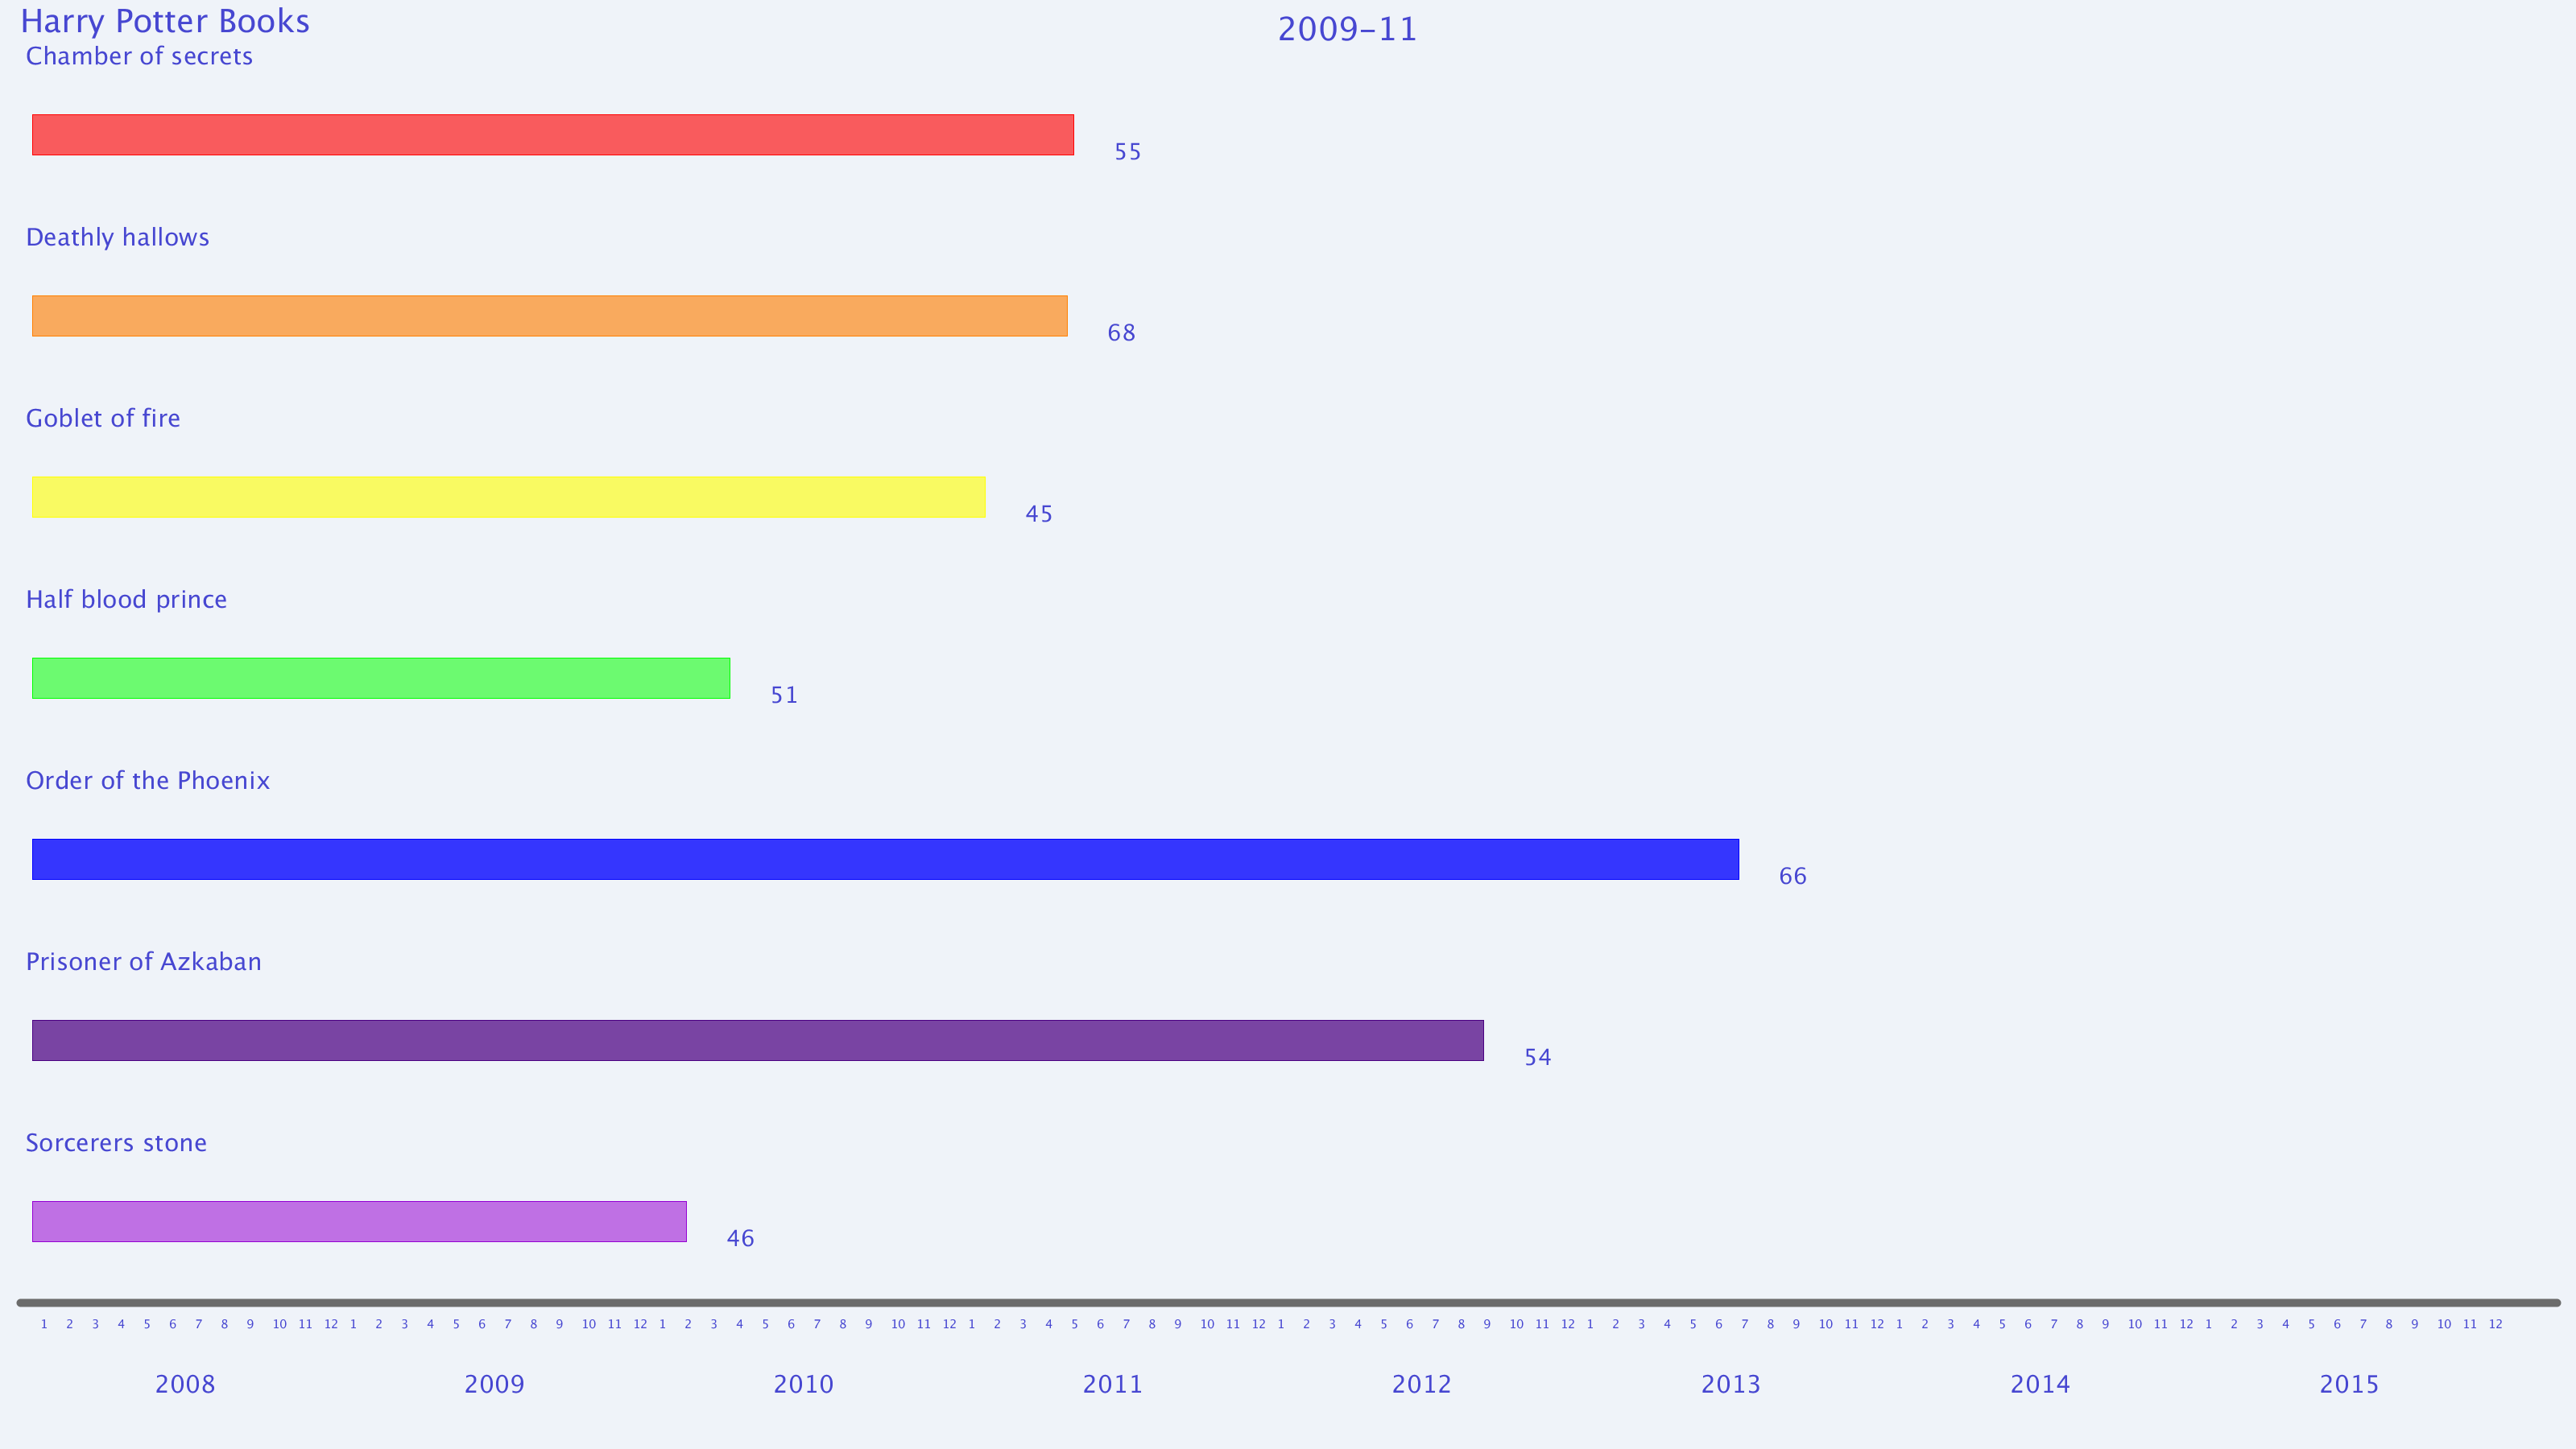
In the second version, there was only 8 years but monthly data. It was more clear that the number of times of checkout remained low after July 2012.
Code