Reading Preference about Sports
MAT 259, 2018
Junxiang Yao
Concept
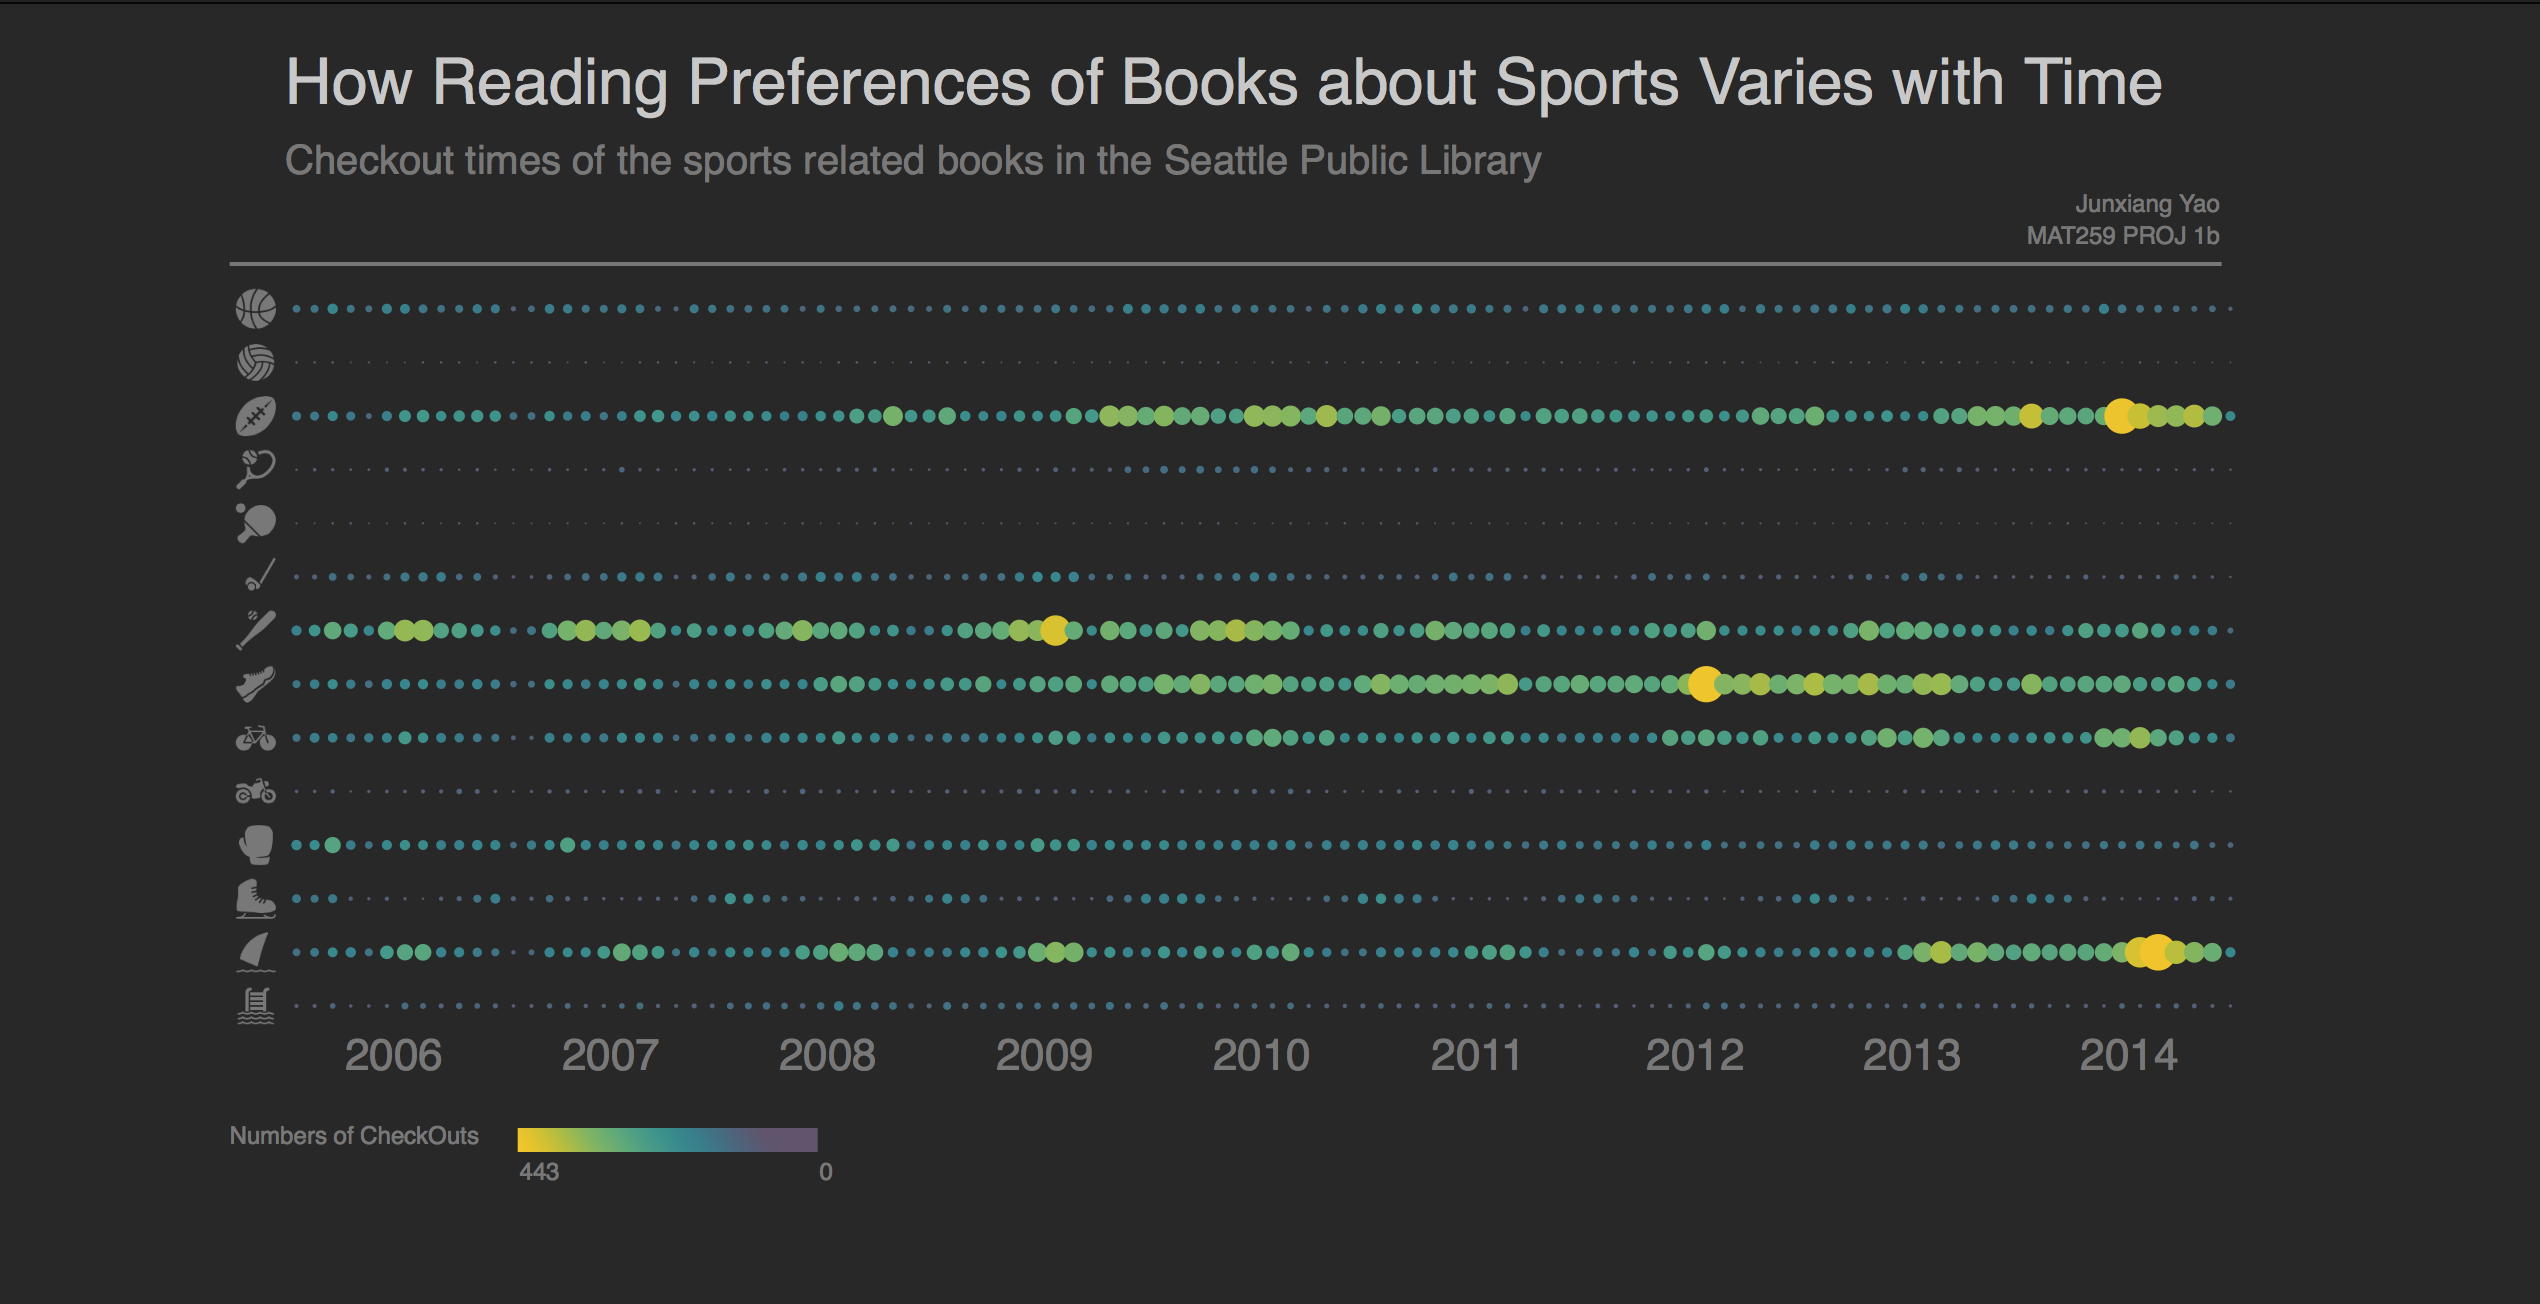
In this project, I used the dataset of sports related books from Seattle Public Library.
I want to find if there is any particular pattern that can display a certain field of data was impacted by some kinds of factors, like world wide sports events, weather, climate, politic reasons, geographical reasons and so on.
In the 2D matrix, I want to highlight the differences not only in each fields, but also between each fields. My goal is bringing out the differences by organizing the layout.
Also, this is a project made 2 years ago. Another important purpose is to translate this project from Processing, which is based on java, into P5.js, which could be presented through a web browser with the help of other front end techniques, and to learn the advantages and disadvantages of using p5.js compared with Processing in the context of making 2D visualizations.
Also, this is a project made 2 years ago. Another important purpose is to translate this project from Processing, which is based on java, into P5.js, which could be presented through a web browser with the help of other front end techniques, and to learn the advantages and disadvantages of using p5.js compared with Processing in the context of making 2D visualizations.
Query
SELECT YEAR(checkout) AS Year,MONTH(checkout) AS Month,

SUM(CASE

WHEN deweyClass >= 796.323 AND deweyClass < 796.324 Then 1

ELSE 0 END) AS 'Basketball',

SUM(CASE

WHEN deweyClass >= 796.325 AND deweyClass < 796.326 Then 1

ELSE 0 END) AS 'Volleyball',

SUM(CASE

WHEN deweyClass >= 796.33 AND deweyClass < 796.34 Then 1

ELSE 0 END) AS 'Football',

SUM(CASE

WHEN deweyClass >= 796.342 AND deweyClass < 796.343 Then 1

ELSE 0 END) AS 'Tennis',

SUM(CASE

WHEN deweyClass >= 796.346 AND deweyClass < 796.347 Then 1

ELSE 0 END) AS 'Table Tennis',

SUM(CASE

WHEN deweyClass >= 796.352 AND deweyClass < 796.353 Then 1

ELSE 0 END) AS 'Golf',

SUM(CASE

WHEN deweyClass >= 796.357 AND deweyClass < 796.358 Then 1

ELSE 0 END) AS 'Baseball',

SUM(CASE

WHEN deweyClass >= 796.4 AND deweyClass < 796.5 Then 1

ELSE 0 END) AS 'Weight Lifting,Track&Field, Gymnastics',

SUM(CASE

WHEN deweyClass >= 796.6 AND deweyClass < 796.7 Then 1

ELSE 0 END) AS 'Cycling',

SUM(CASE

WHEN deweyClass >= 796.7 AND deweyClass < 796.8 Then 1

ELSE 0 END) AS 'Motor',

SUM(CASE

WHEN deweyClass >= 796.8 AND deweyClass < 796.9 Then 1

ELSE 0 END) AS 'Combat',

SUM(CASE

WHEN deweyClass >= 796.9 AND deweyClass < 797 Then 1

ELSE 0 END) AS 'Ice&Snow',

SUM(CASE

WHEN deweyClass >= 797.1 AND deweyClass < 797.2 Then 1

ELSE 0 END) AS 'Boating',

SUM(CASE

WHEN deweyClass >= 797.2 AND deweyClass < 797.3 Then 1

ELSE 0 END) AS 'Swimming & Diving',

FROM spl3._rawXmlDataCheckOuts

WHERE

itemtype = 'acbk'

AND YEAR(checkOut) >= '2006'

AND YEAR(checkOut) < '2015'

GROUP BY  MONTH(checkOut),

YEAR(checkOut)

ORDER BY YEAR(checkOut)  , MONTH(checkOut)
Process
The first differnece I found is the way P5.js load data. It requires a function nmed preload(), and load the data before setup().
And in order to run the P5.js, a local server is required to retrive and present pictures. I had trouble in using color bar image.
The reason might be that I am using a jpg file which server might has a hard time to process the data. I will try to use a bmp
file instead. But in this project, my solution is to save the values of the line of the pixals in the color bar image into an array beforehand,
and hard-coded the array and save it as a variable in sketch.js.
Besides, it is important to be aware of the difference in value range between Process and P5.js. Like britness();, in Processing the maximum value is 255, whereas in P5.js it is 100.
Besides, it is important to be aware of the difference in value range between Process and P5.js. Like britness();, in Processing the maximum value is 255, whereas in P5.js it is 100.
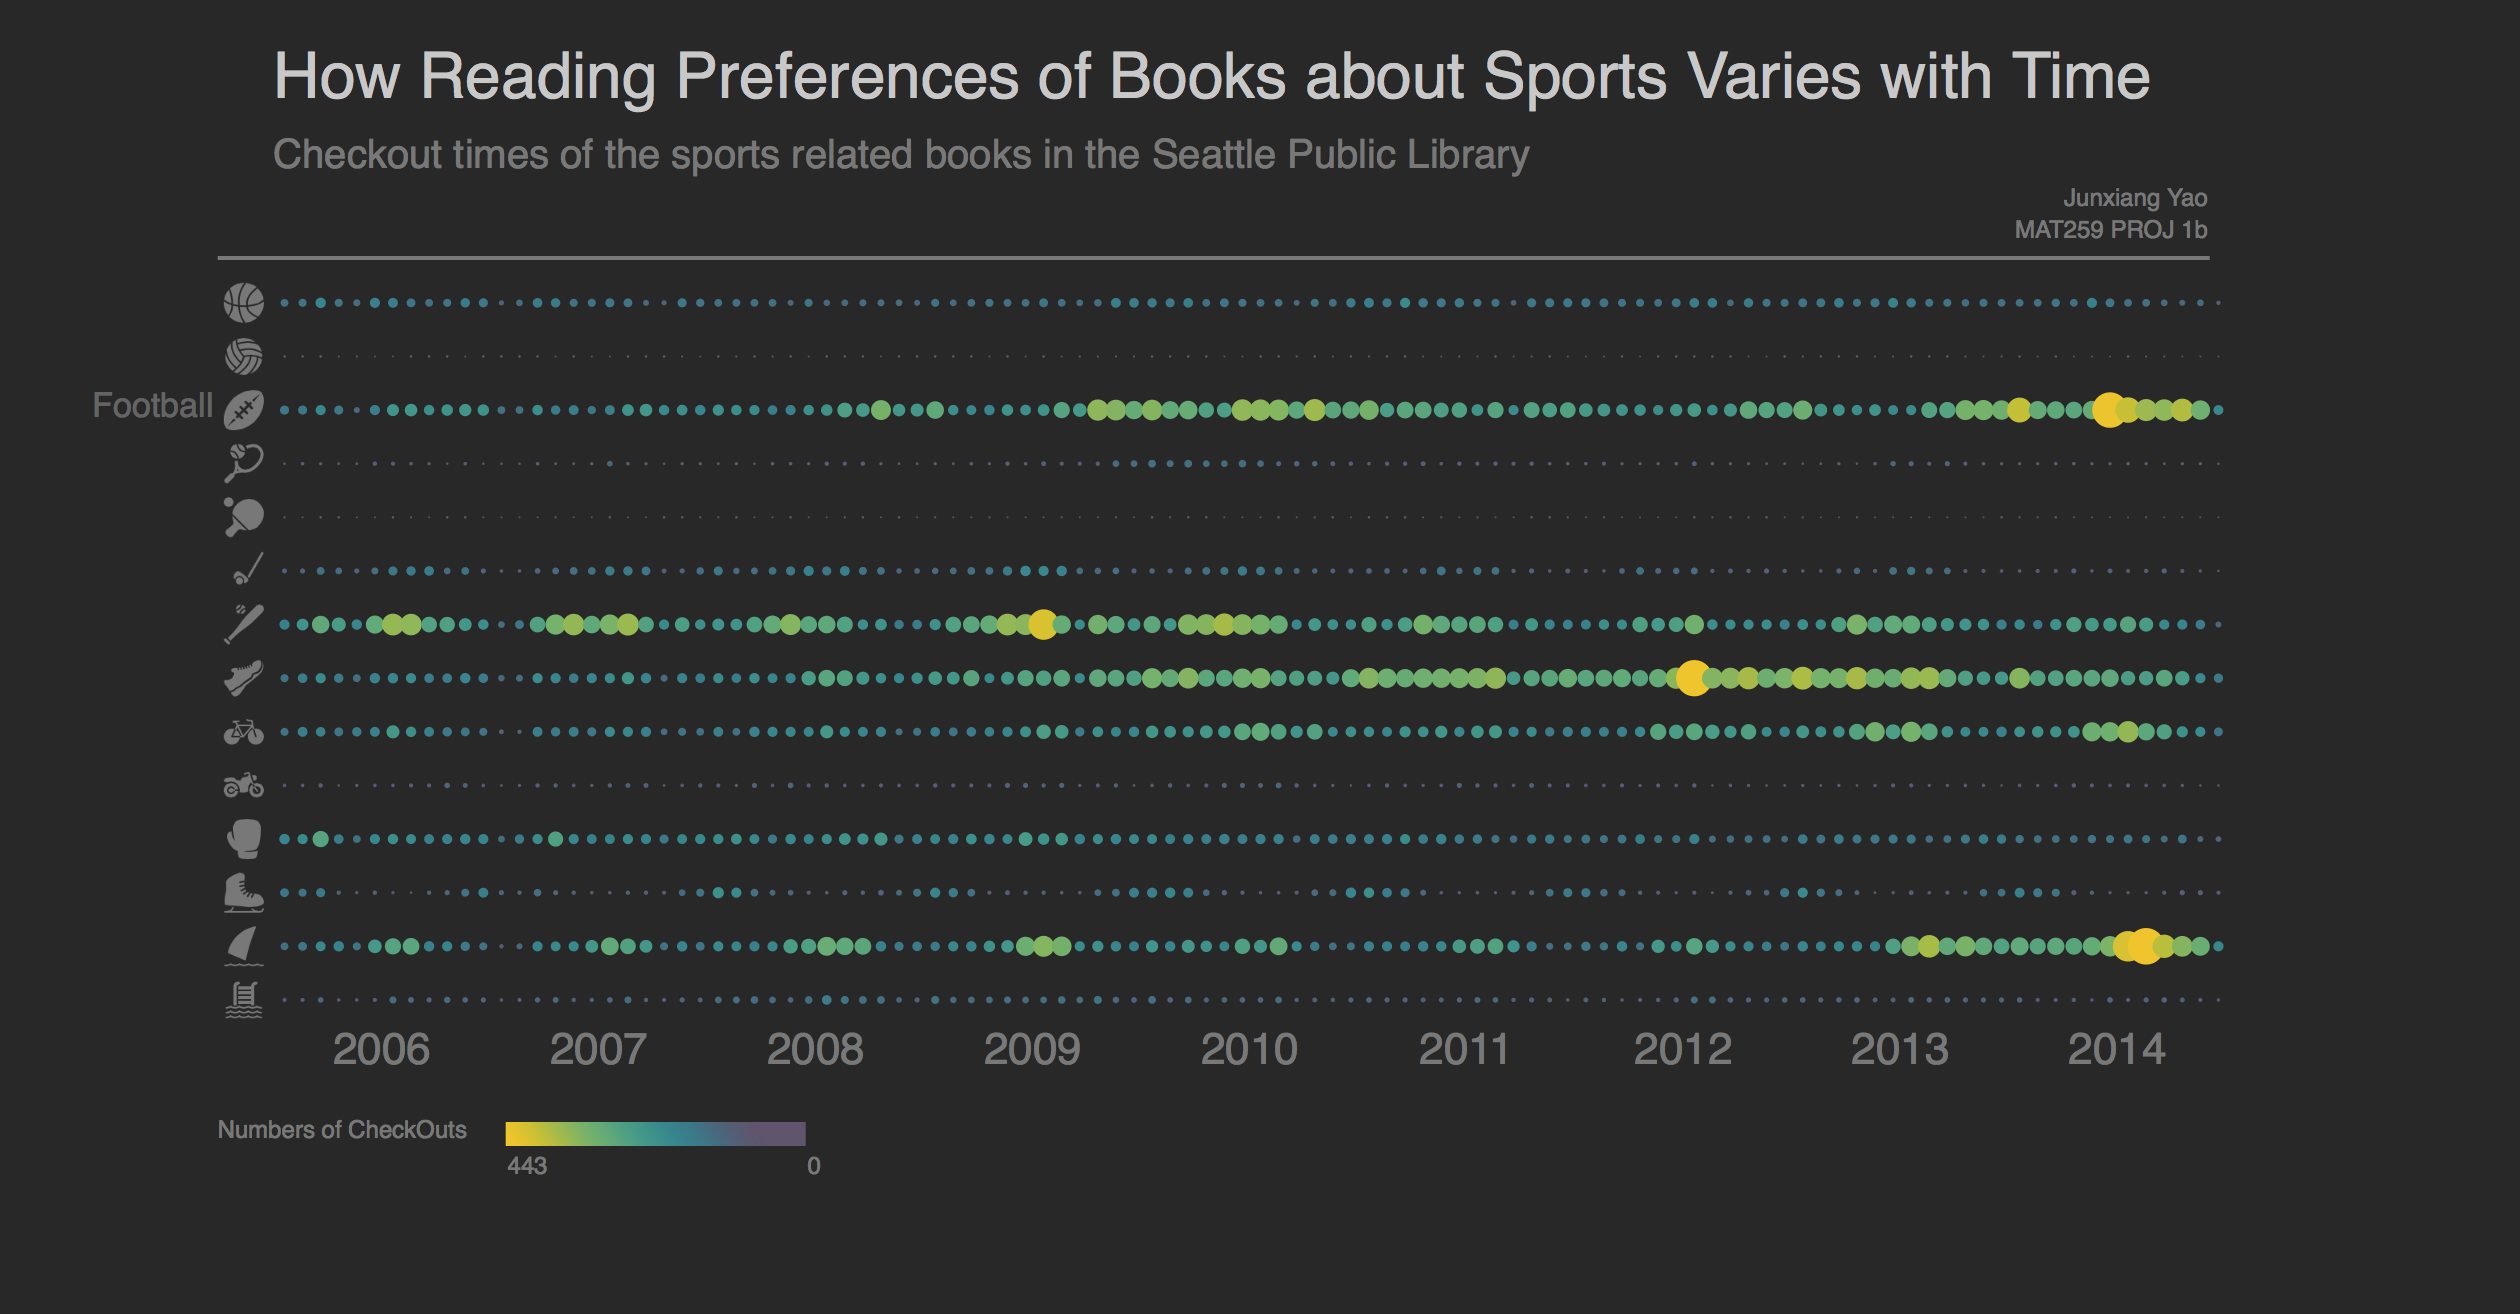
Final result
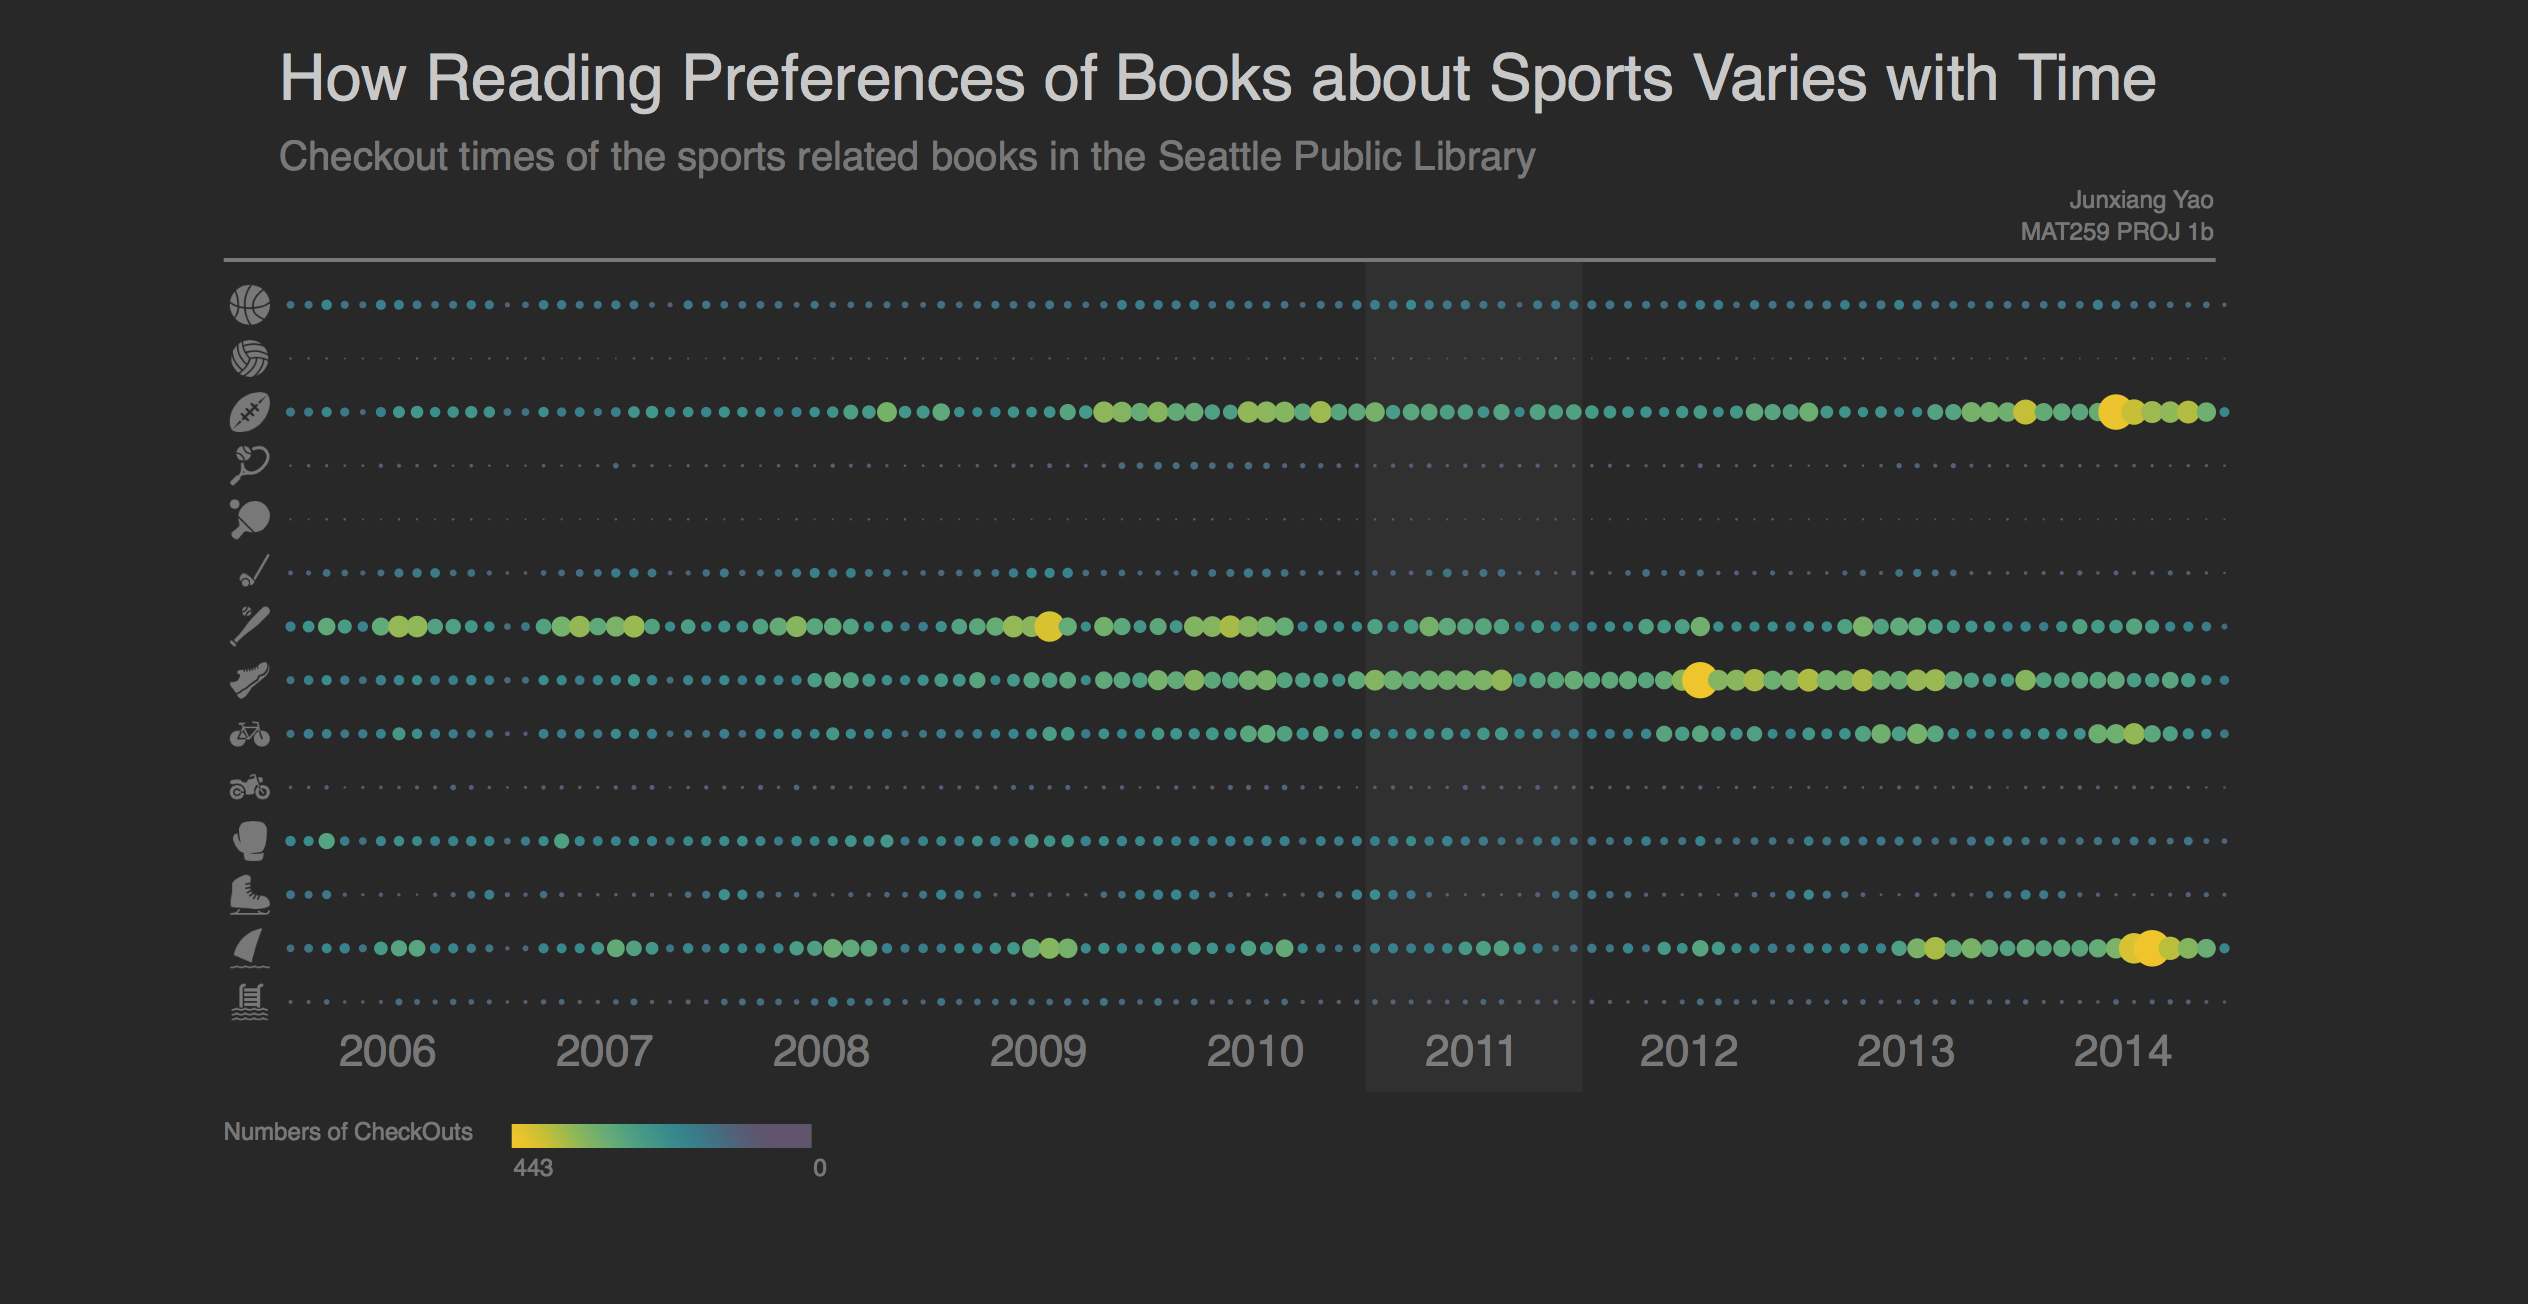
I increased the interaction sensitive area to be more reasonable.
Project