2D Symmetric Line Graph
MAT 259, 2018
Benson Li
Concept
I wanted to see if new movie releases in the Pirates of the Caribbean series would spark interest in rewatching or watching for the first time the previous movies in the series. So, I got from the SPL library data the number of checkouts per month for the first 4 Pirates of the Caribbean movies.
Query
SELECT
YEAR(cout), MONTH(cout), SUM(case when LOWER(spl_2016.inraw.title) like 'pirates of the caribbean the curse of the black pearl' THEN 1 ELSE 0 END) AS 'black pearl',
SUM(case when LOWER(spl_2016.inraw.title) like 'pirates of the caribbean dead mans chest' THEN 1 ELSE 0 END) as 'dead mans chest',
SUM(case when LOWER(spl_2016.inraw.title) like 'pirates of the caribbean at worlds end' THEN 1 ELSE 0 END) as 'at worlds end',
SUM(case when LOWER(spl_2016.inraw.title) like 'pirates of the caribbean on stranger tides' THEN 1 ELSE 0 END) as 'strangers tide'
FROM
spl_2016.inraw
WHERE
(year(cout) > 2005)
group by year(cout), month(cout)
To do some further data processing, I wrote a small python script(pirates.py) that gives me the absolute value of the time derivatives for each of the movie columns.
To do some further data processing, I wrote a small python script(pirates.py) that gives me the absolute value of the time derivatives for each of the movie columns.
Preliminary sketches
I initally wanted to represent the checkout number by a width of a "river". But I figured that for functionality reasons, it would be better to use a line graph.
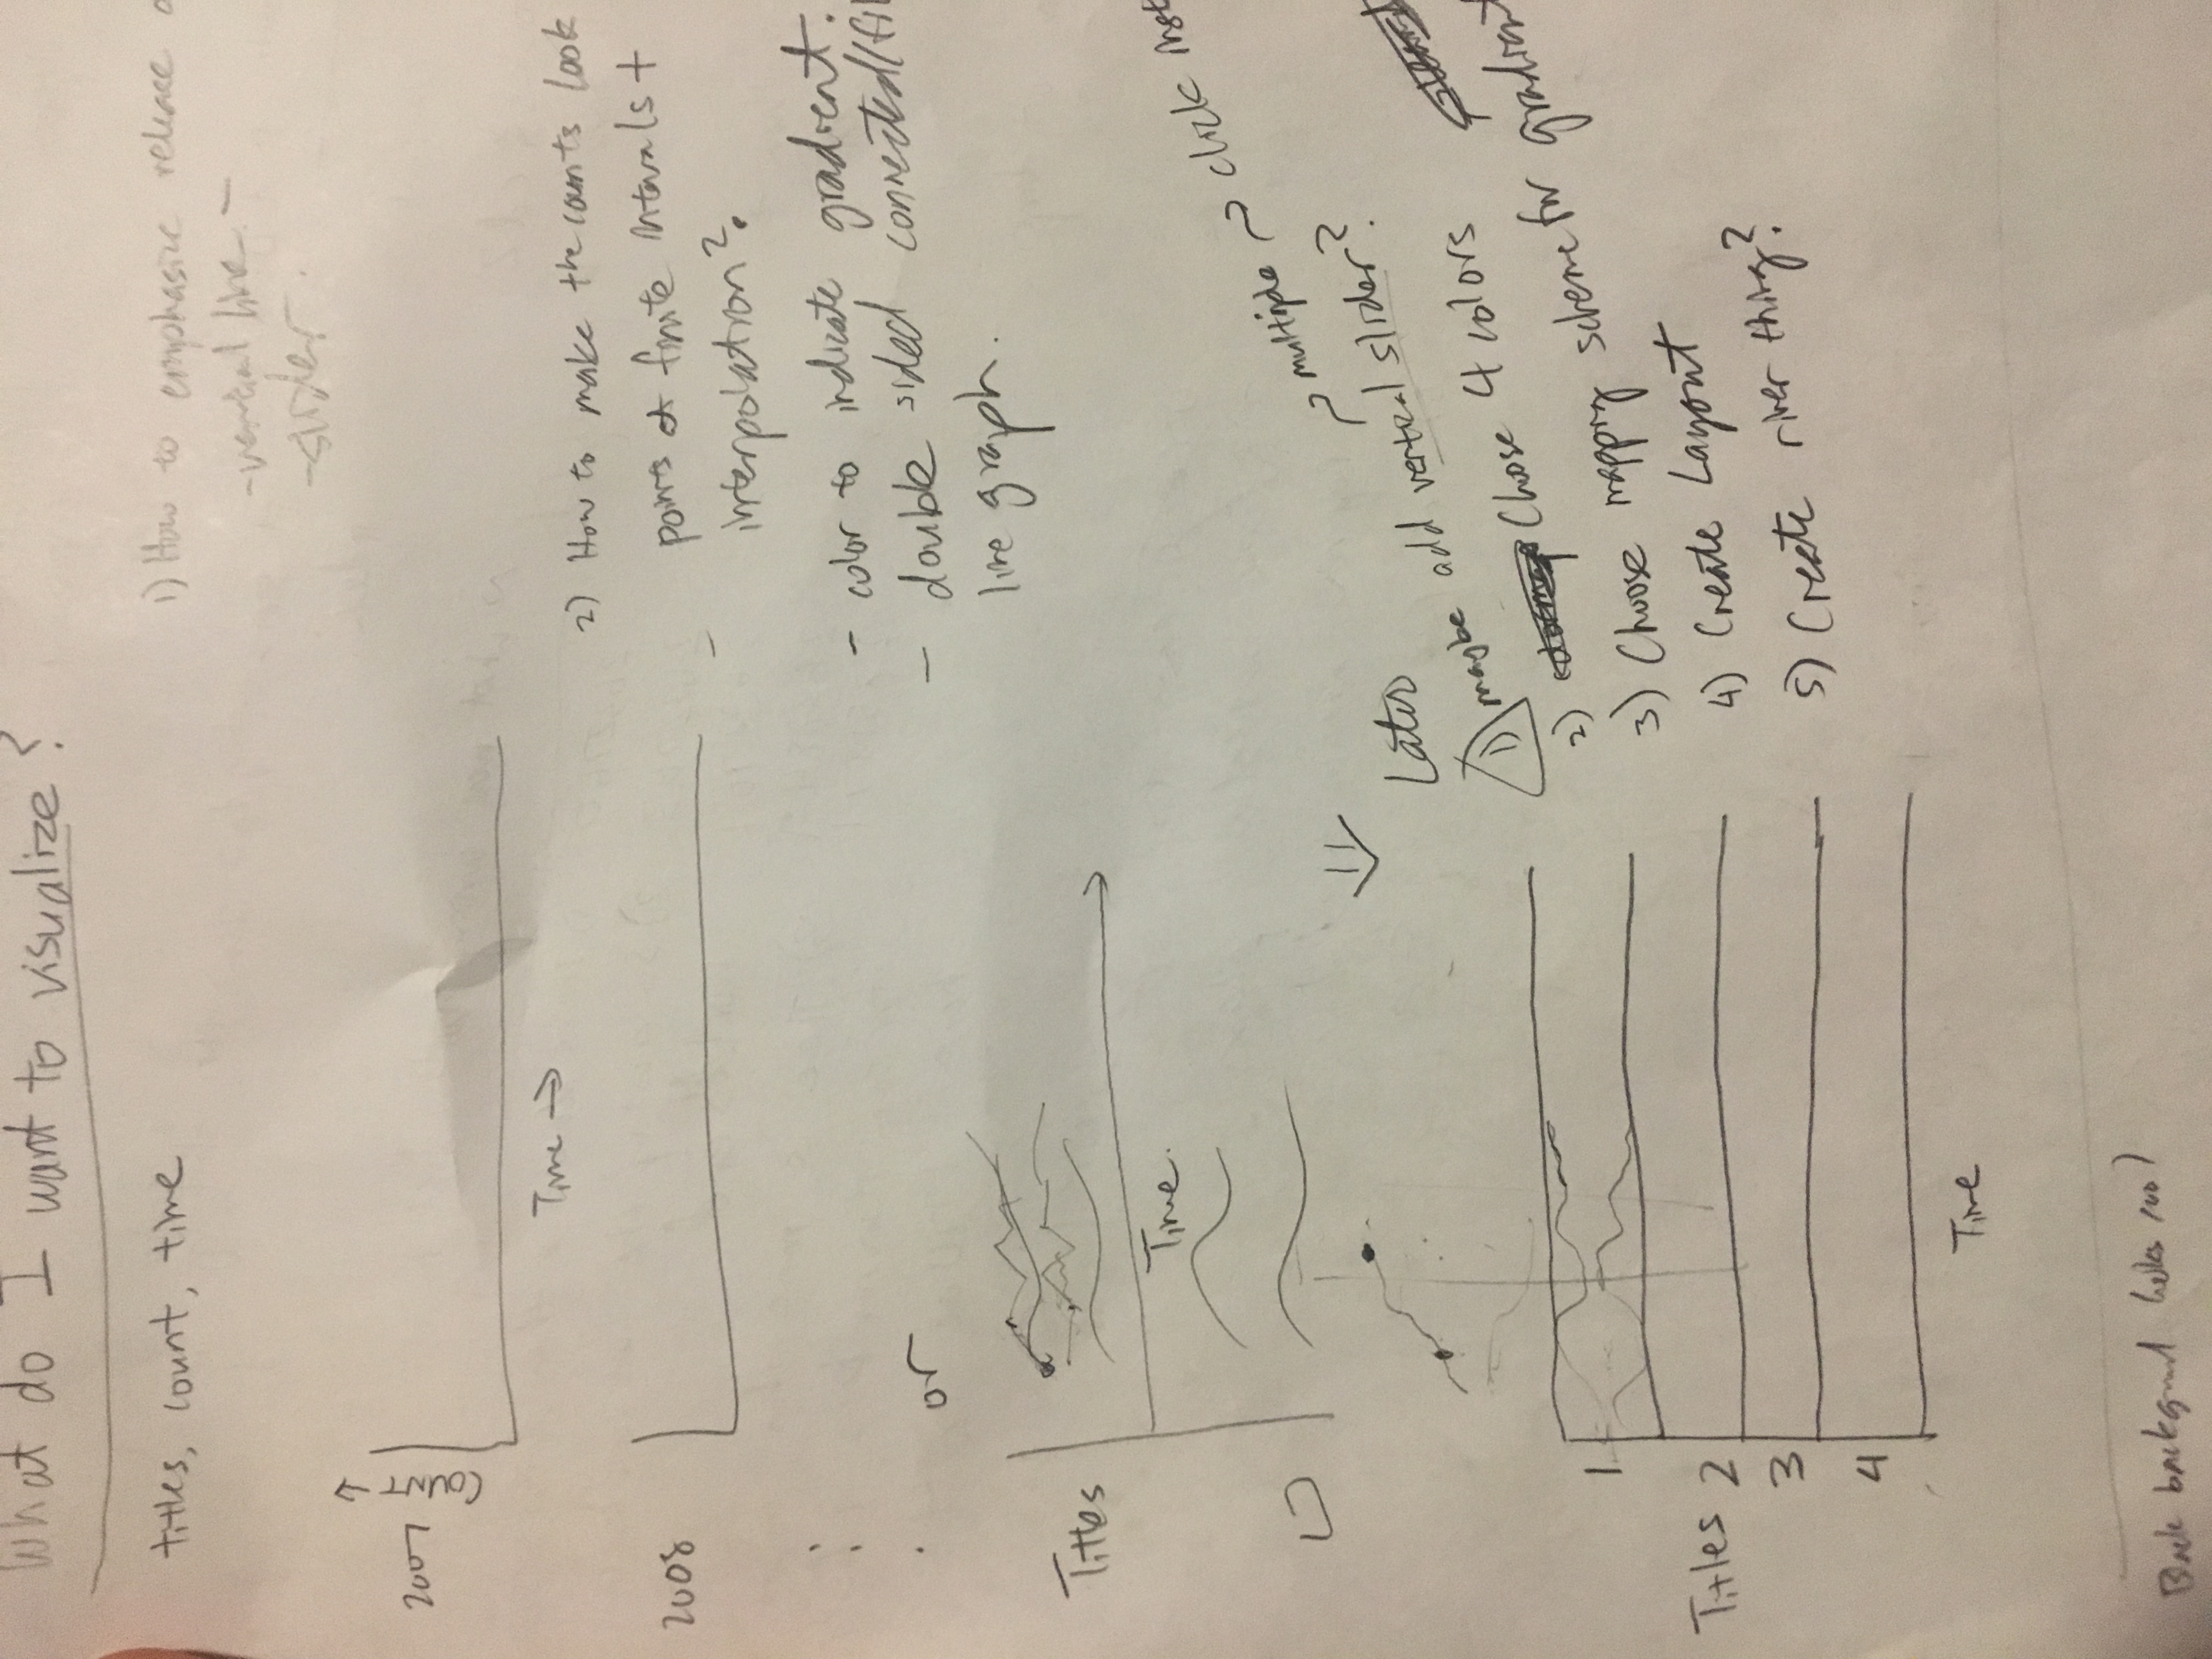
Process
To keep the "river" idea, I decided to reflect the linegraph about the x-axis.
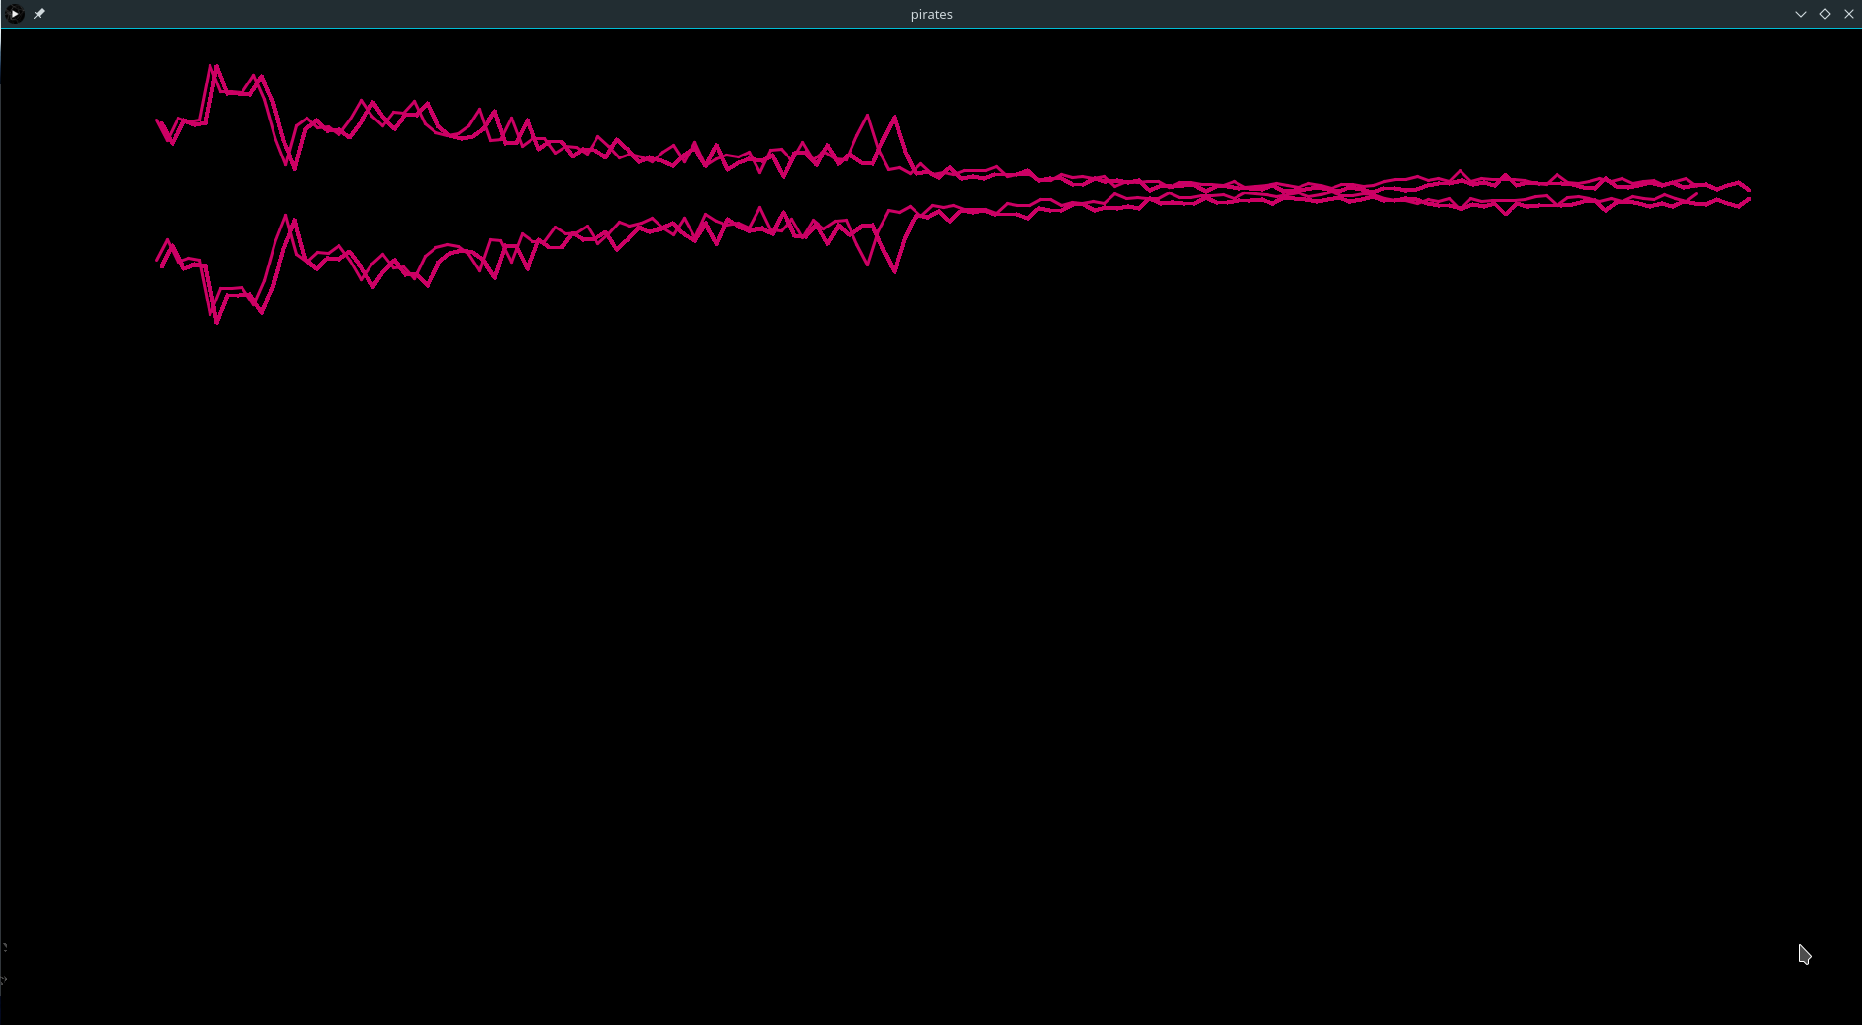
Adding all 4 movies and their labels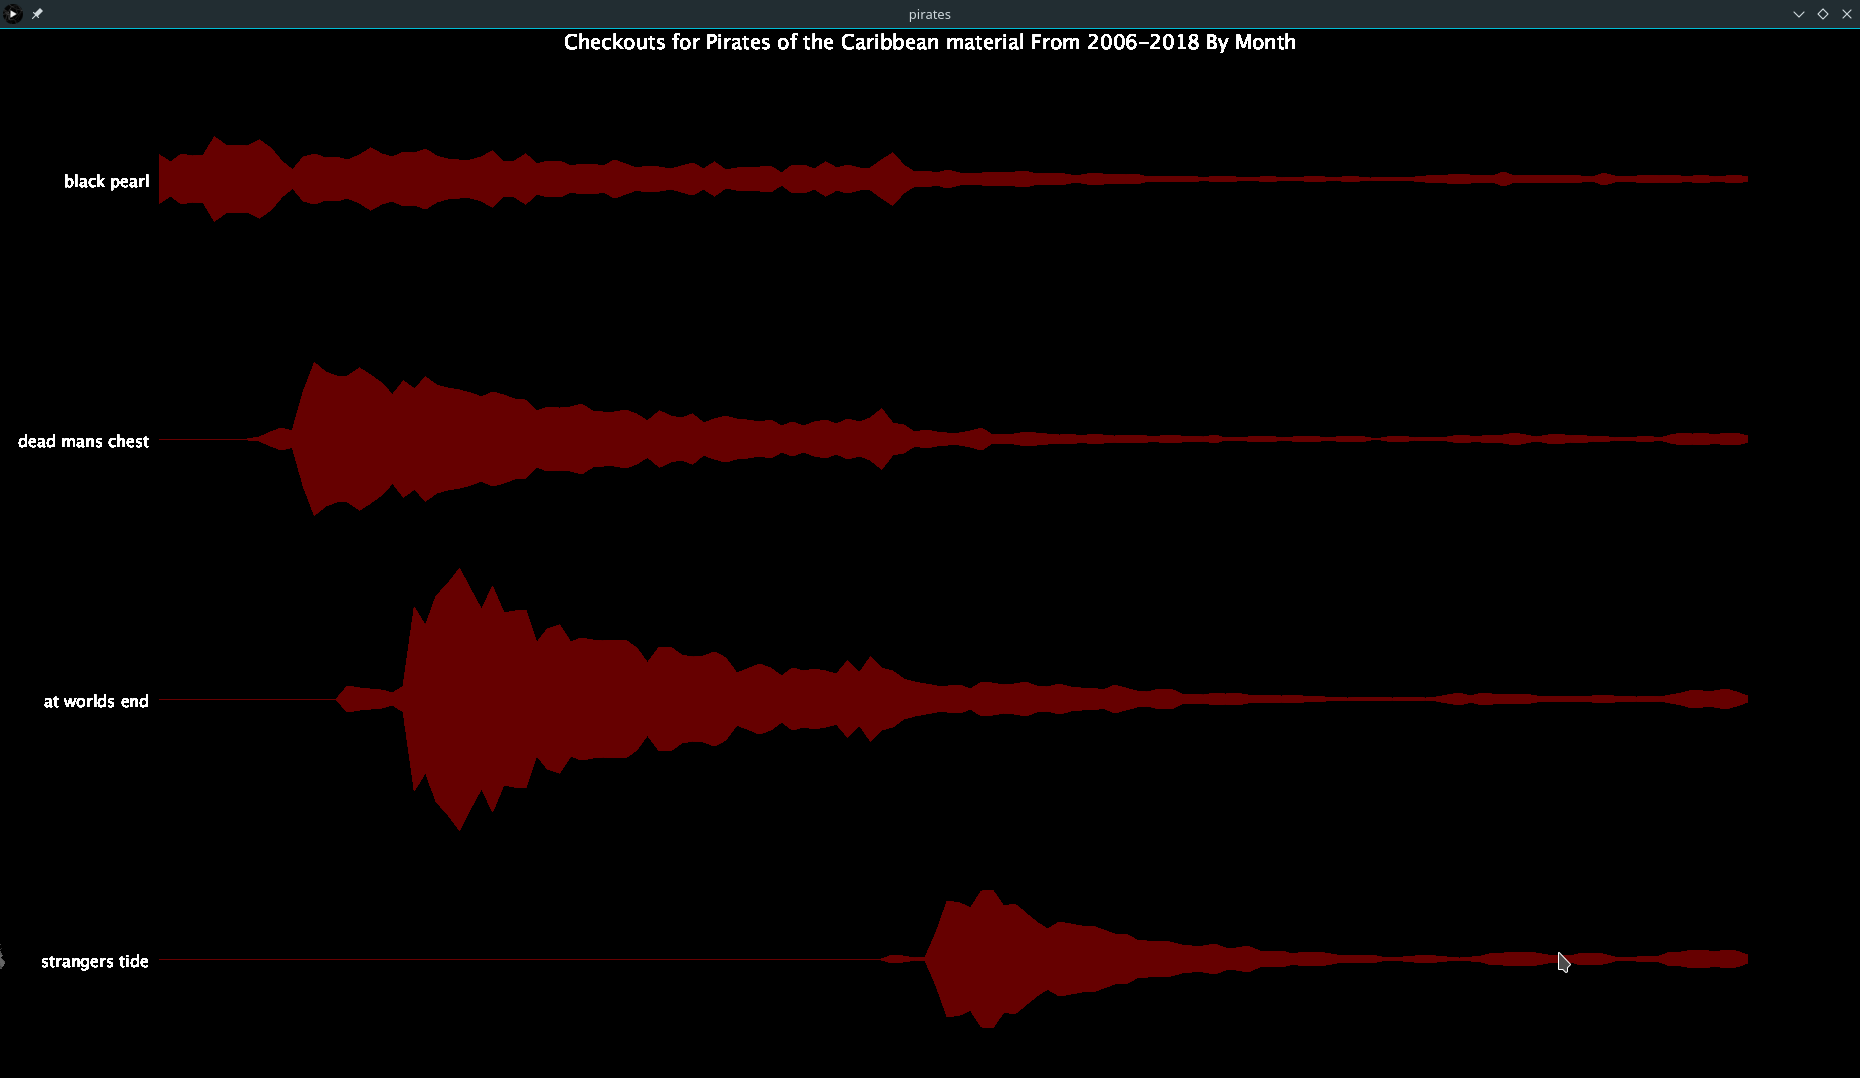
Adding borders, gradient shading, and colormap
Adding all 4 movies and their labels
Adding borders, gradient shading, and colormap
Final result
So for my visualization, I decided to make a symmetric line graph, meaning I would reflect the graph about the time axis. Also I have encoded the absolute value of the change in checkouts in the colormap with respect to the maximum of each movie's maximum change in checkouts, with white being the highest across all movies and black being 0.
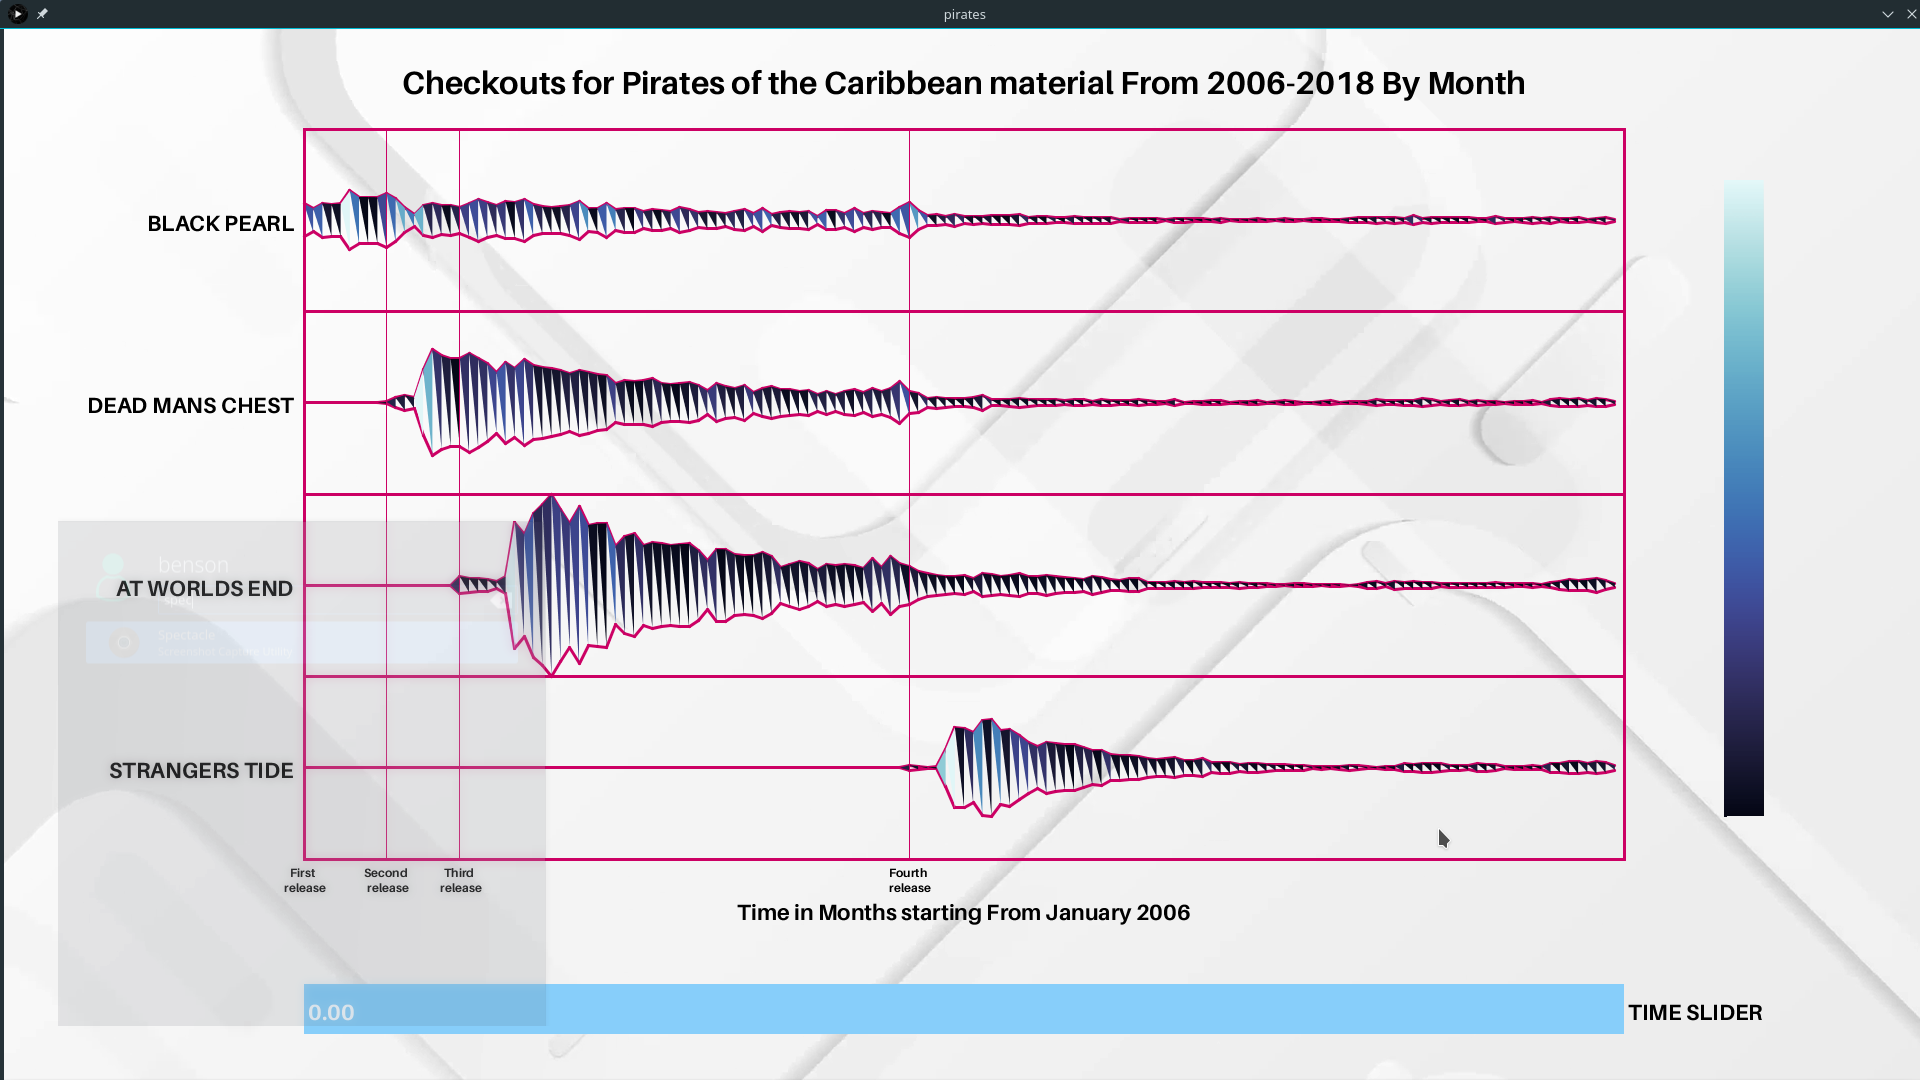
I have also added a slider which the user can use to drag a vertical line across the graph, so that they may compare checkouts at times besides the movie release dates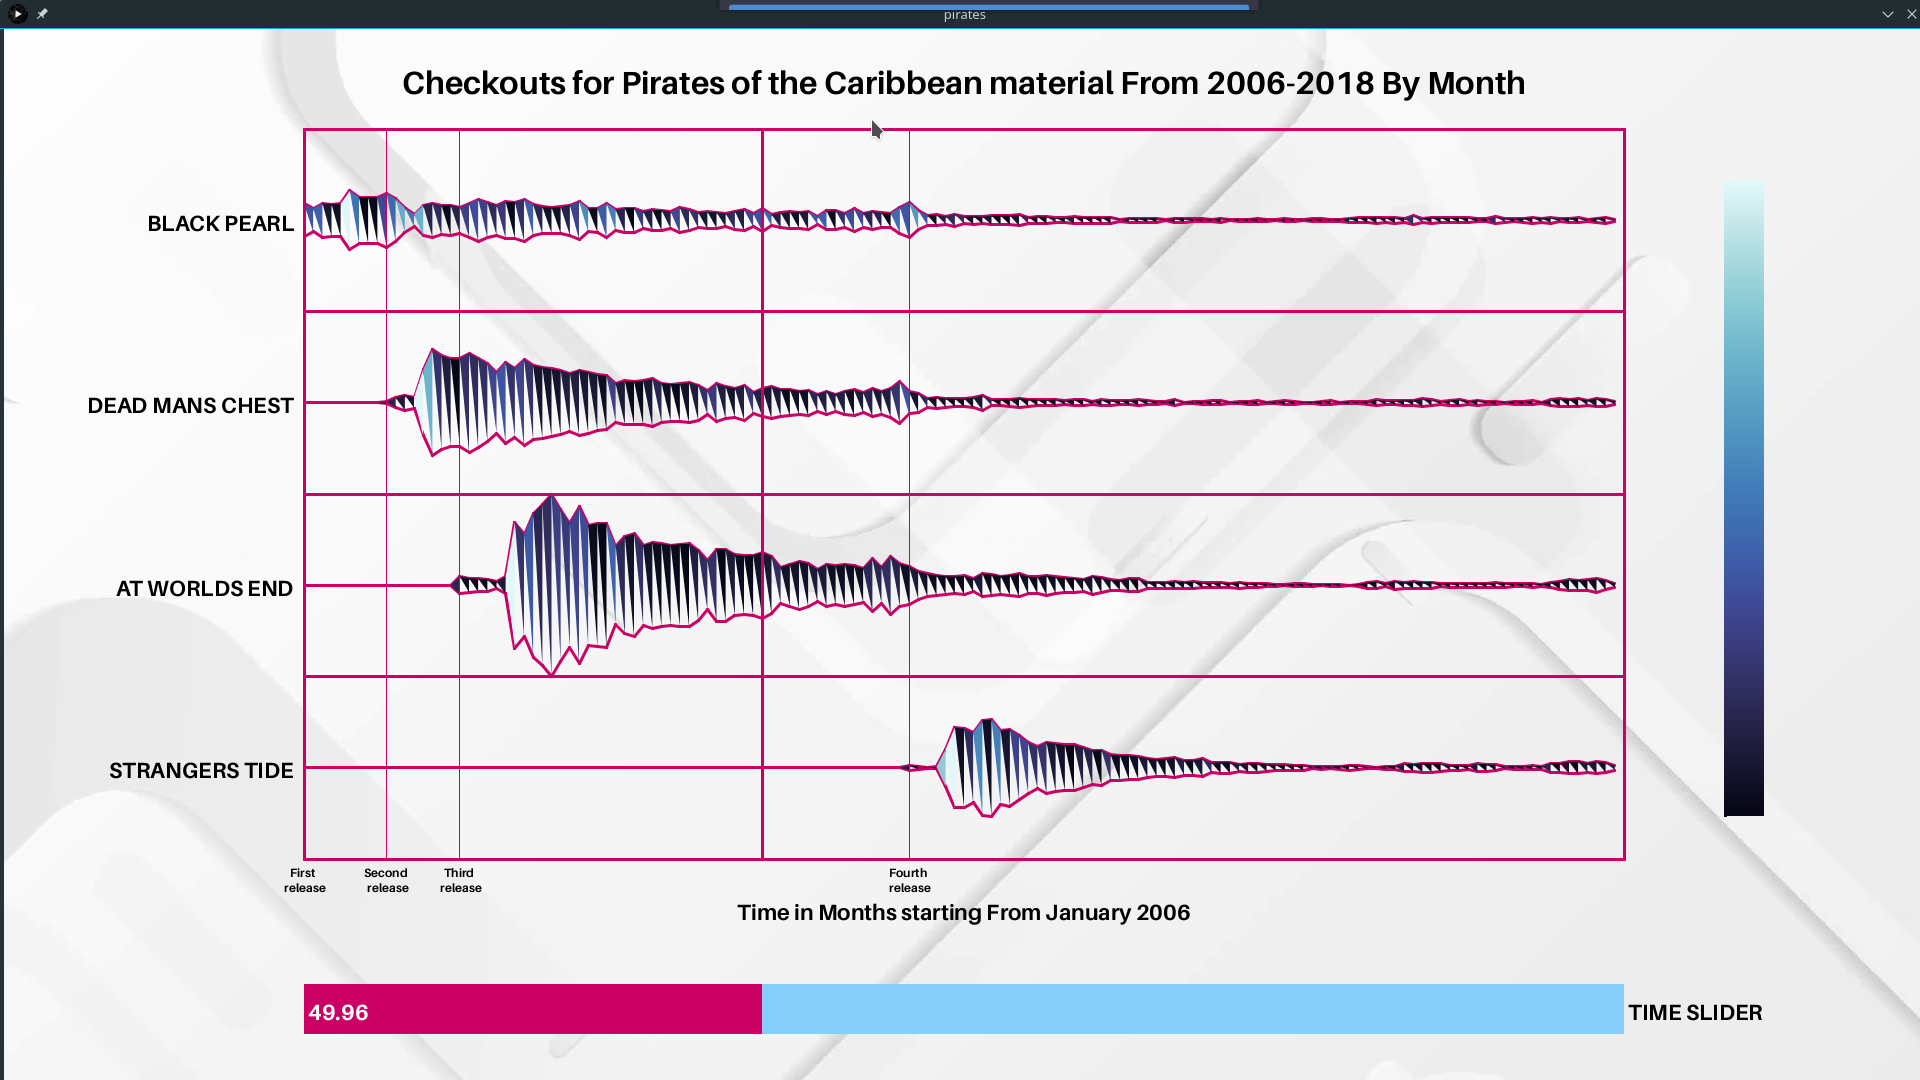
I have also added a slider which the user can use to drag a vertical line across the graph, so that they may compare checkouts at times besides the movie release dates
Code