Time use is always an important topic in our daily life. I want to explore the pattern of how people spend their time. Does age, gender, work, location, and/or family affect time use?
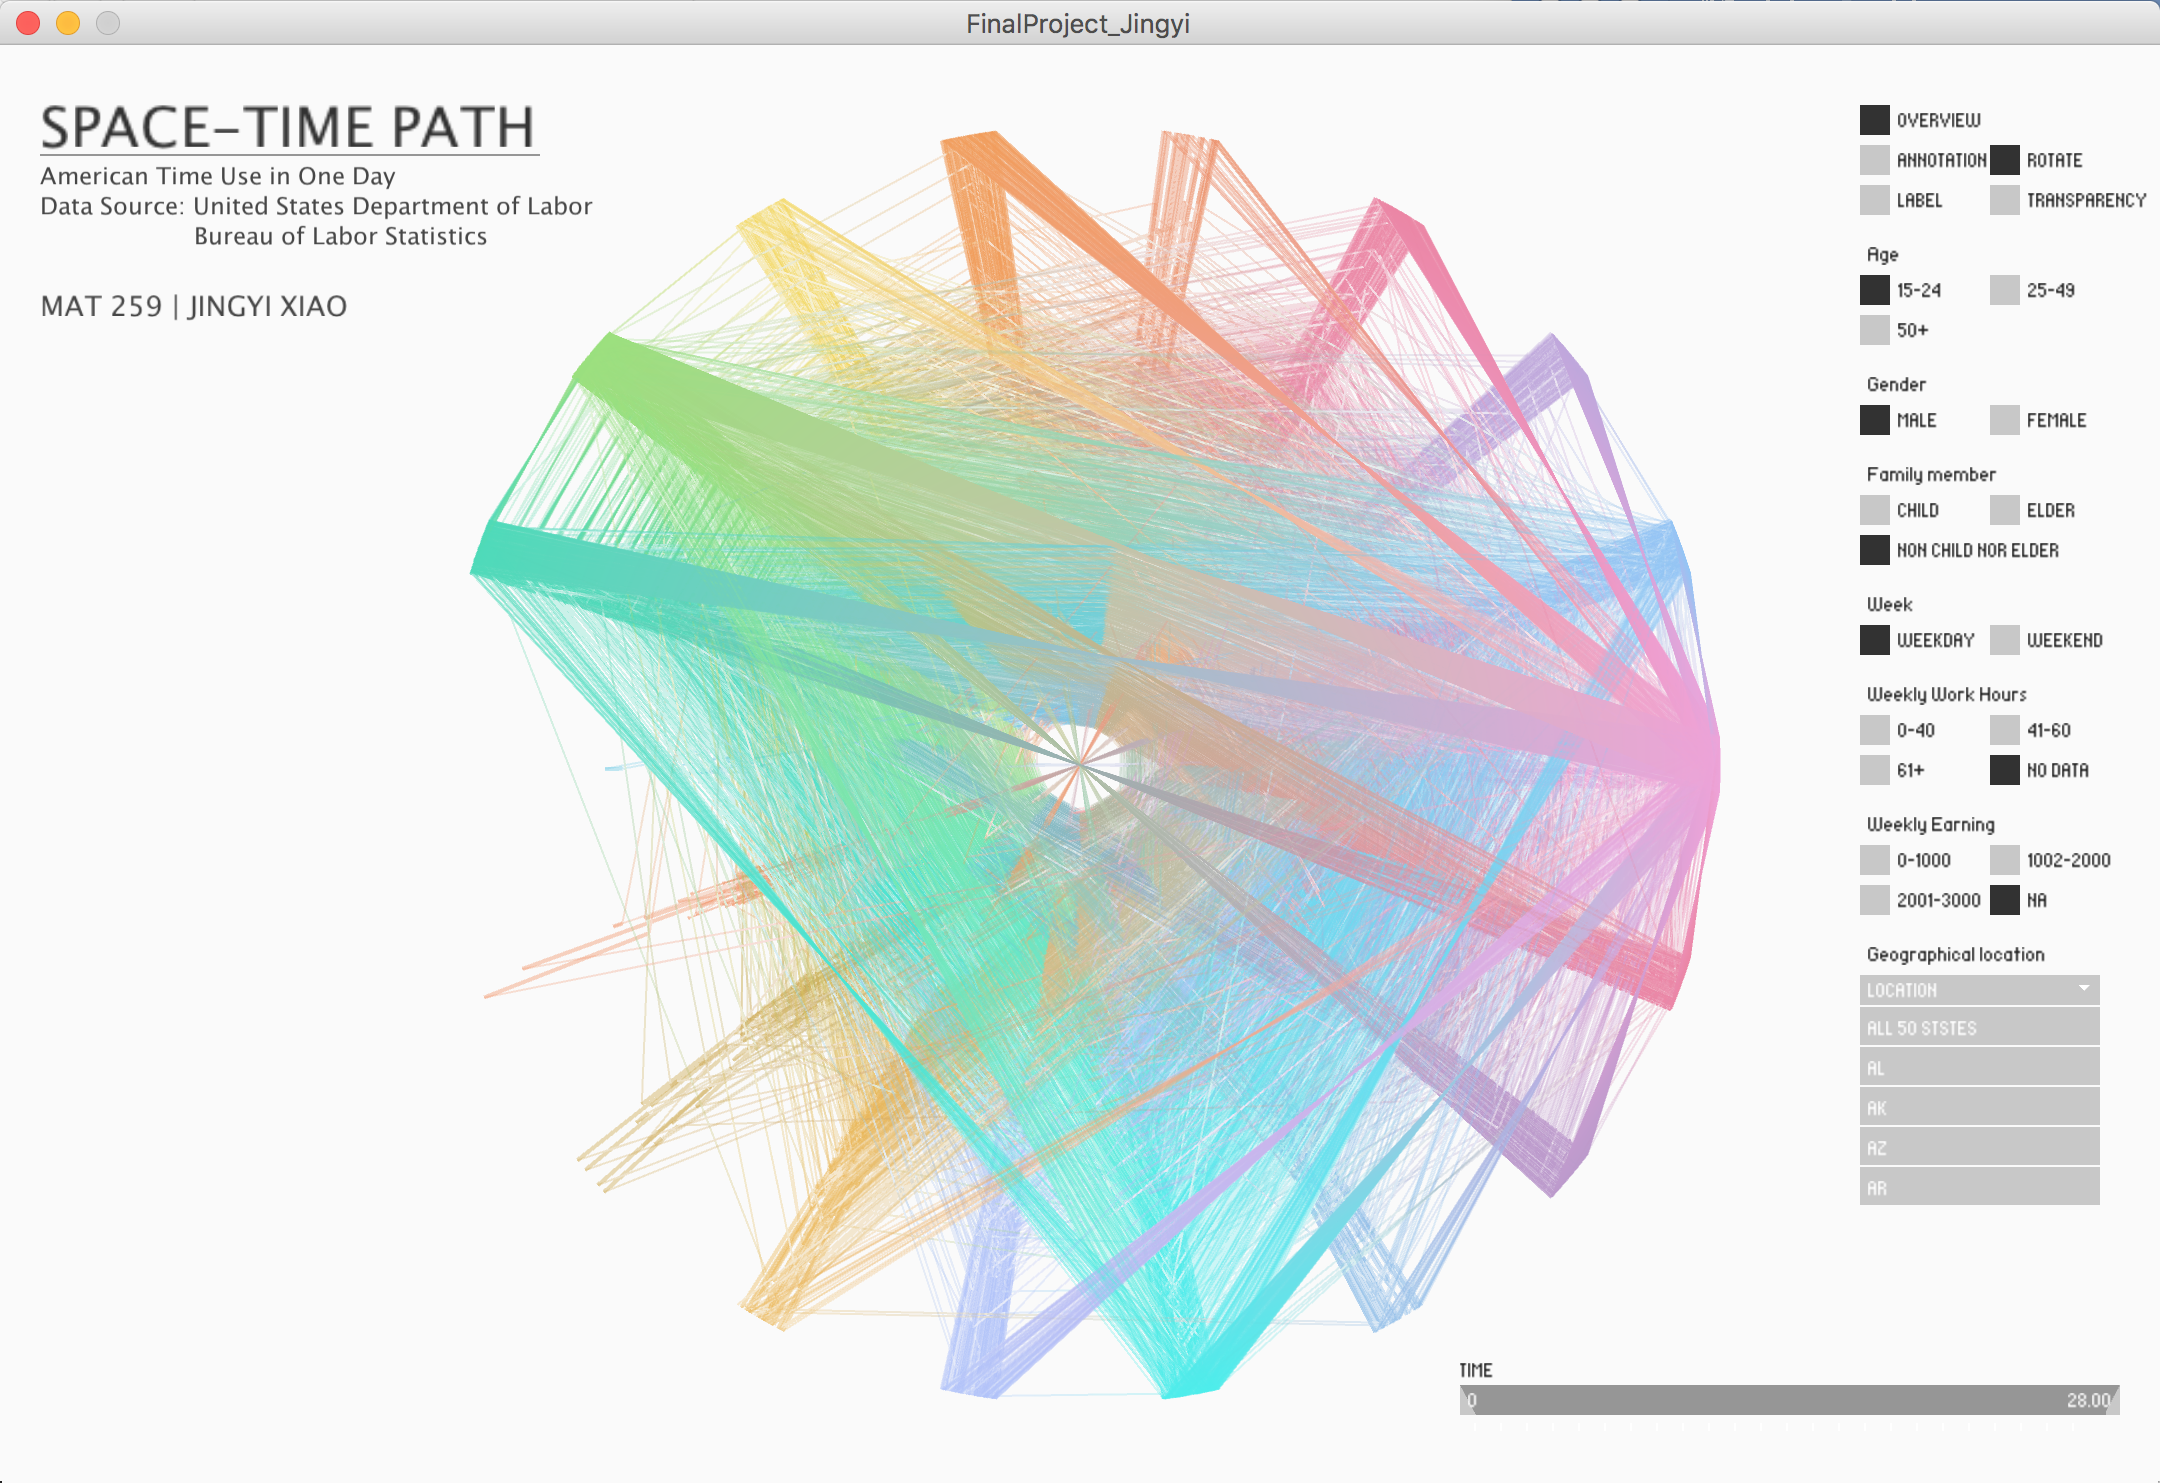
This project aims to visualize American time use in one day.
The data is from American Time Use Survey (ATUS) - 2015 Microdata Files.
"The American Time Use Survey (ATUS) measures the amount of time people spend doing various activities, such as paid work, childcare, volunteering, and socializing."
I chose ATUS 2015 Activity file and ATUS 2015 Activity summary file as my data.
Data processingThe data contains lots of information, so I have to select the part of data I need. By looking at the documentations (2015 Basic ATUS Data Dictionaries and 2015 Survey Documentation, explanations of every variables in the Excel sheet) on the website, I finally chose the data I need and wrote codes to organize the data in a form that works for me.
Processed dataAfter processing, I got over 10,000 (10,905 exactly) people's time use data.
- Basic info about every person (file name: info_2015): age, sex, salary (weekly earning, some people's weekly earning is not avaiable because this information is sensitive), whether they have children or elderly in their family, which day they did the survey(weekday or weekend), location (which state they live) and so on.
- Time use data (file name: activity_2015, around 180,000 data): from 4am - 4am the second day 24-hour activities (I don't knwo why the survey starts at 4am). For example, 4:00am-7:30am: sleeping, 7:30am-8:00am: breakfast, and so on. All the Every person has roughly 16-20 activities per day. All activities are categorized into 18 groups, each is associated with a unique number in the data file.
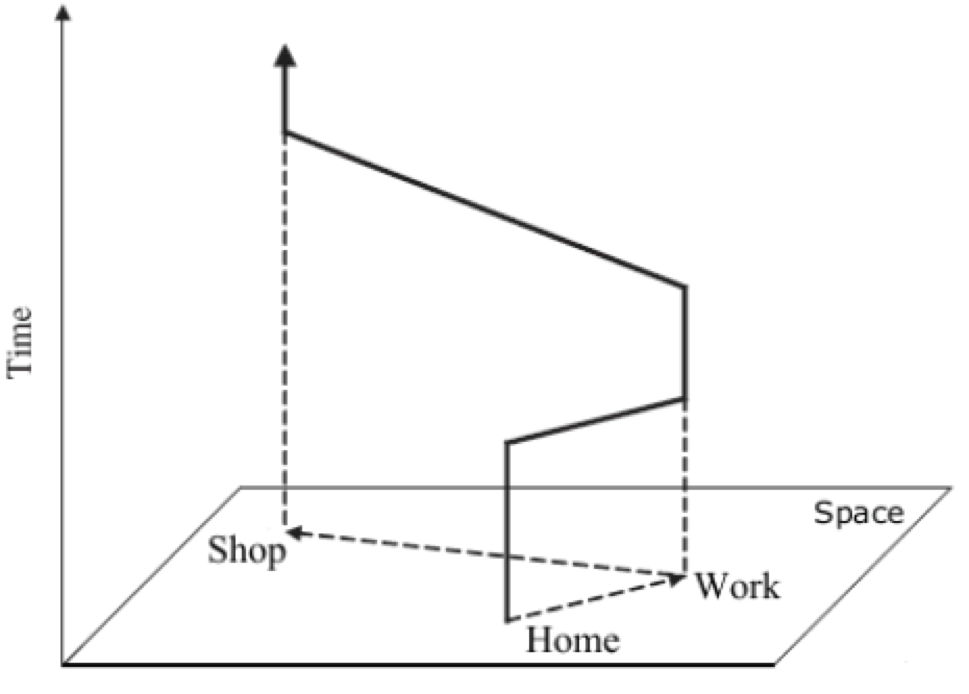
In human geography, we use space-time path to show a person's daily activates with both spatial and temporal dimension (See picture below).
For my project, I decide to visualize the data base on this concept.
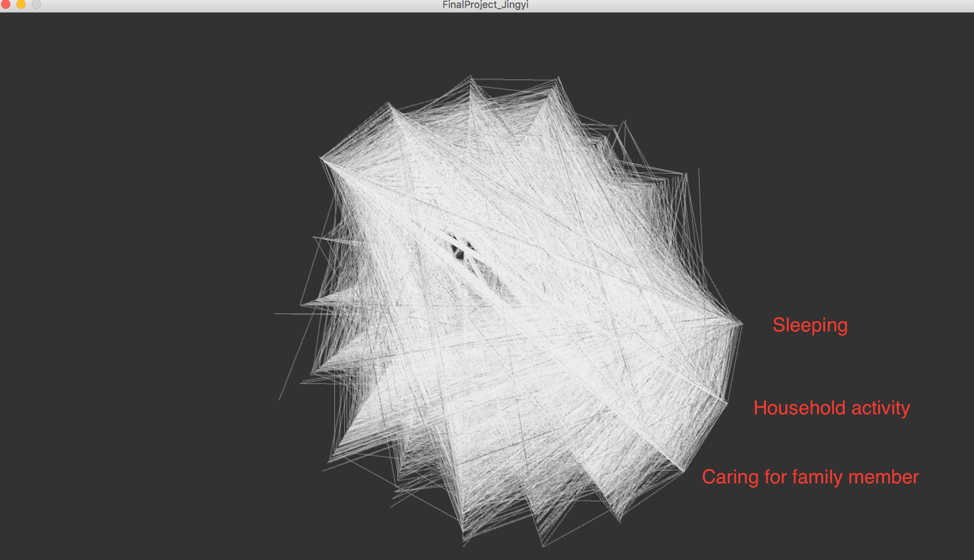
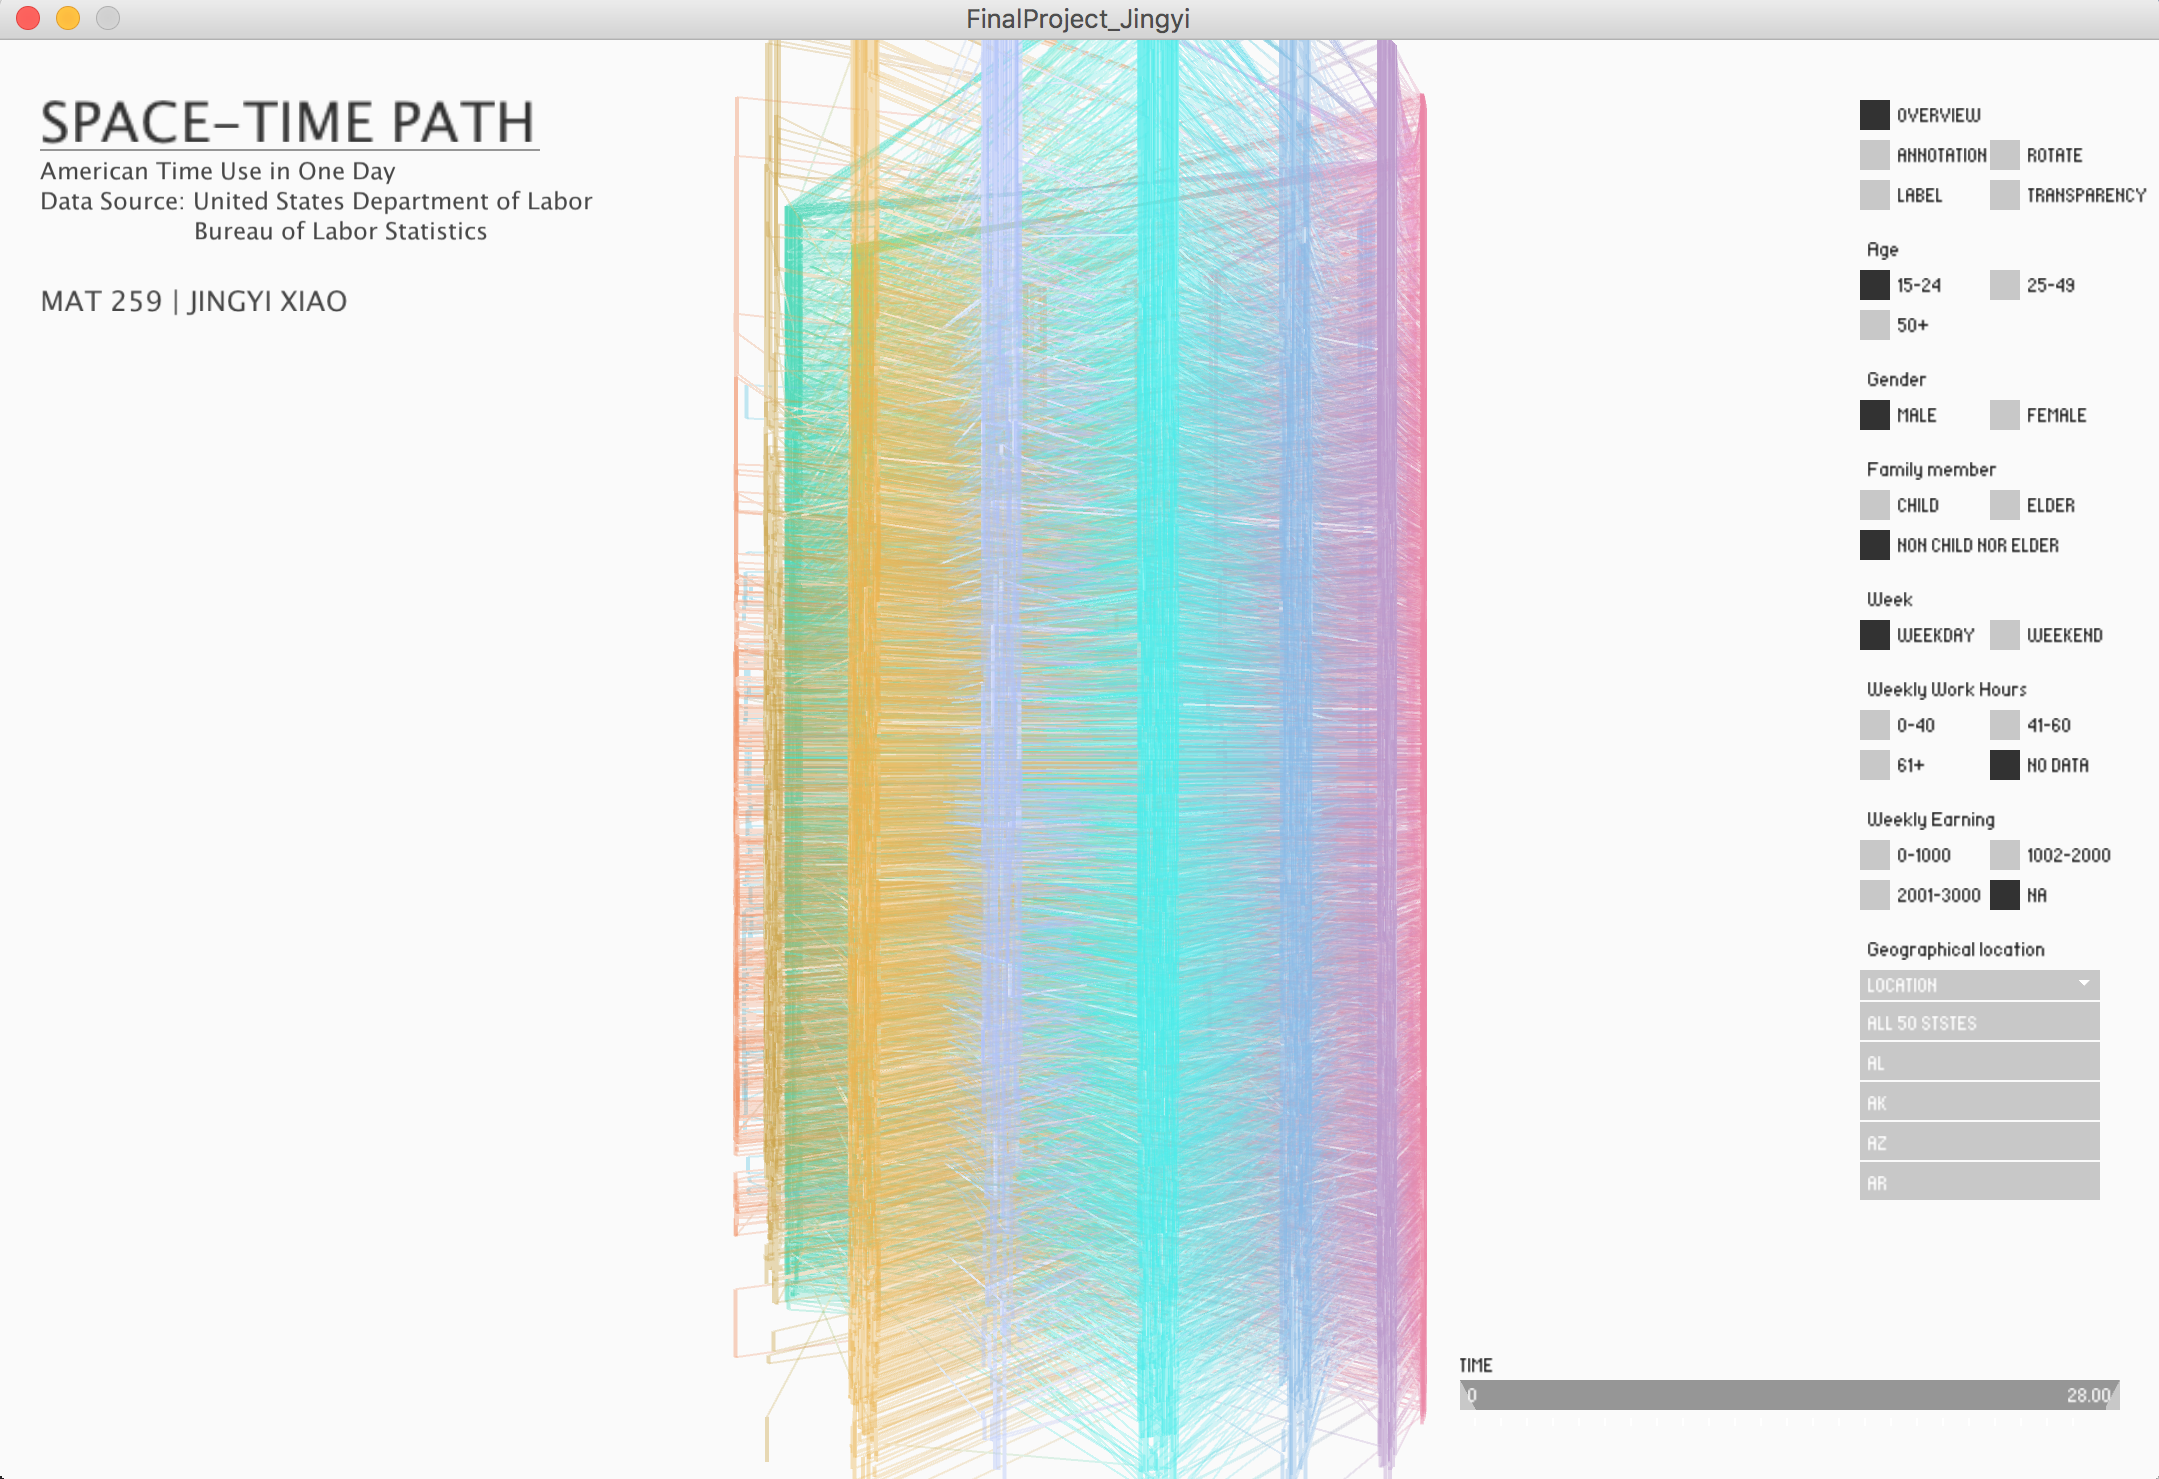
The initial visualization of space-time path is shown as below. The top view has a nice shape as every vertex represents an activity and different activities connect together. But because of the huge amount of data, it's really hard to see the pattern. So I did many adjustments to make the data clearer.
Front view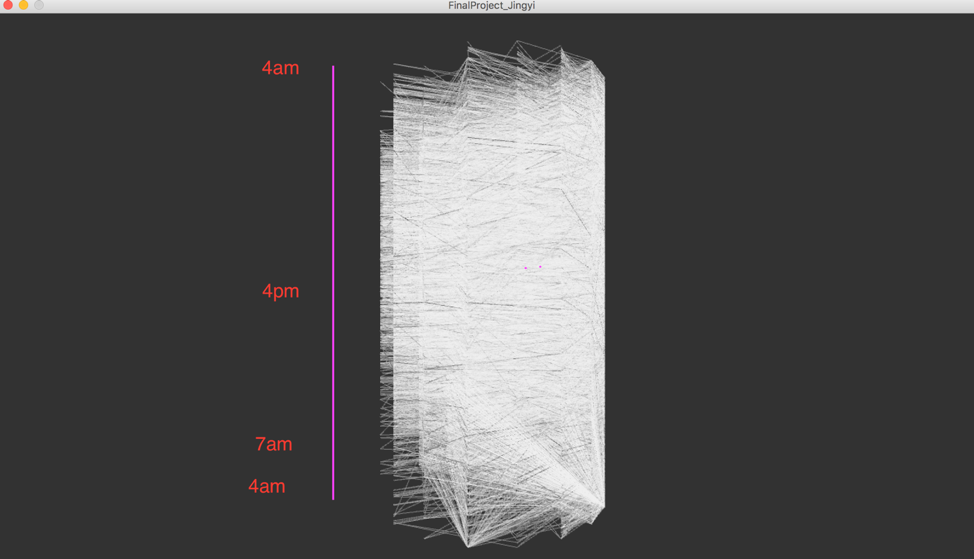
Top view
Overview - Top view (all data)
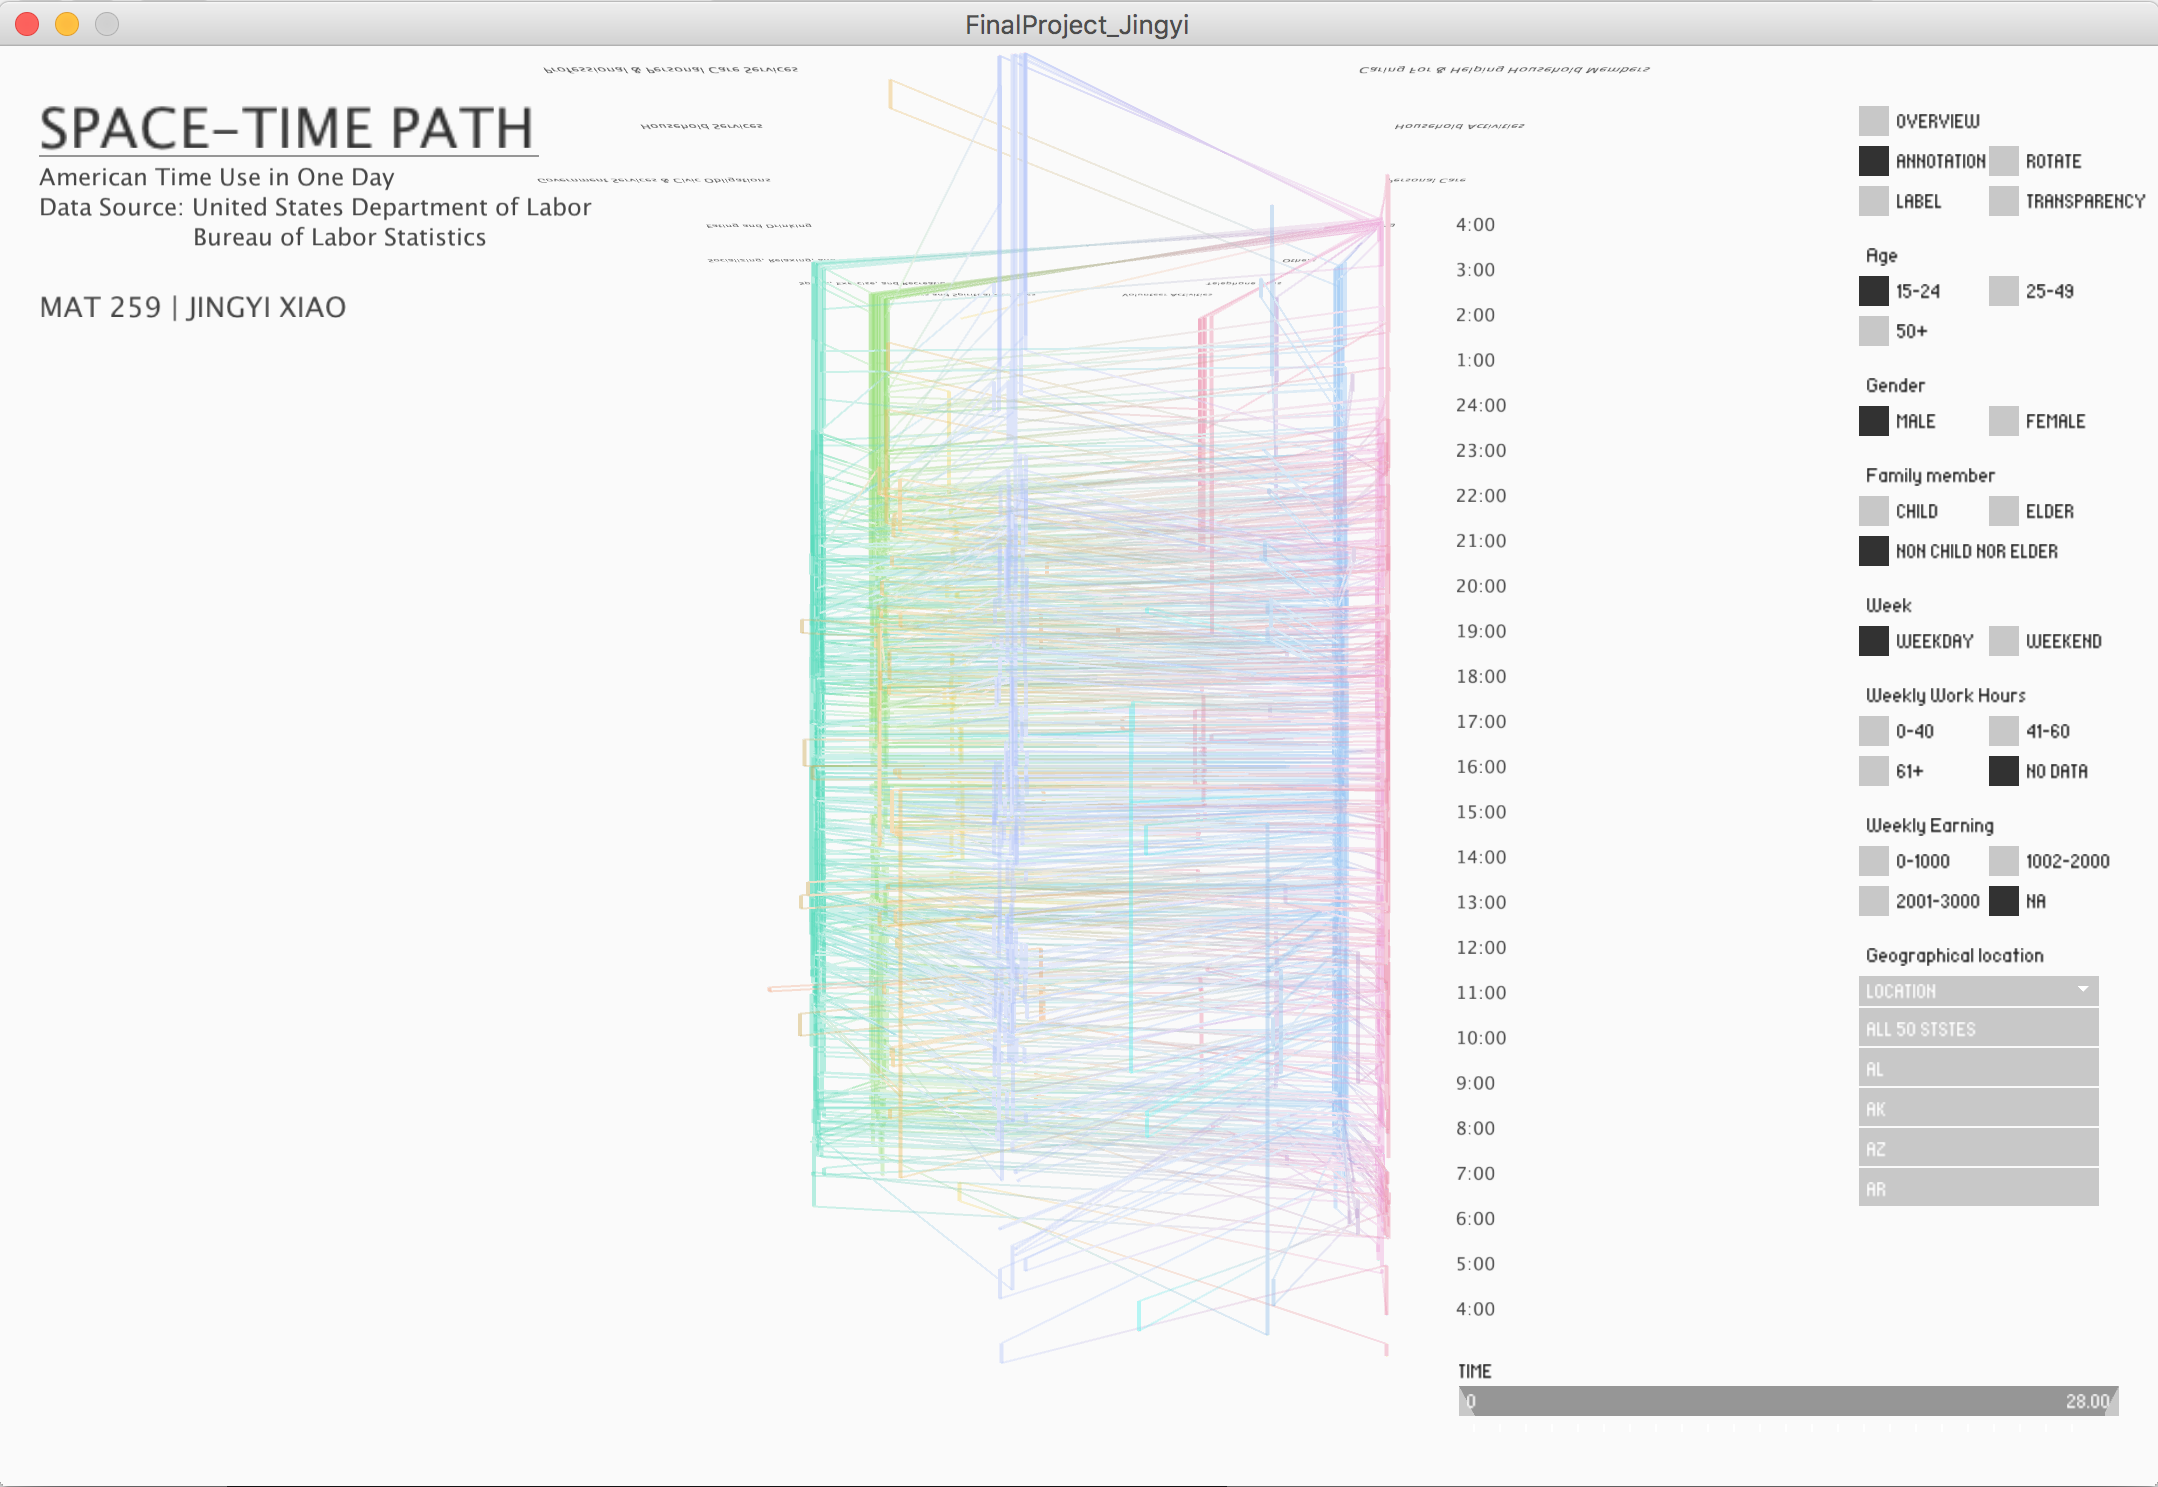
Overview - Front view (all data)
Top view (a subset of data)

Front view (a subset of data)
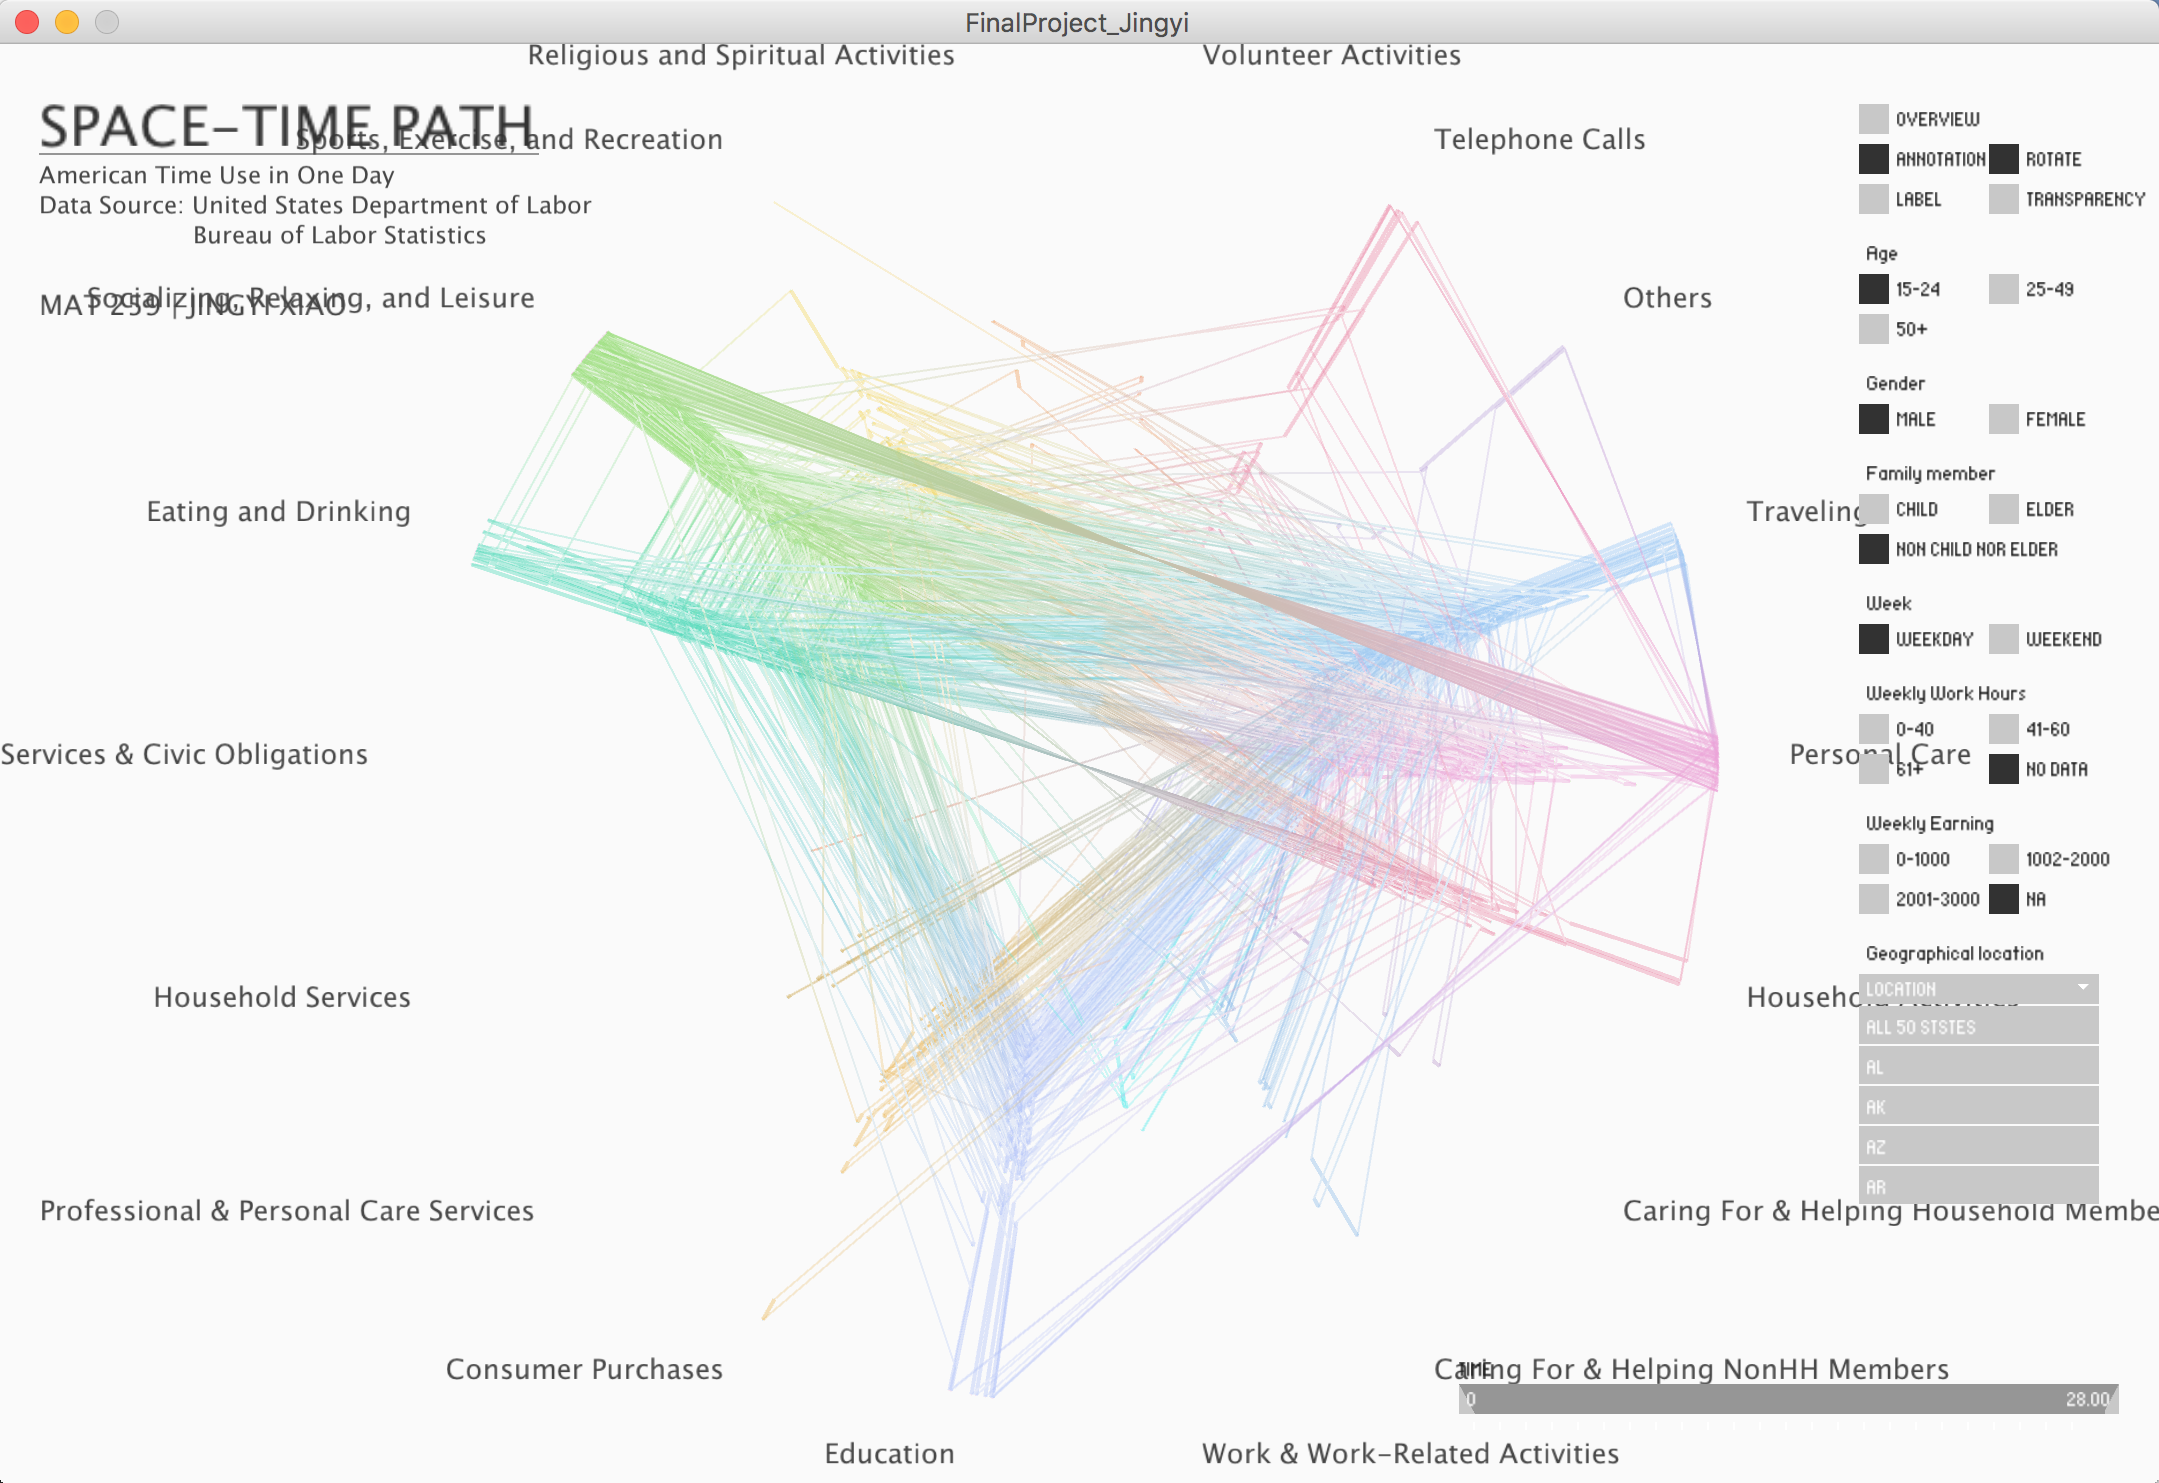
Top view with "annotations" checkbox checked
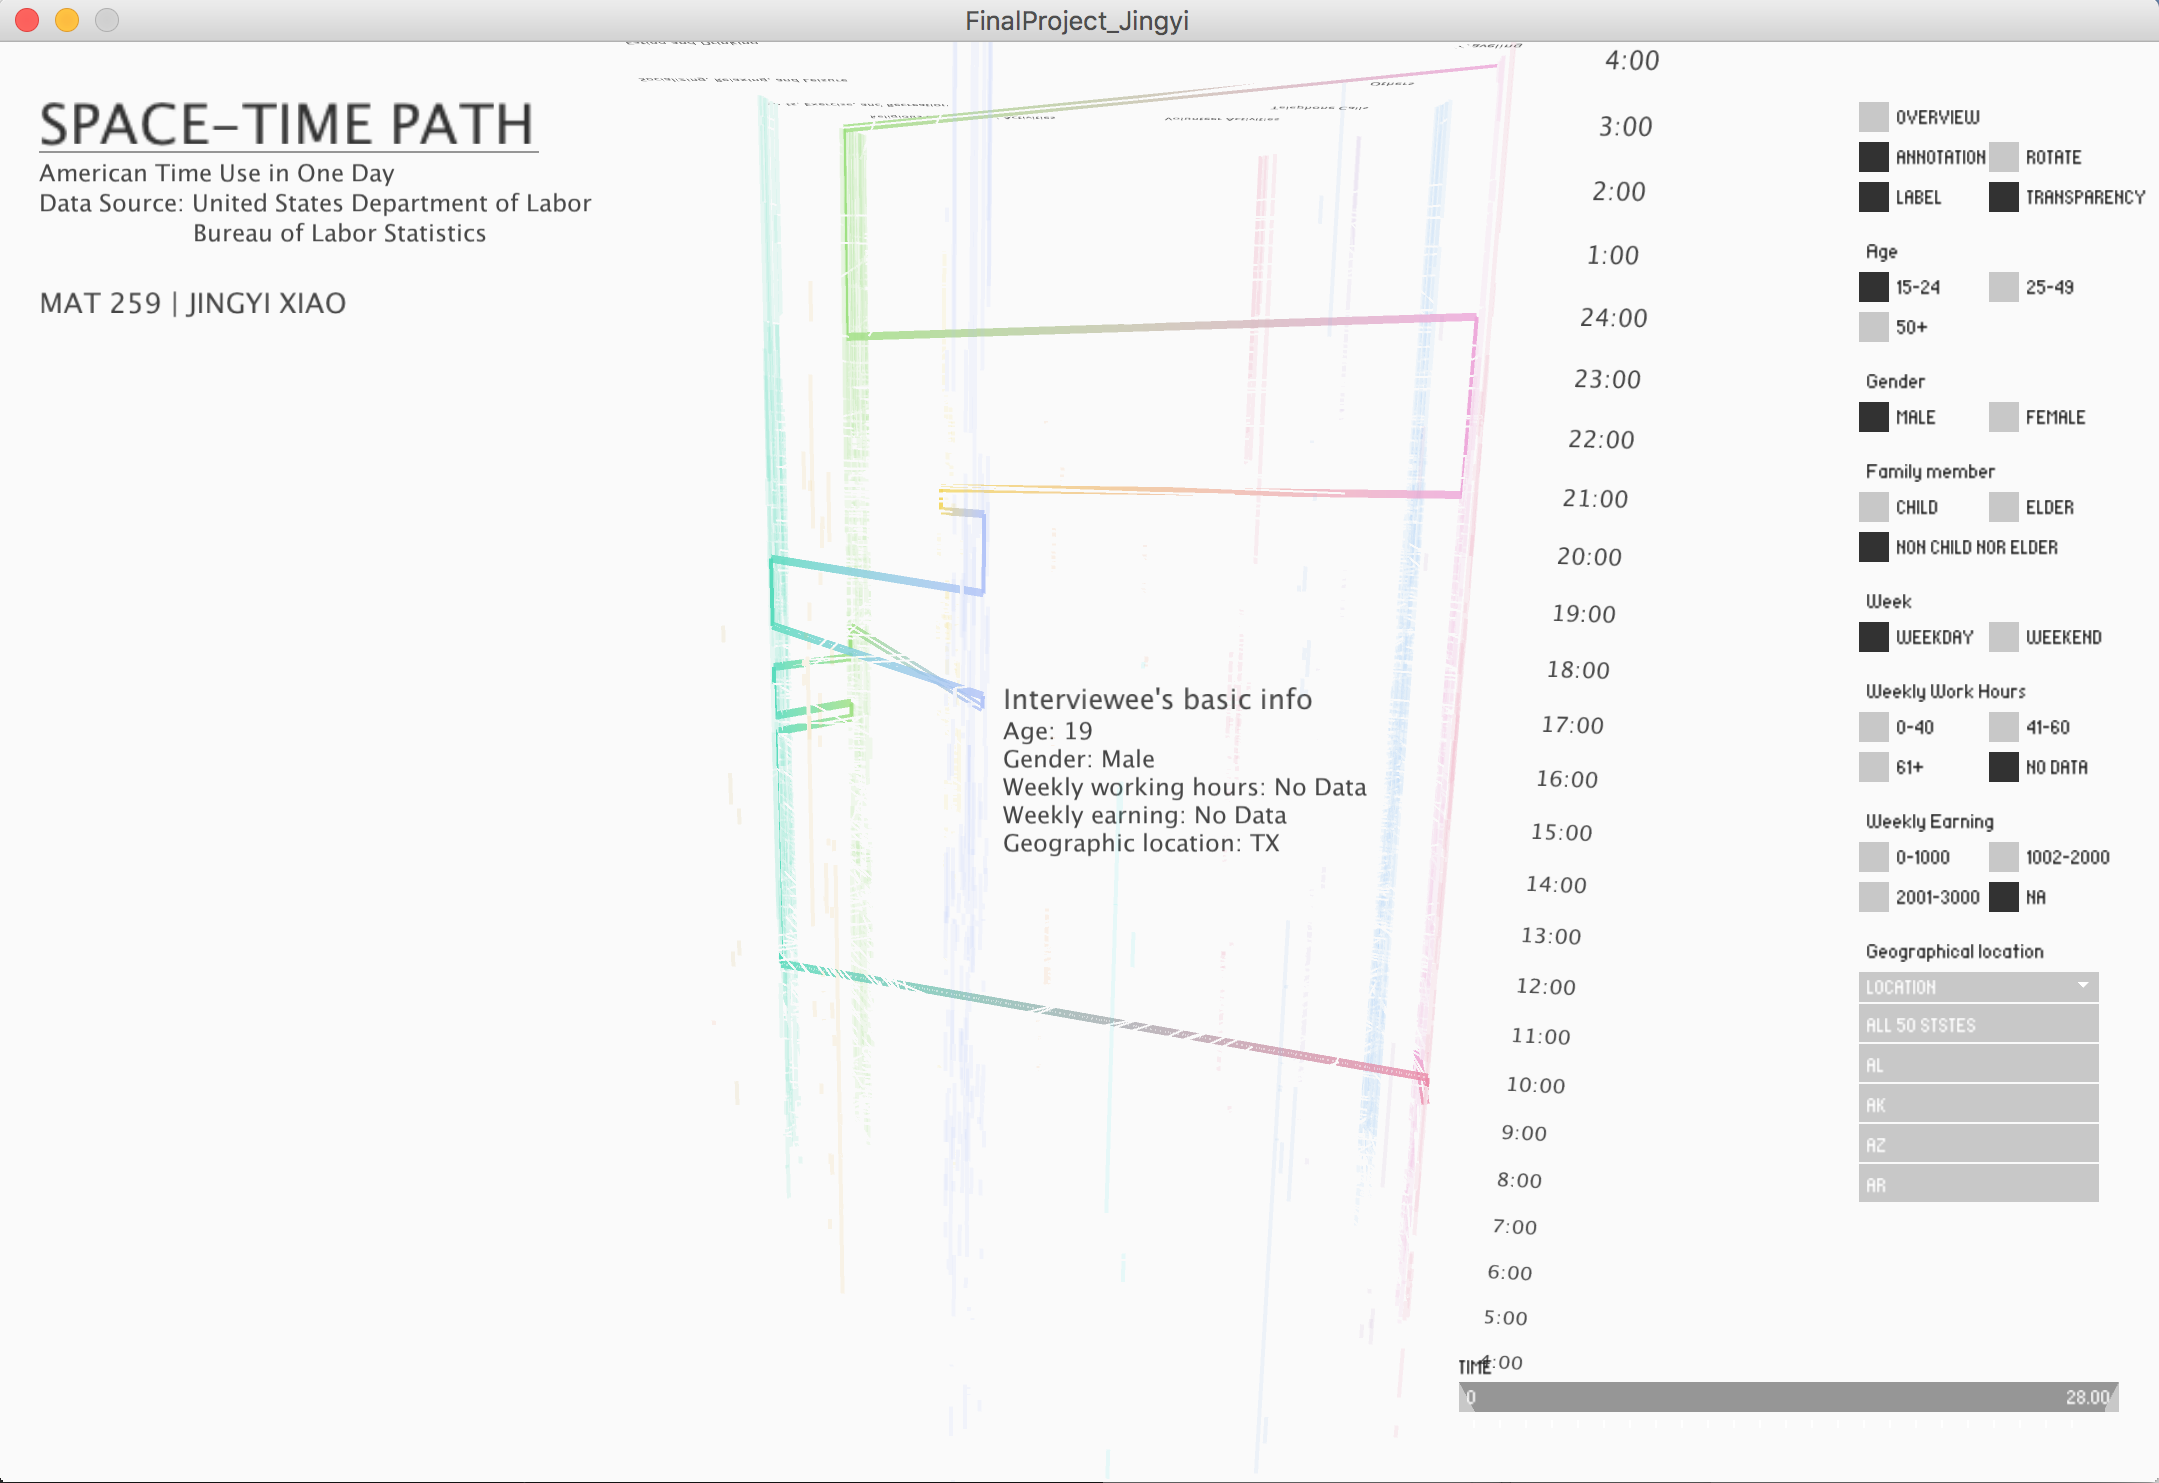
Single view (one person's data) with "transparency" and "label" checkbox checked
Visualization Concept
Top View
Every activity has a random position on an arc(PI/36) from top view. Each arc(different colors) represents an activity, and there are 18 arcs on a circle in total. The more frequent one activity happens, the more complete the arc is (see overview - top view). The thicker the line linking two arcs, the more frequent these two activities happens in sequence.
Front ViewThe 18 colorful bundle of vertical lines represent 18 activities. The denser the lines are, the more frequent this activity happens. The length of every vertical line represents the duration of corresponding activity.
Interaction- Check 'OVERVIEW' checkbox to turn on/off the overview view (This is not default setting, as it's a heavy task for computer to render all the data).
- Check 'ANNOTATION' checkbox to turn on/off the annotation view.
- Check 'ROTATE' checkbox to switch to top/front perspective.
- Check 'LABEL' checkbox to turn on/off the label view (mouse over the vertex of lines to see details).
- Check 'TRANSPARENCY' checkbox to change transparency.
- Check the radio button (age, gender, family member, weekly working hours, geographic location and etc.) to choose a subset of data to show.
- Check 'LOCATION' droplist to choose a state
- Drag 'TIME' buttons to switch to particular time interval (The largest time range is from 4am to 4am (28) the second day, so it's 24 hours total).
There are a lot to be explored. The following are some basic conclusions and inferences based on the visualized result.
For young people (15-24), both males and females spend lots of time on personal care (such as sleeping) and socializing, relaxing and leisure. And part of the time on education. But males spend more time on eating and drinking while females spend more time on telephone calls.
For working cohort (25-49), males don't have many activities (mainly personal care, work and socializing). However, females spend time on household activities, consumer purchases, caring for people, telephone calls. And different from young people, female in working class spend more time on eating and drinking than males.
For old people (50+), the daily activities are the most enriched. Both males and females spend more time on household activities, caring for family members, consumer purchases and religious and spiritual activities. And the time spending on personal care (like sleeping) is less compared to younger people. Females spend more time on religious and spiritual activities and telephone calls compared to males.
Some activities such as personal care, socializing, relaxing and leisure and eating and drinking could happen from day to night, while some activities such as work and work related activities and consumer purchases mostly happen during the day.
Females in all age tend to spend more telephone calls than males. :-)
The data reveals definitely more than the above. Waiting to be found.