The Life and Death of the Sun
MAT 259, 2016
Jared Brooks
Concept
For my final project I used data from my own research. I used the stellar evolution software MESA to simulate a 1-dimensional model of a star with the same mass as the Sun from its birth to its death. I recorded the burning and mixing regions in the model, along with the mass, radius, wind rate, surface temperature, and the elemental abundances.
I wanted to show this as some sort of animation for two reasons: 1, that I am trying to convey a sense of evolution and time passing, and 2, there is a lot of data and the computer lags if it tries to display all of it at once.
I wanted to show this as some sort of animation for two reasons: 1, that I am trying to convey a sense of evolution and time passing, and 2, there is a lot of data and the computer lags if it tries to display all of it at once.
Preliminary sketches
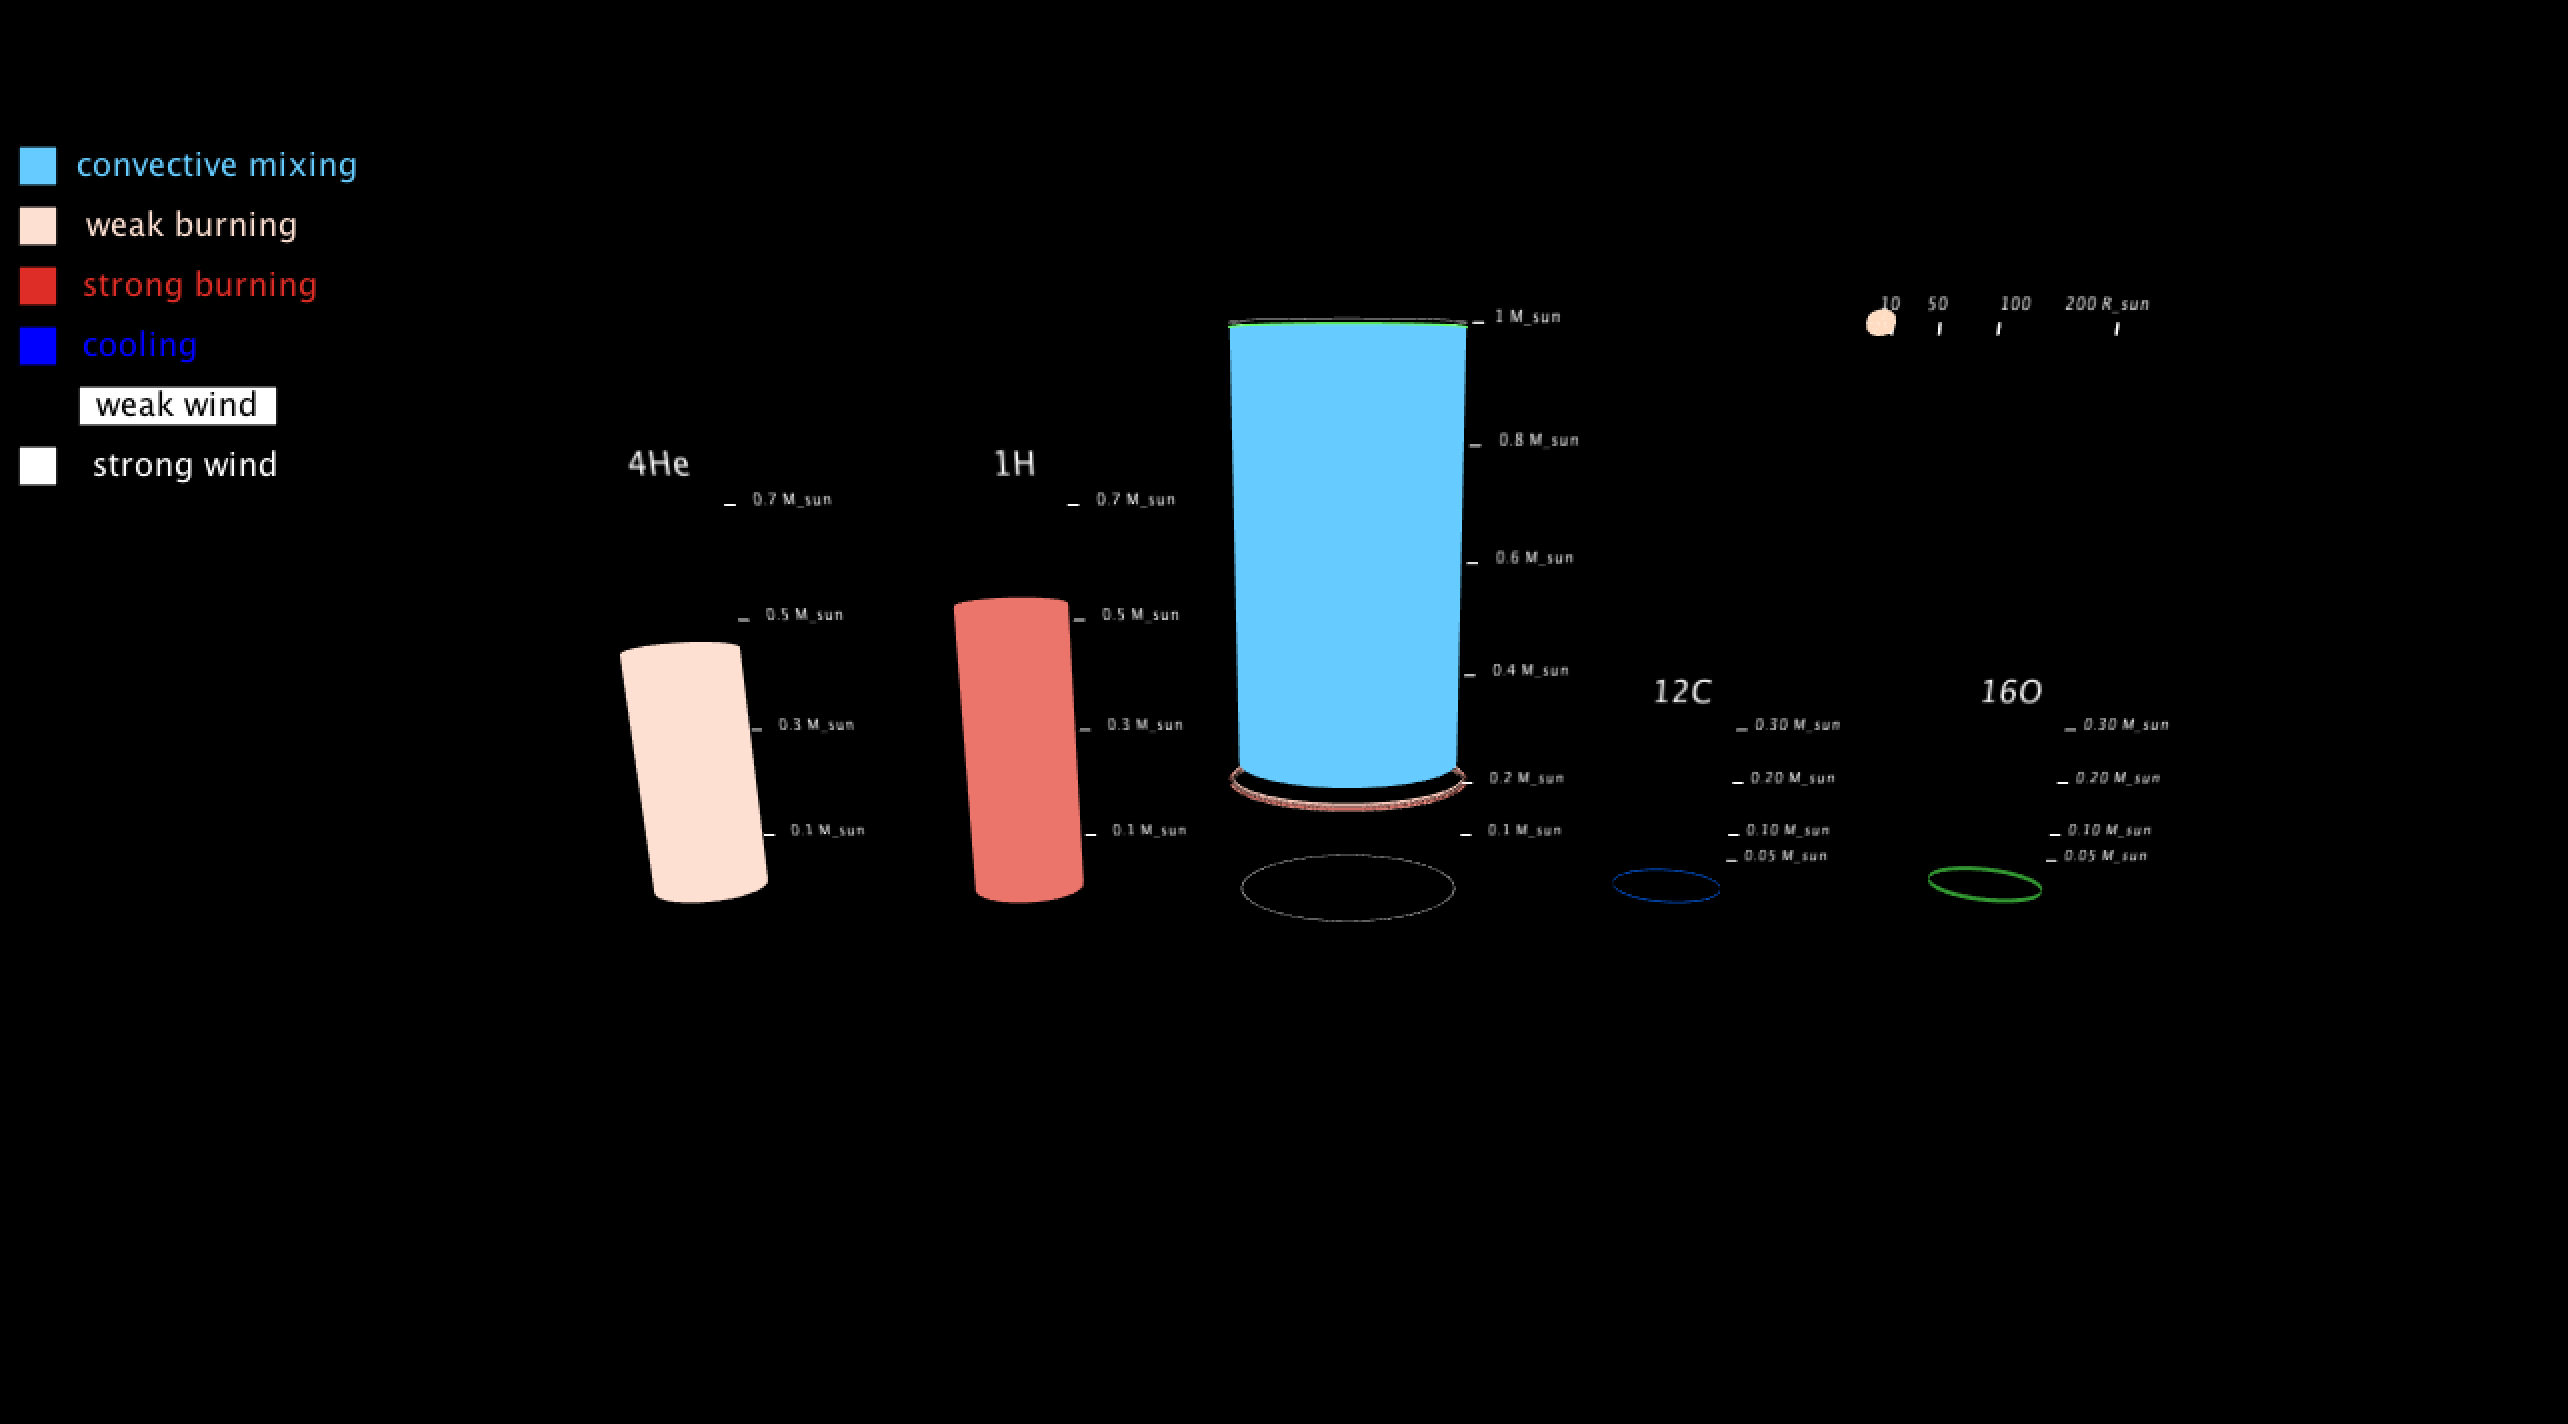
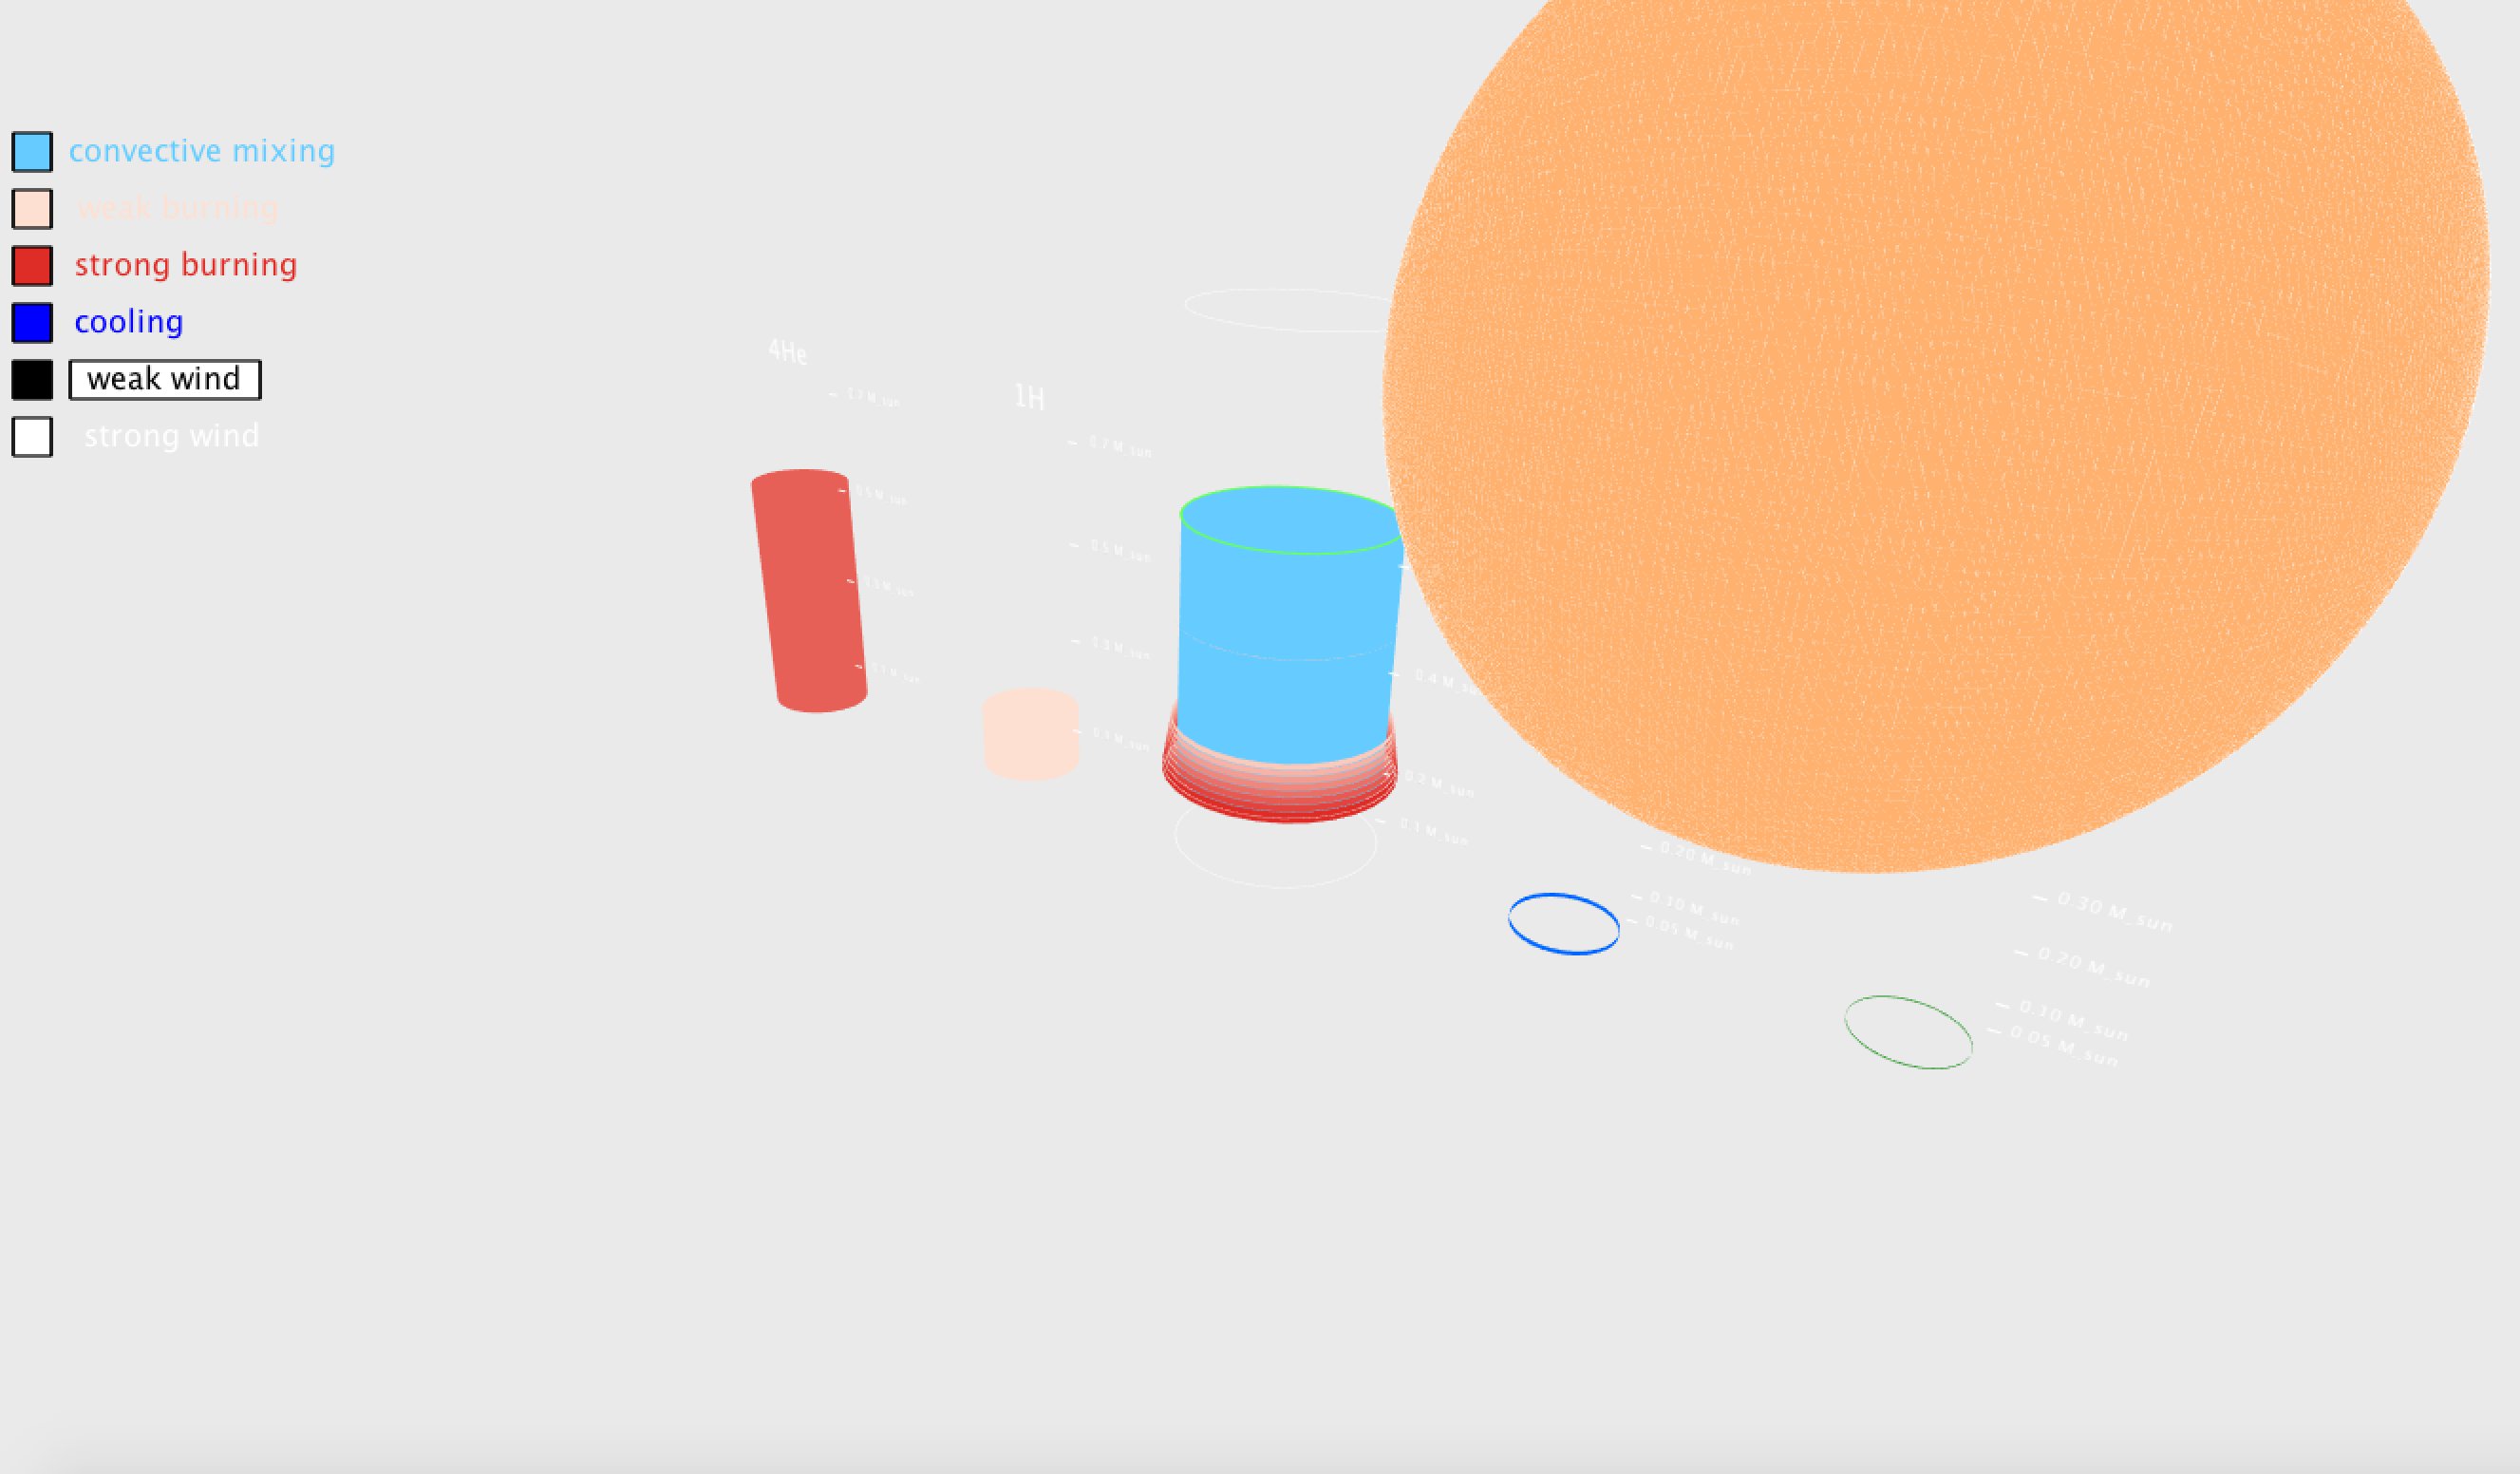
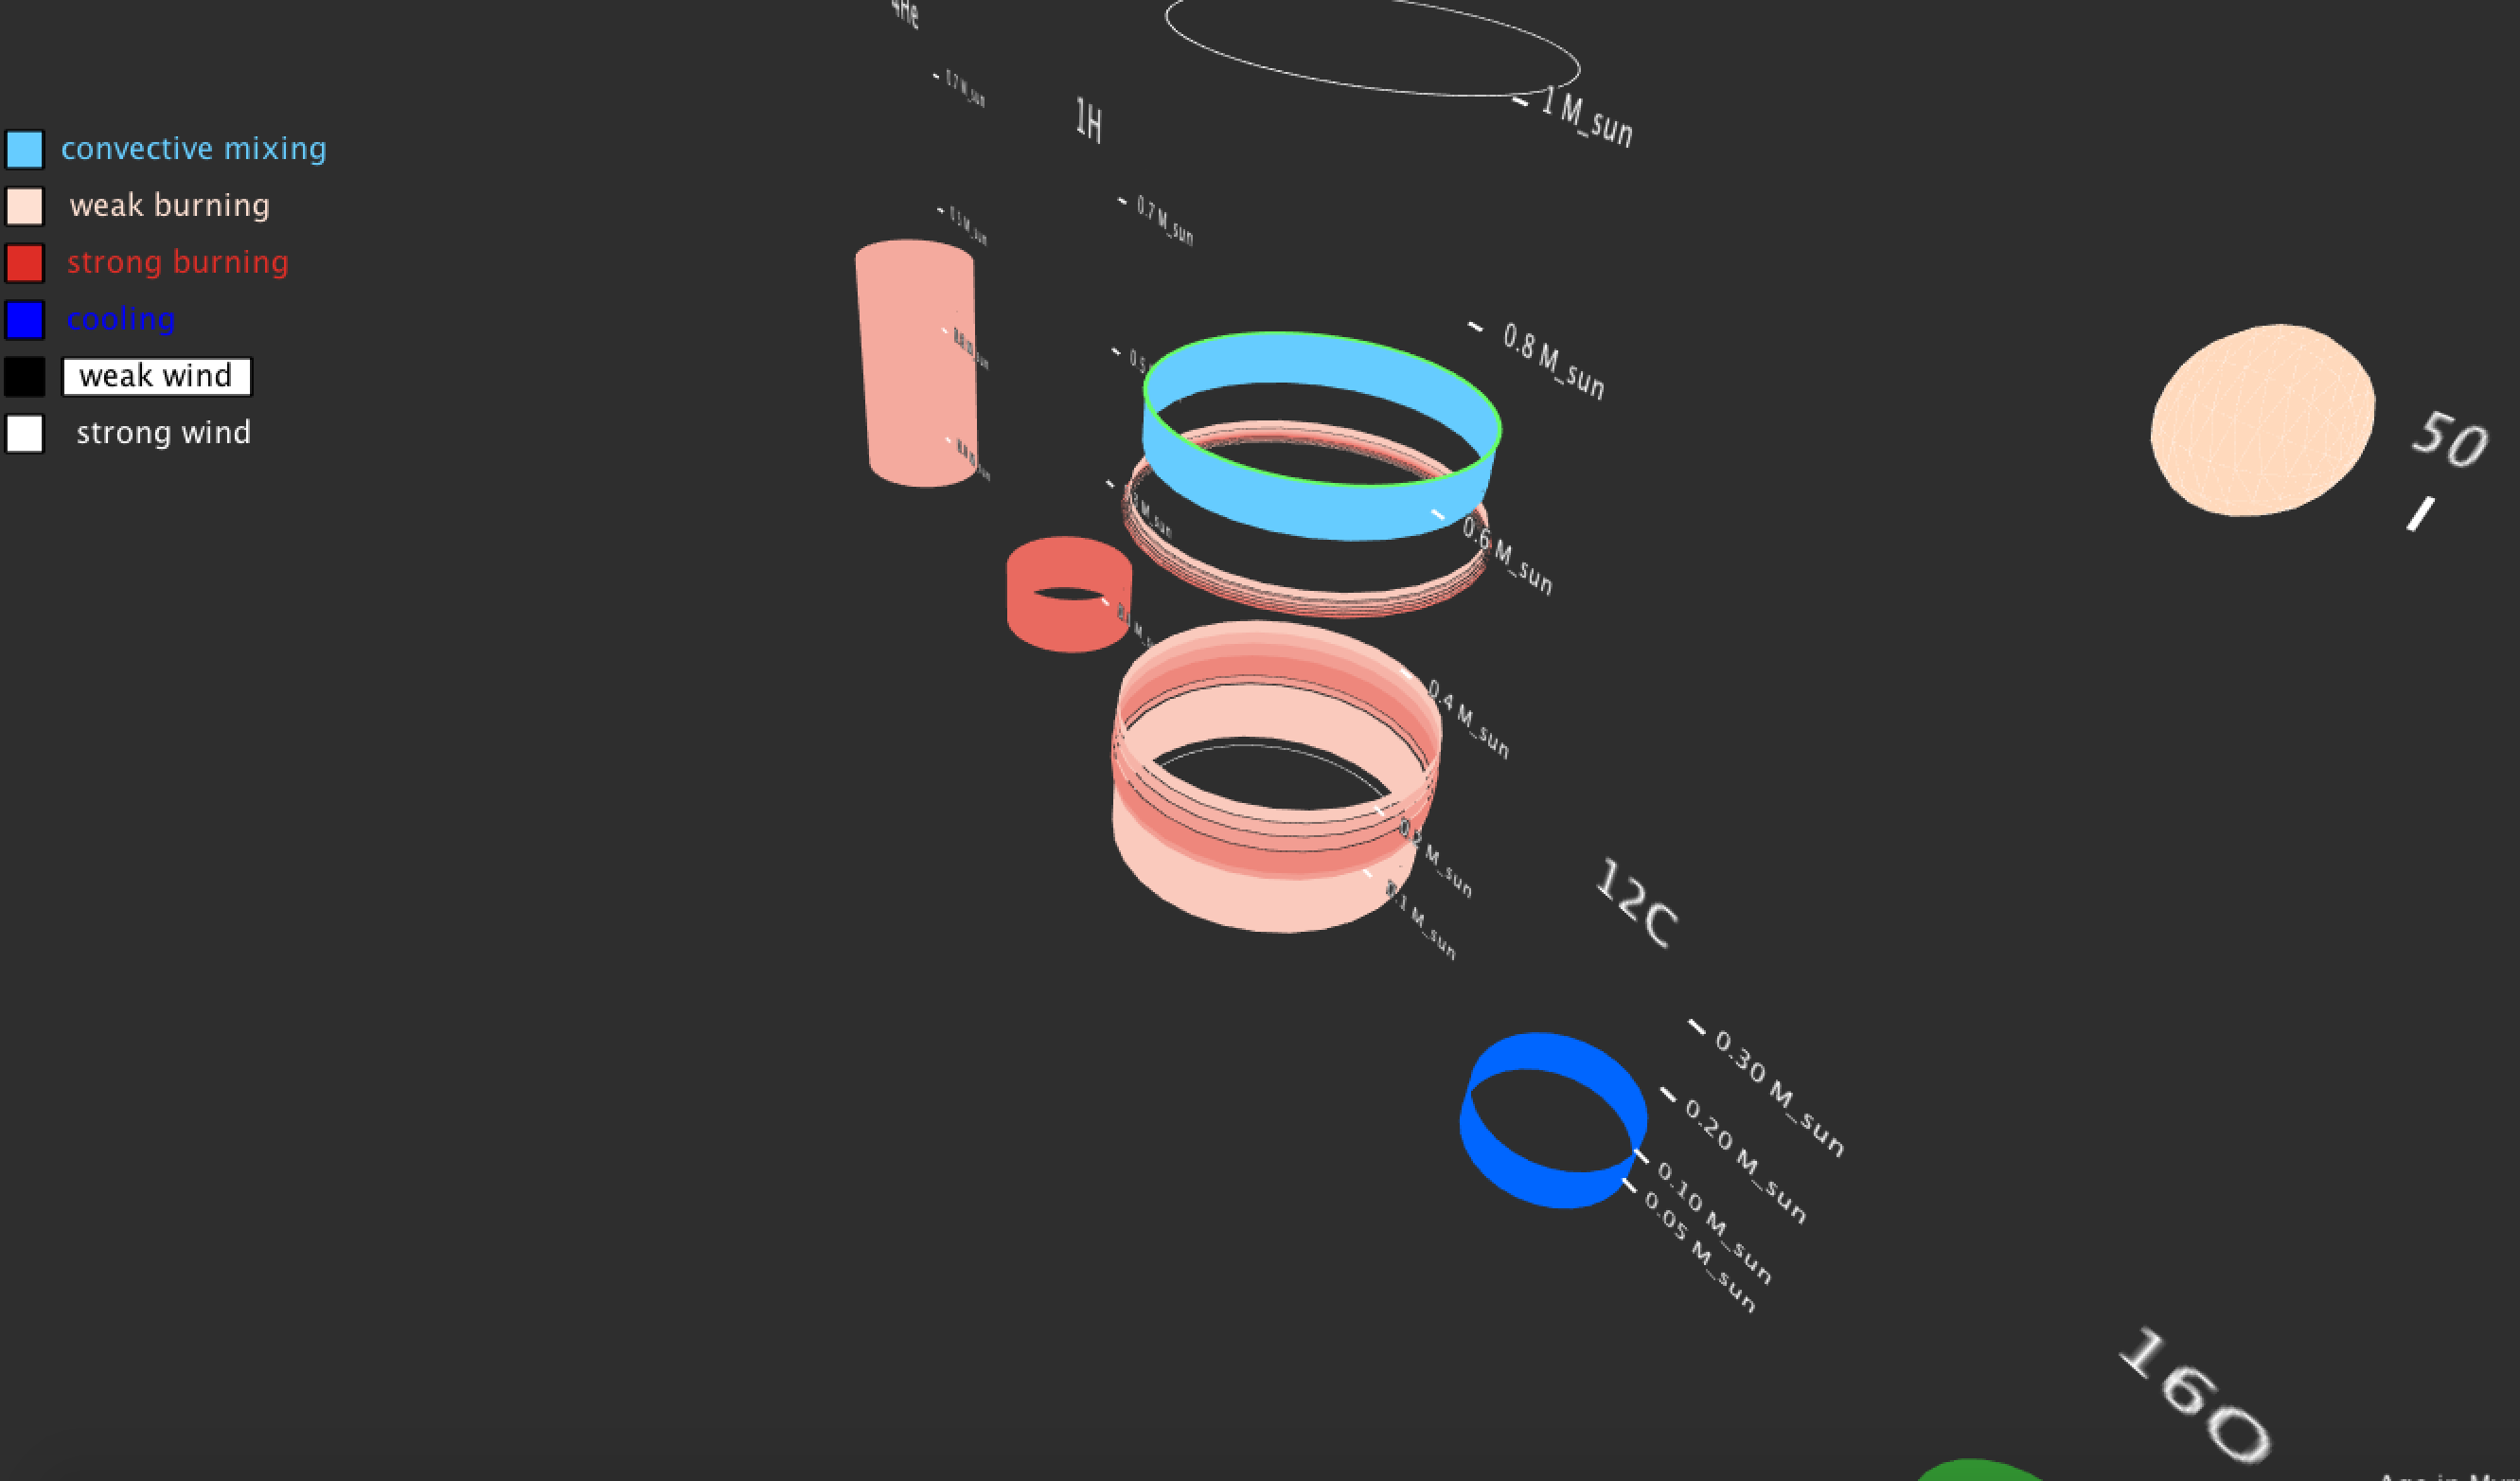
I went through a few different visualizations before landing on my final idea. The first was based off cylinders. The center cylinder showed the mixing and burning regions by mass coordinate, with the main abundances as smaller cylinders on the sides that were colored by the burning rate of that element. The background was black if there was weak-to-no wind and white if there is a strong wind. There was also a sound aspect that I got rid of because it was really annoying.
Process
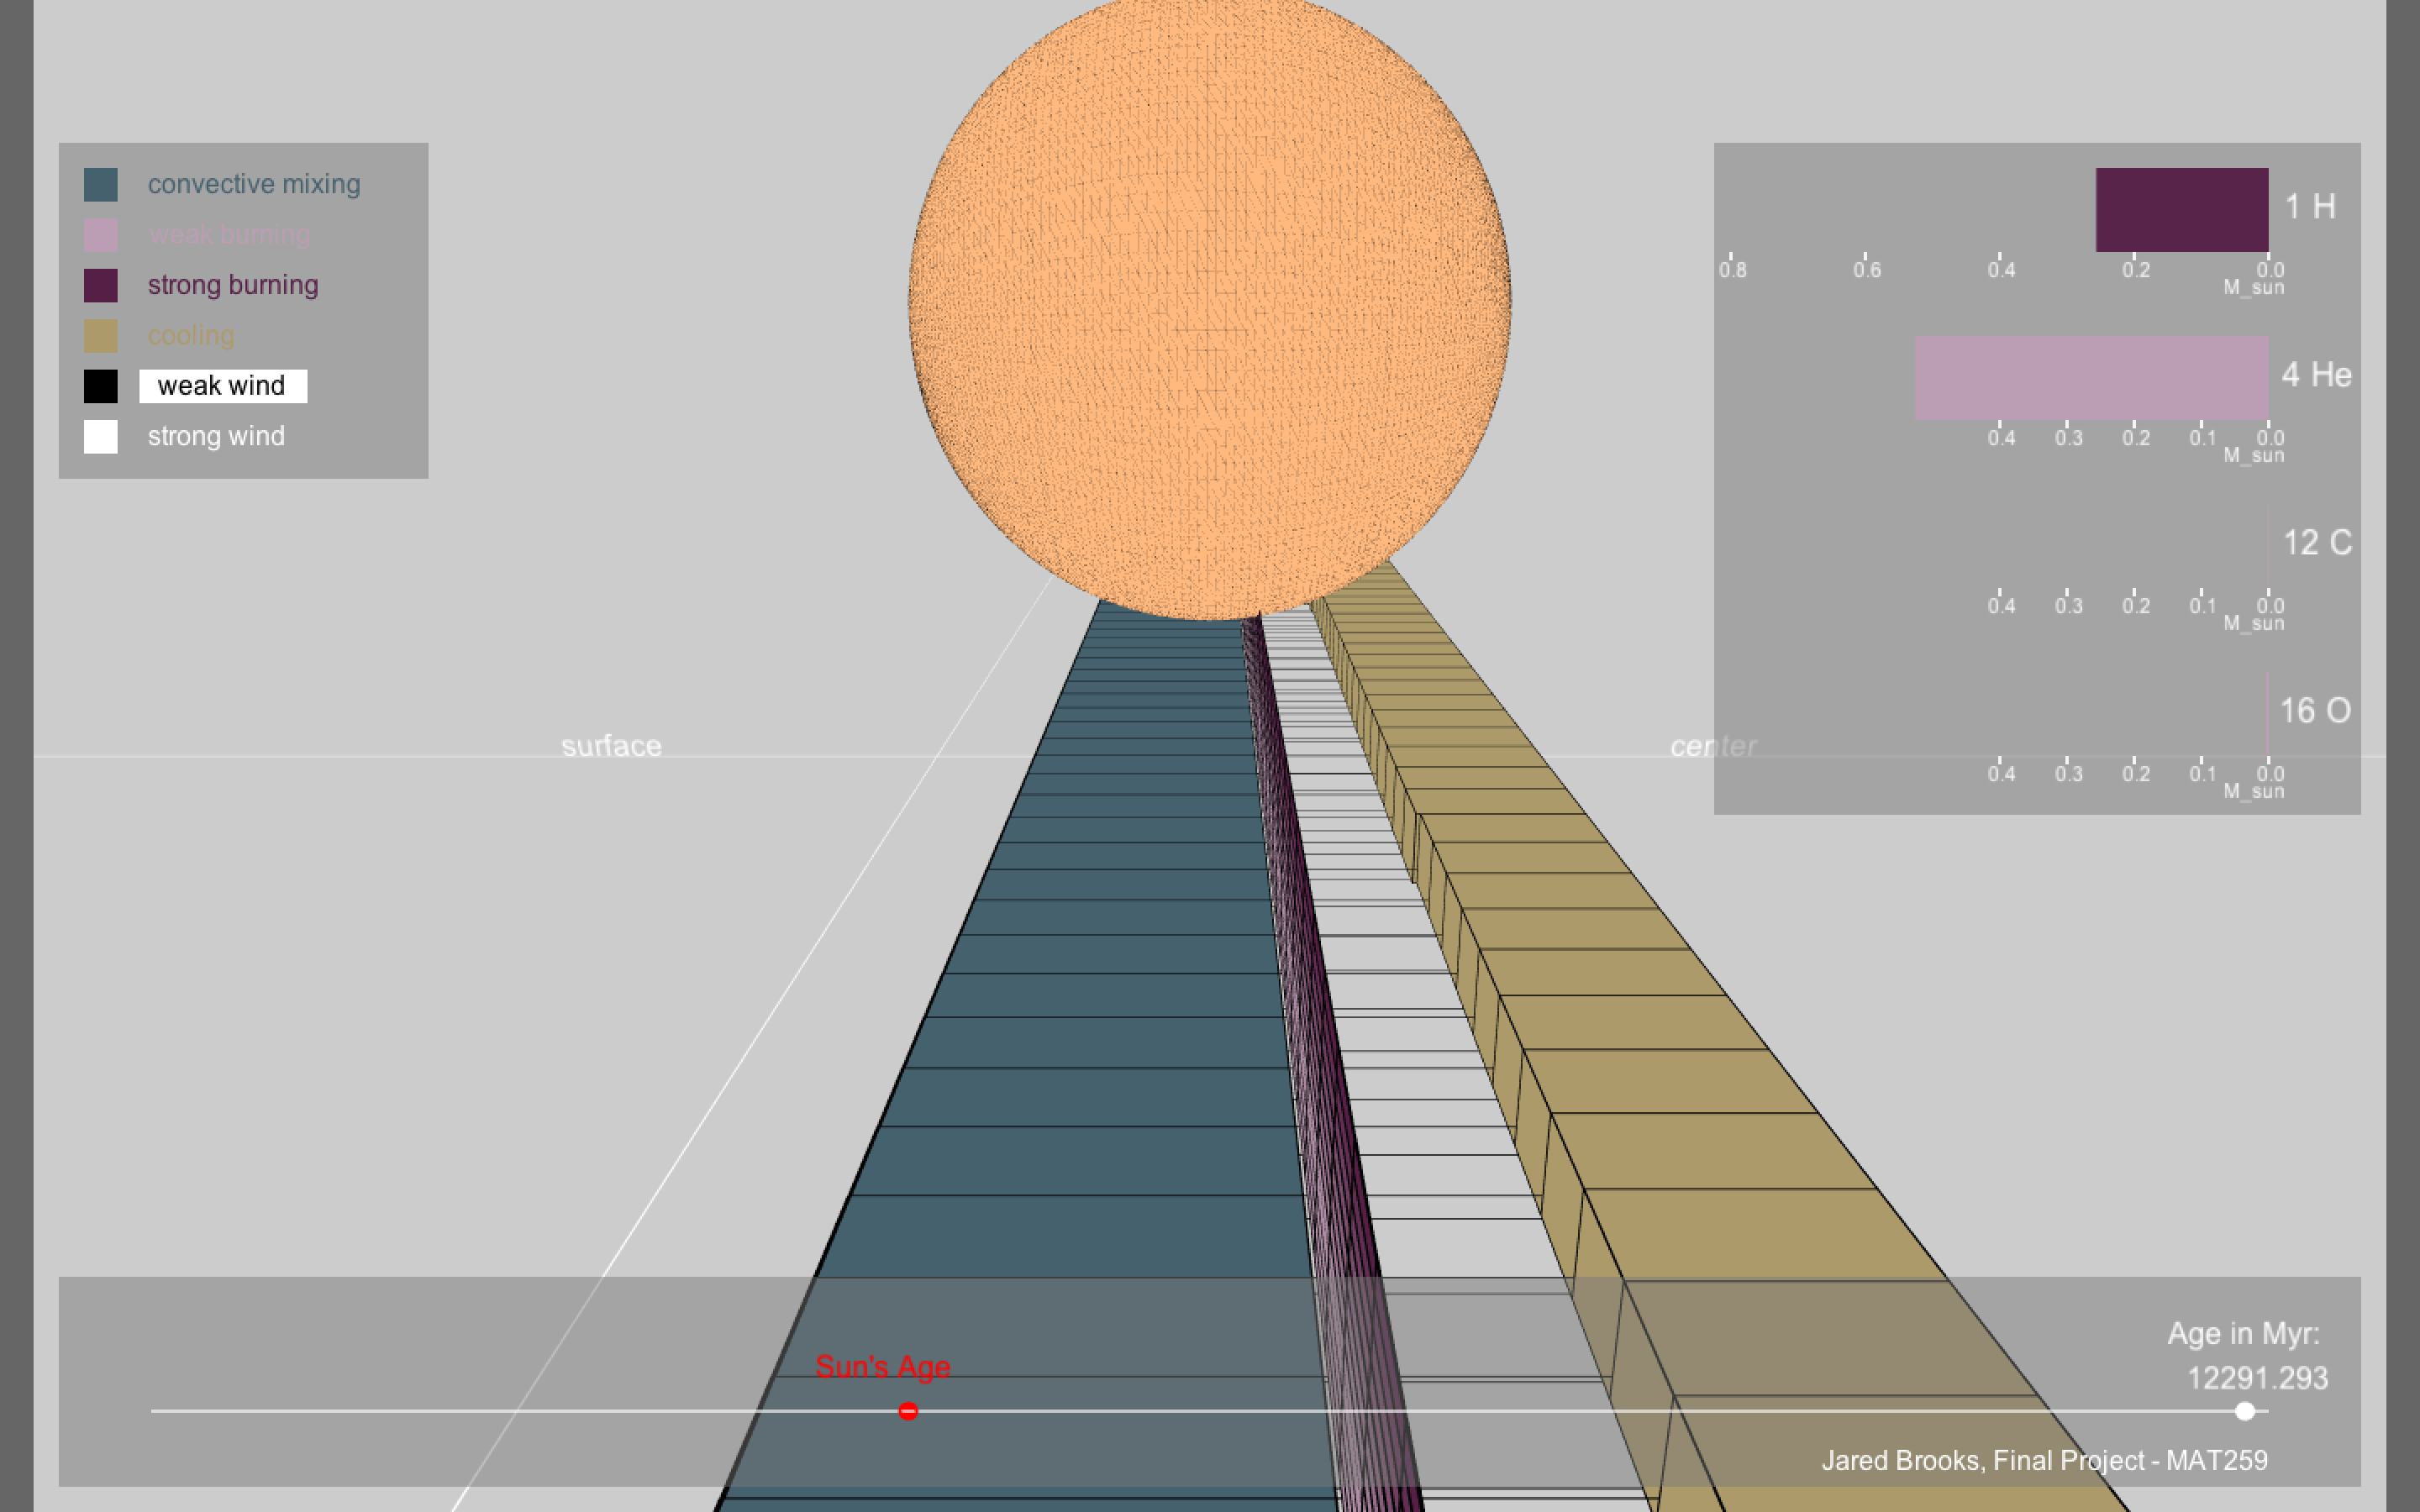
After going through a couple more ideas, I settled on the visualization shown below where the mixing and burning regions are shown as rectangular boxes in mass coordinate from center on the right to surface on the left, and each timestep is laid along the y-axis. Since not all the data can fit in the visualization at one time without significant lag, I have the boxes moving towards the viewer and only render 200 timesteps at a time. The surface is capped by a yellow square to show the mass of the model as its changes through its evolution.
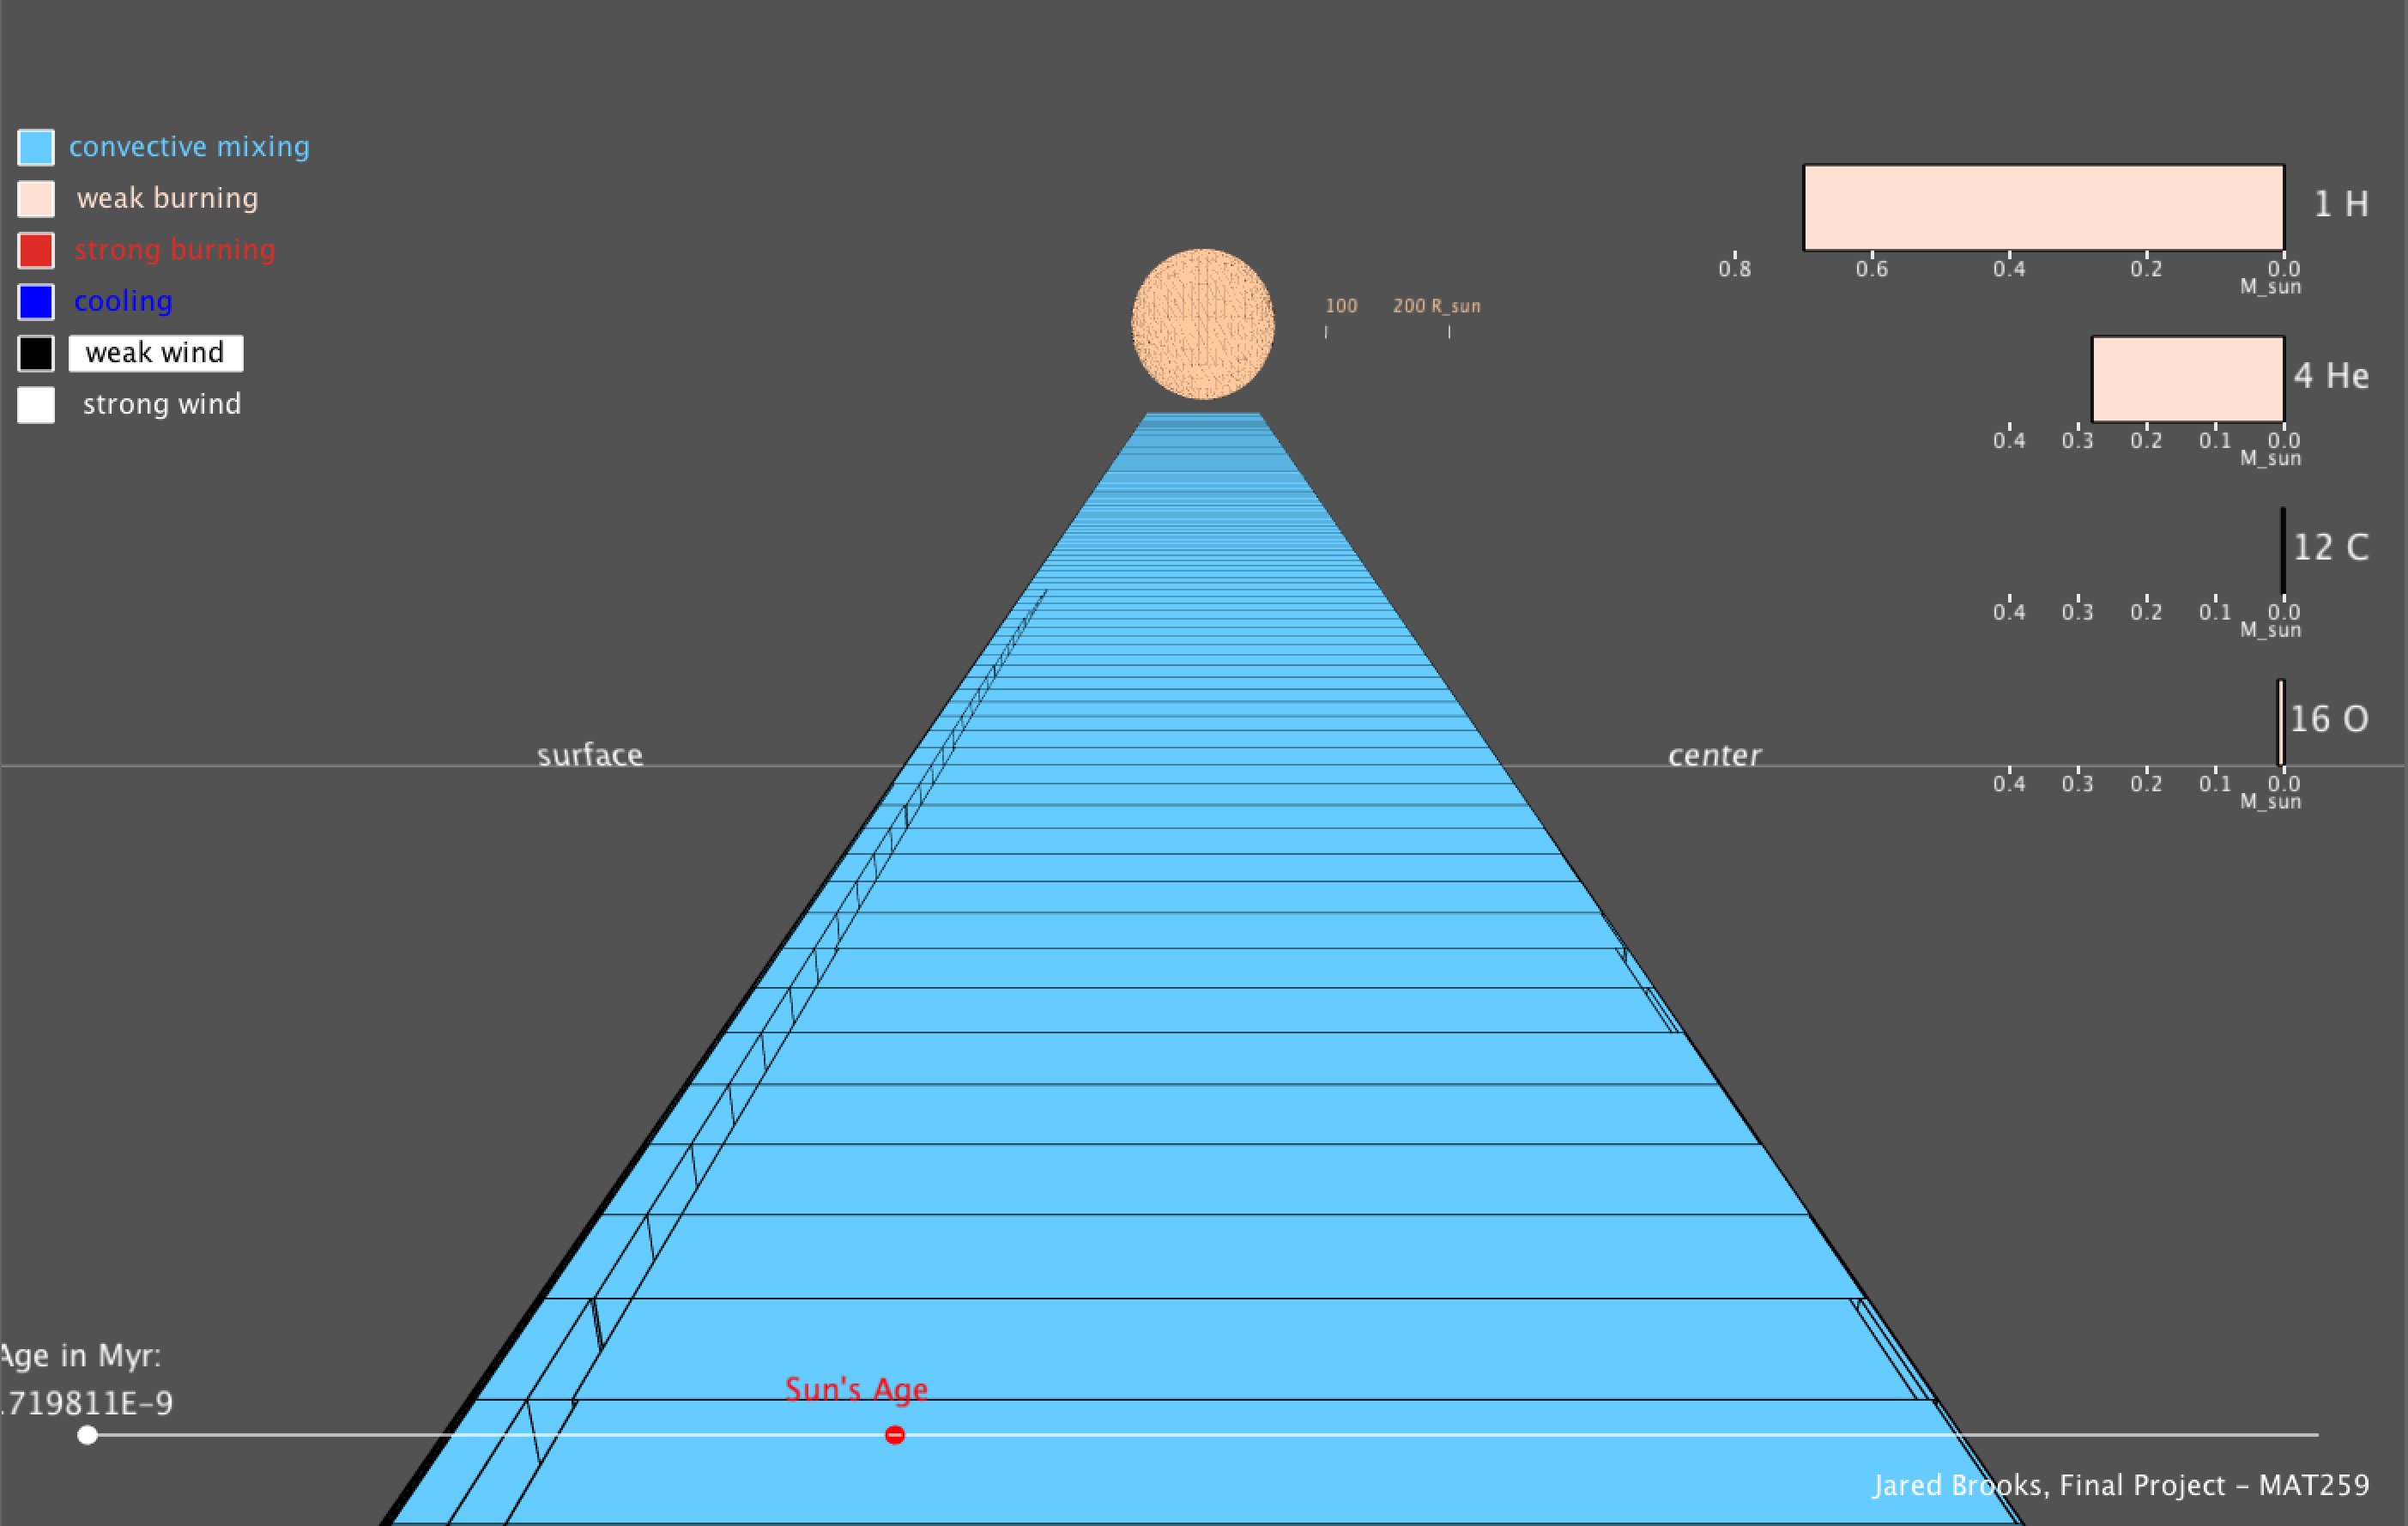
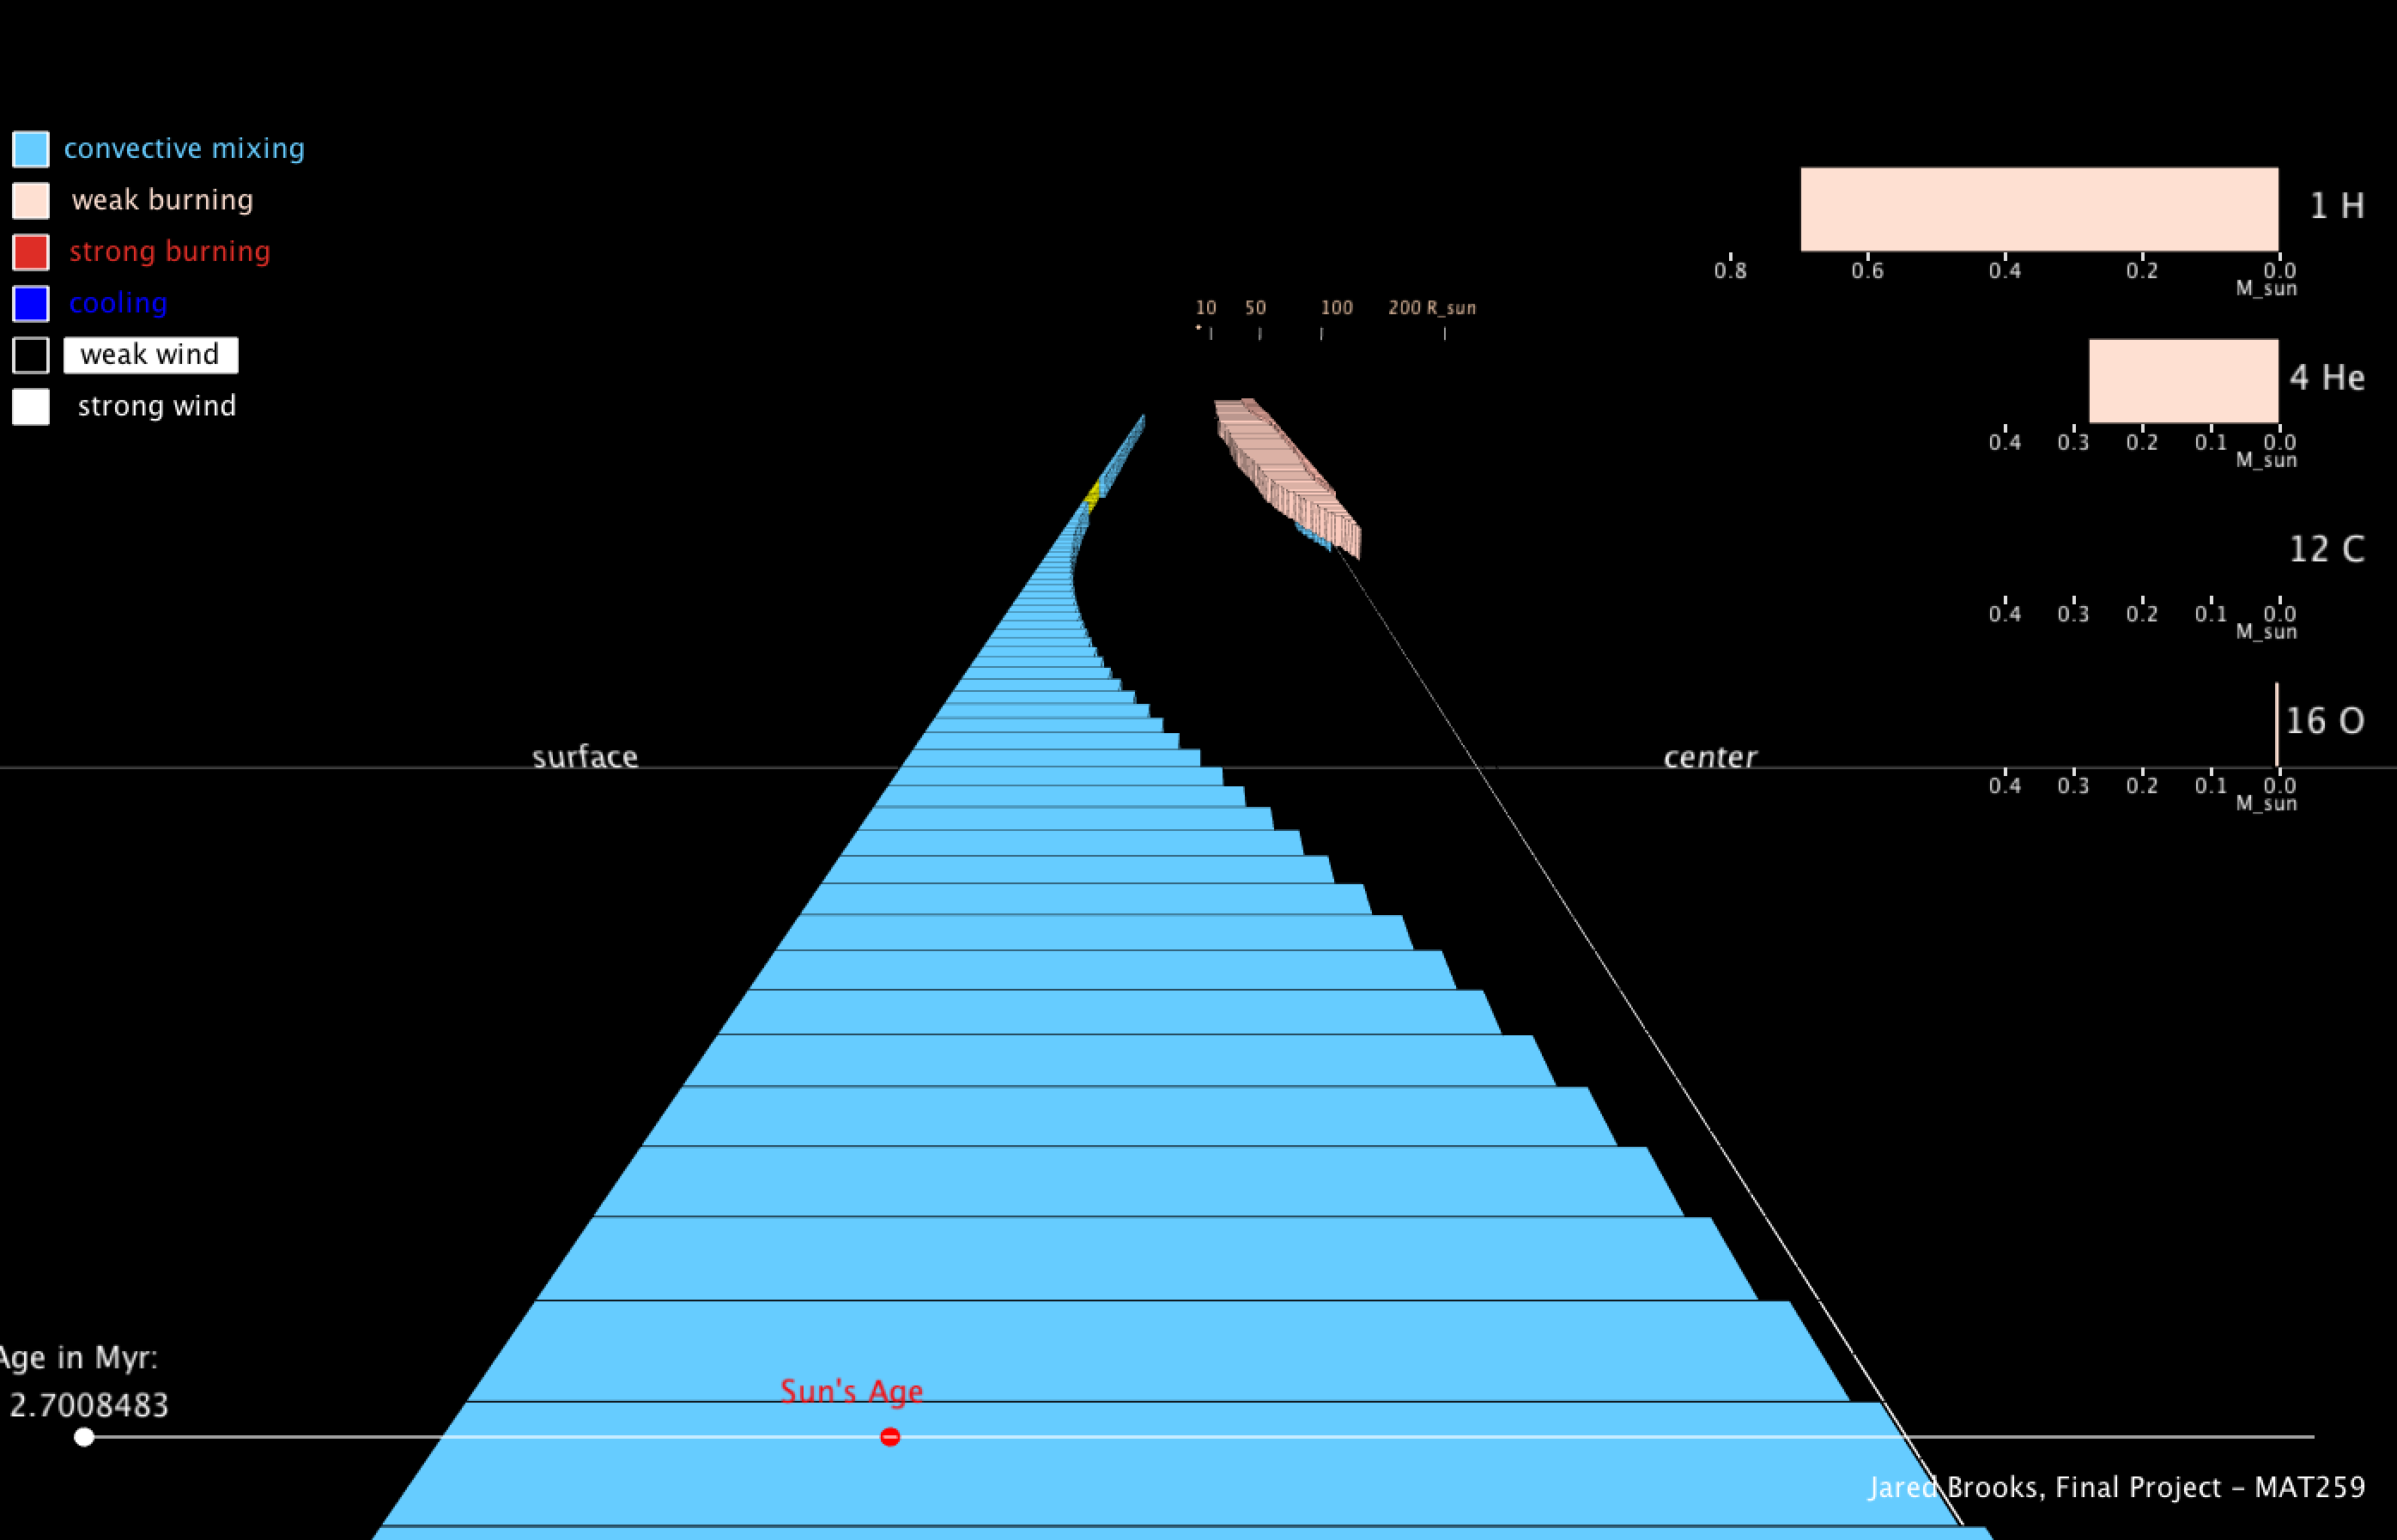
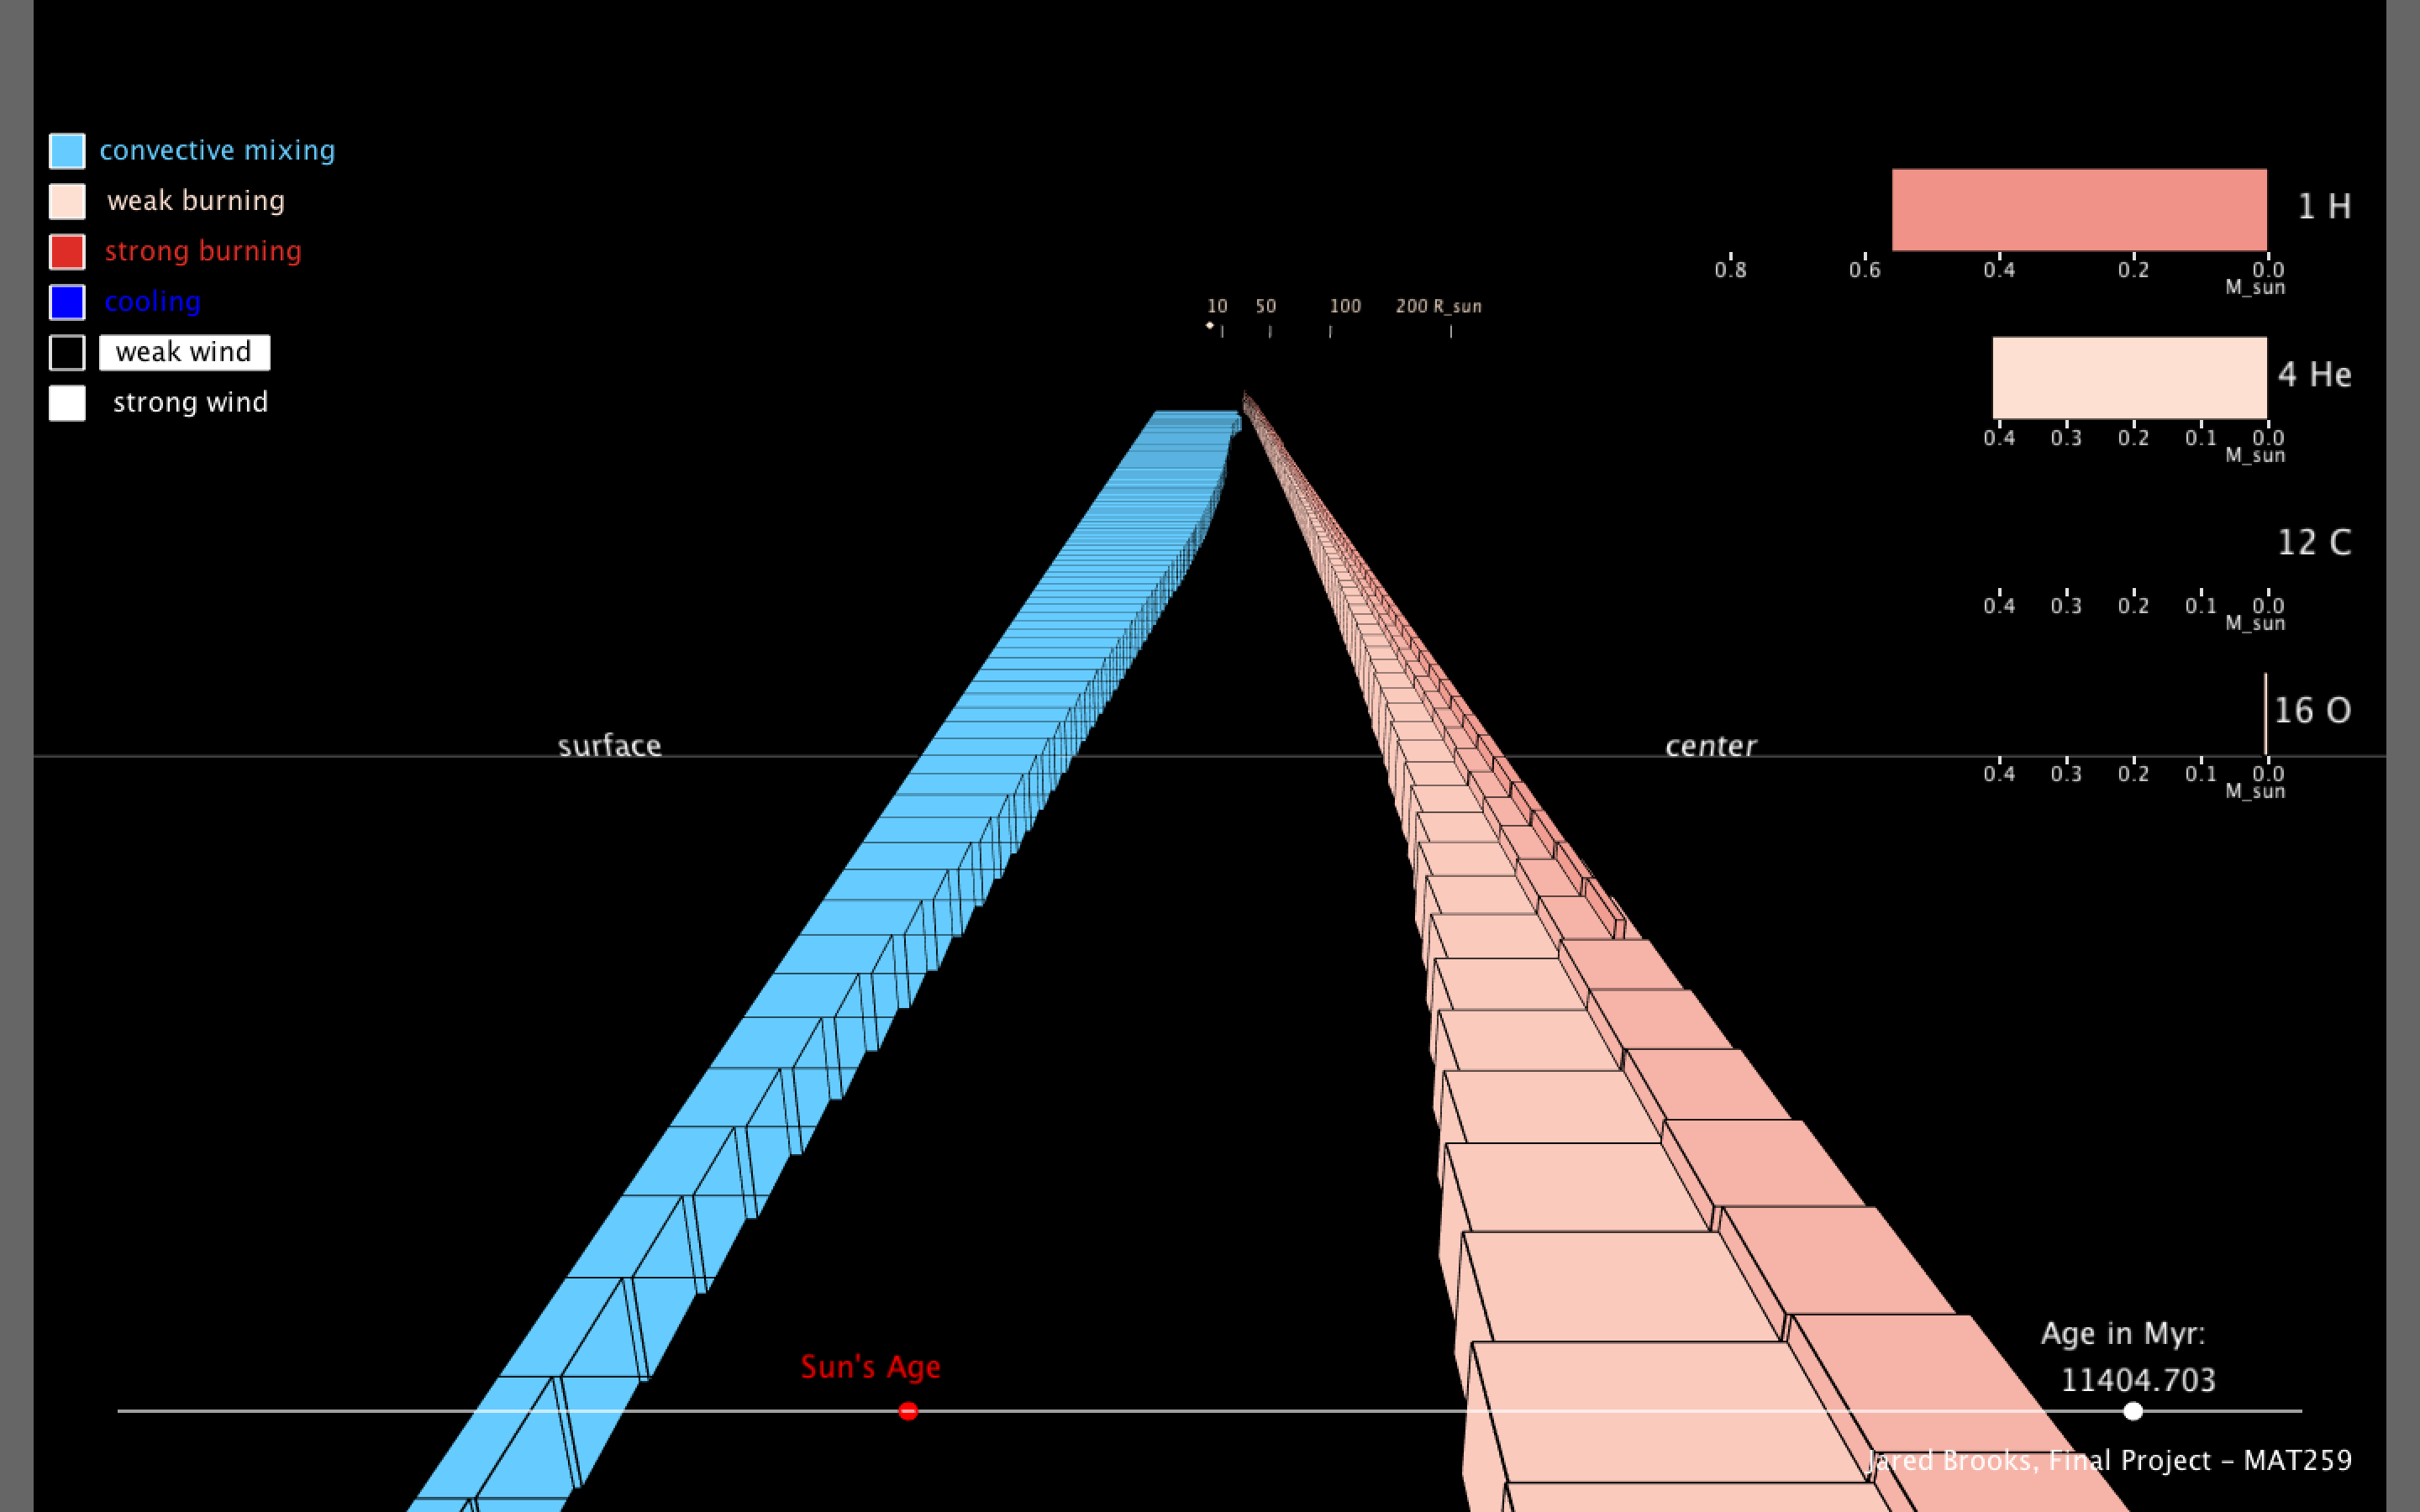
I also have a sphere that sits above the boxes and changes its radius based of the radius of the model, and the surface temperature of the model is roughly mapped to the color of the sphere. There are tick marks to show the scale of the radius of the model. I moved the elemental abundance cylinders into 2D bars on the HUD but work essentially the same. The wind rate to background color is also the same. There is also the option to pause the animation with the spacebar and can be speed up and down with the right and left arrow keys. The HUD can also be toggled by pressing 'h'.
I also have a sphere that sits above the boxes and changes its radius based of the radius of the model, and the surface temperature of the model is roughly mapped to the color of the sphere. There are tick marks to show the scale of the radius of the model. I moved the elemental abundance cylinders into 2D bars on the HUD but work essentially the same. The wind rate to background color is also the same. There is also the option to pause the animation with the spacebar and can be speed up and down with the right and left arrow keys. The HUD can also be toggled by pressing 'h'.
Final result
For the final result, I cleaned up the HUD. I removed the strokes from all the rectangles and added semi-transparent grey rectangles behind each section of the HUD and lined them up with each other. I also changed the font to Arial.
I also changed the color scheme and added the option to toggle between 5 different color schemes by pressing '1' through '5'.
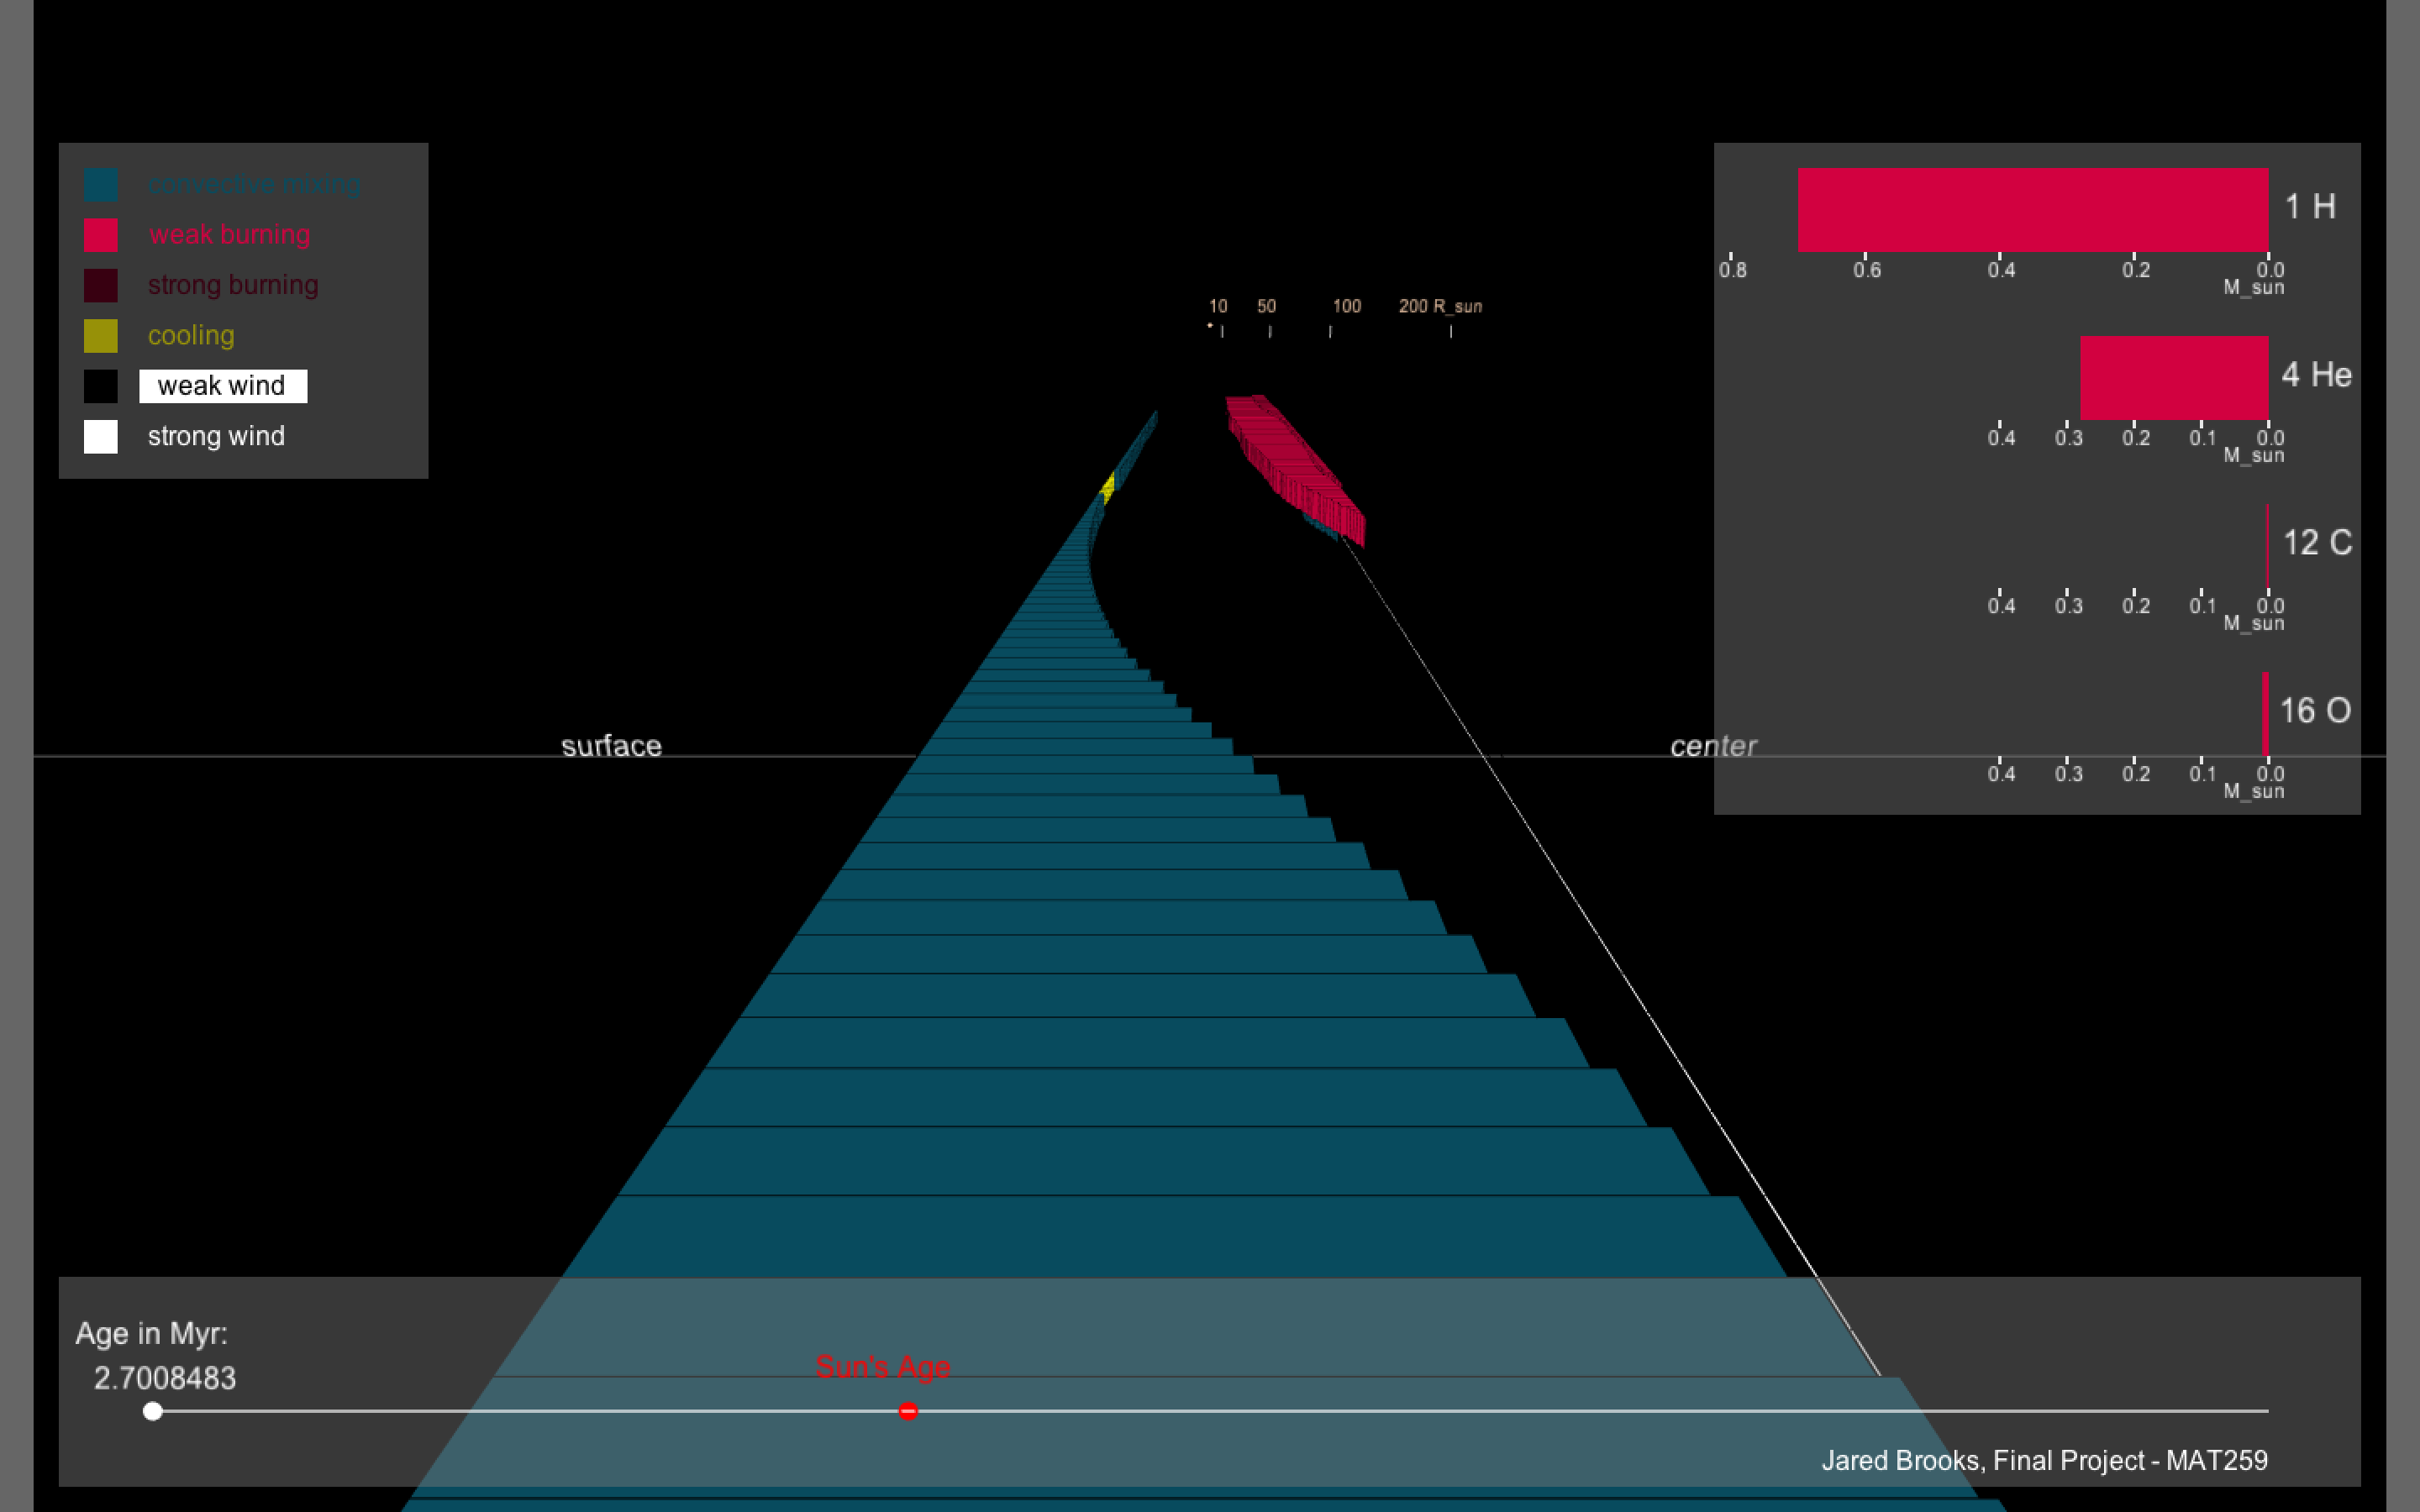
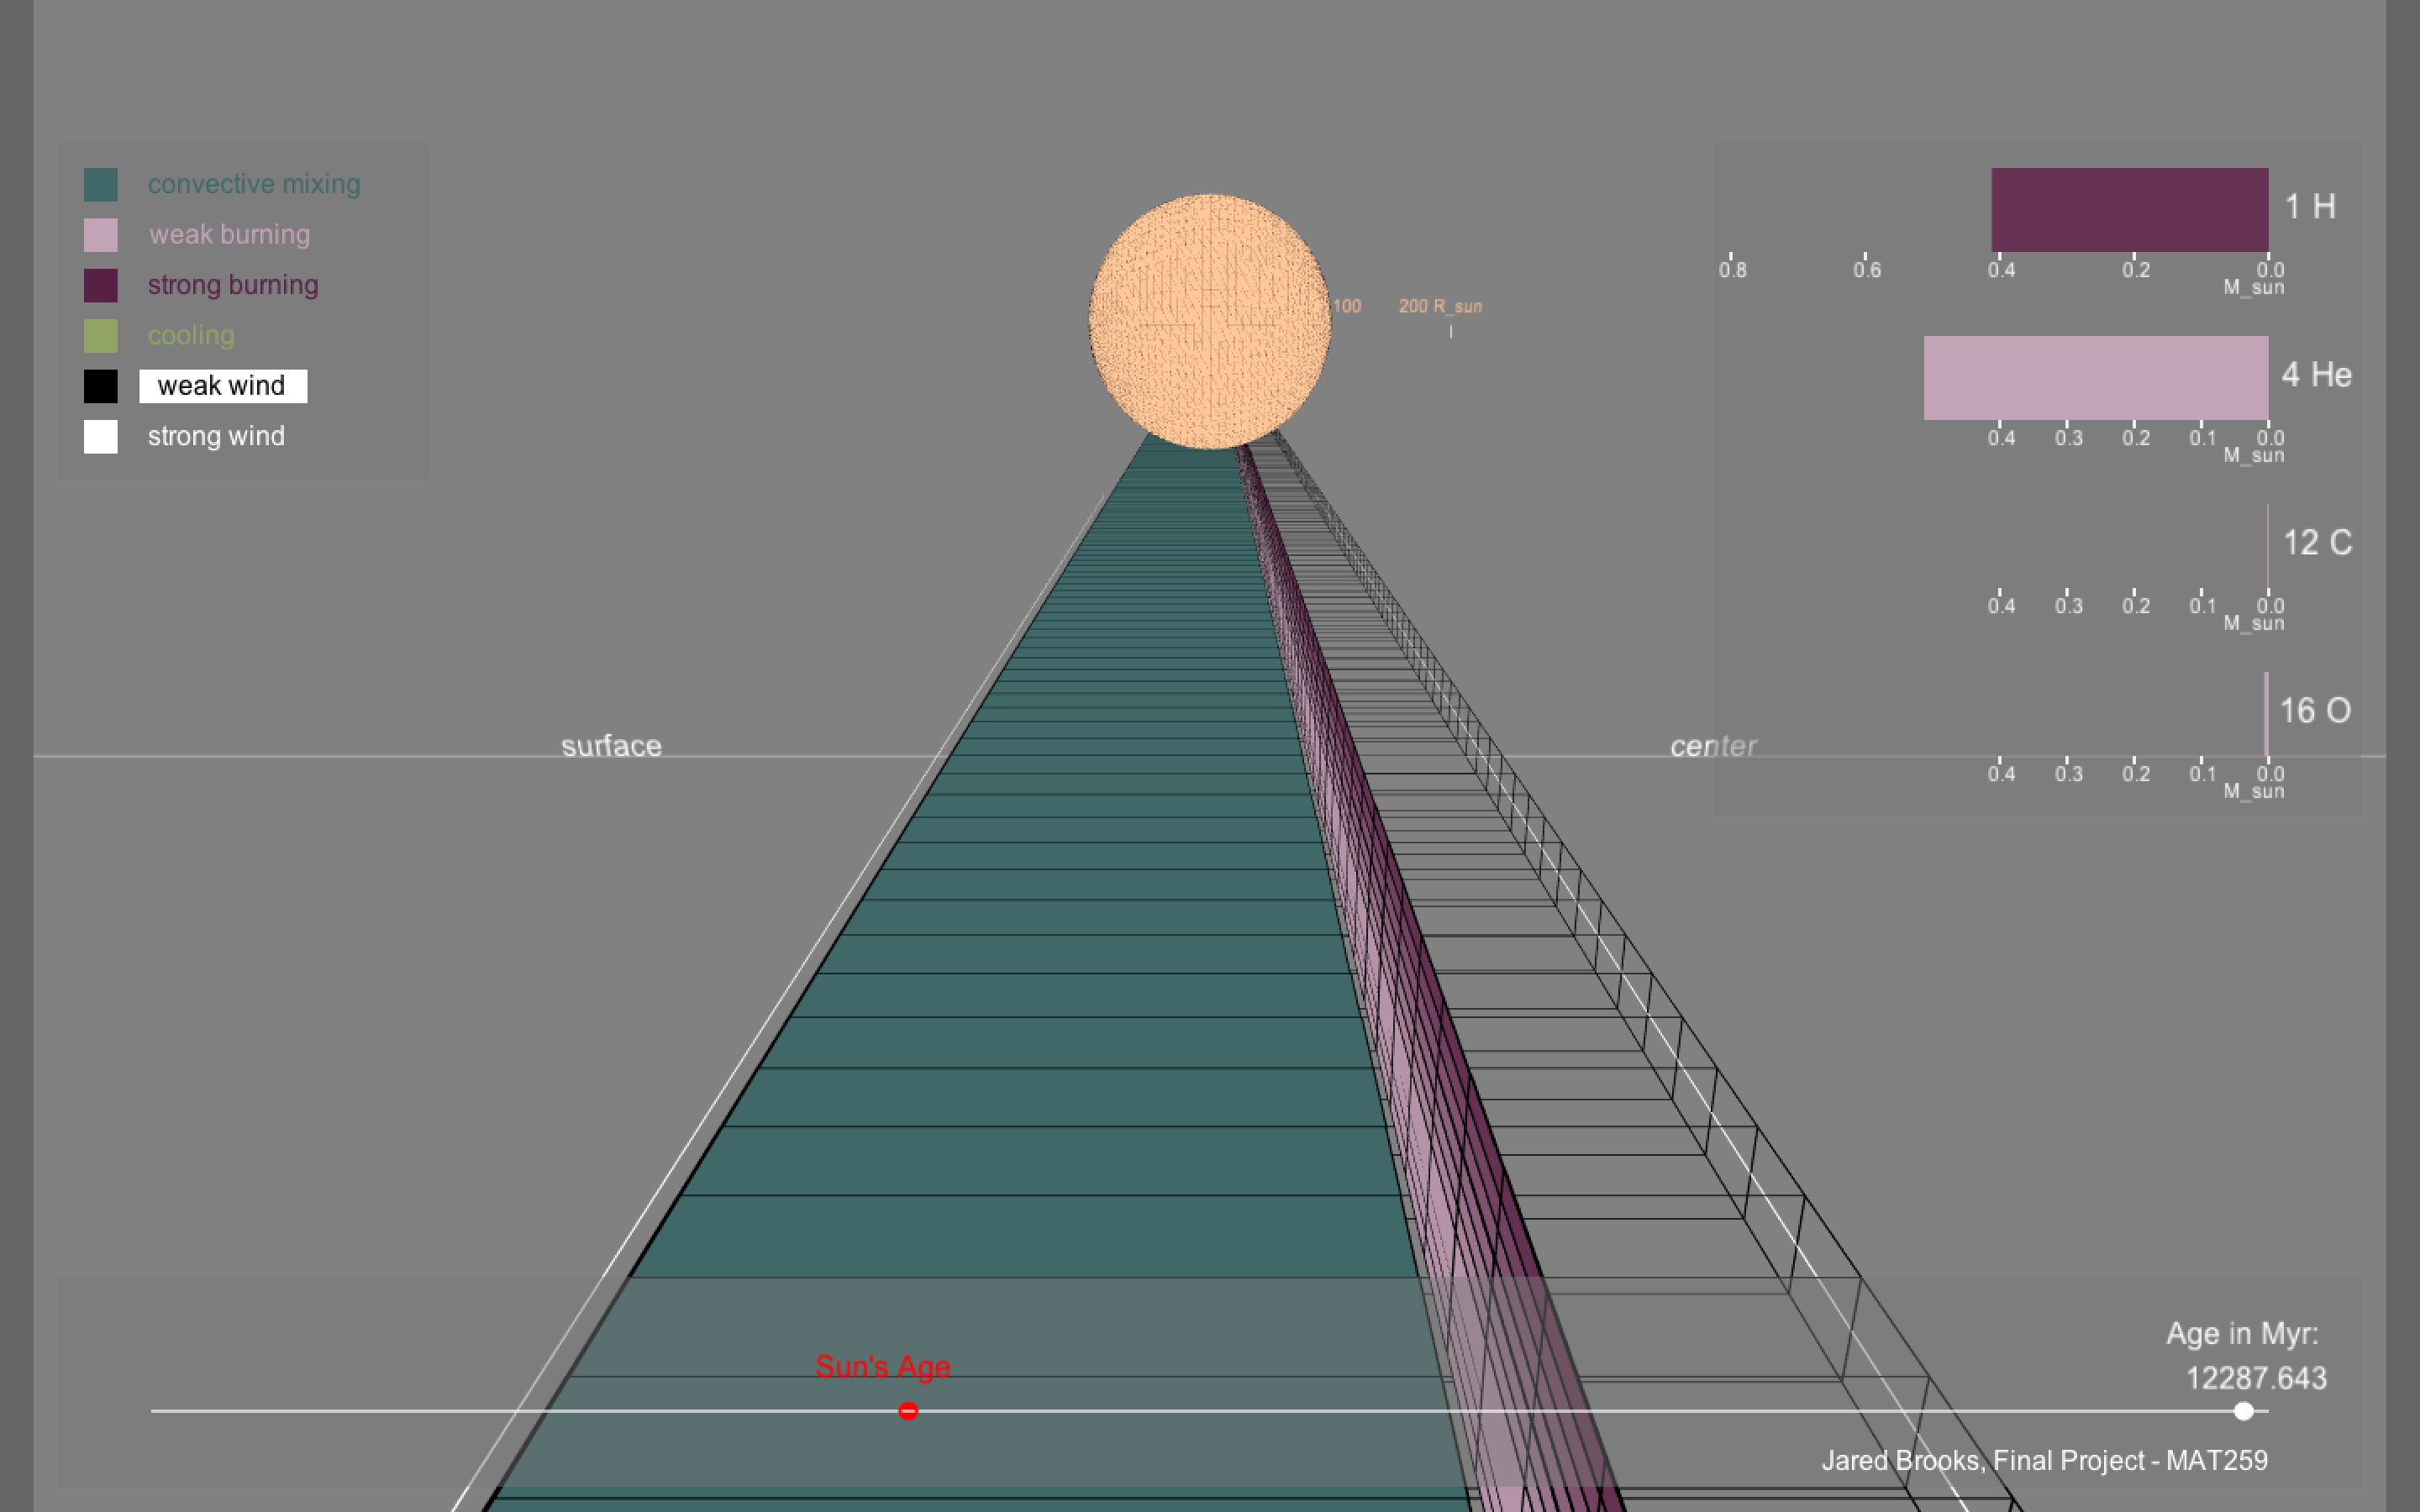

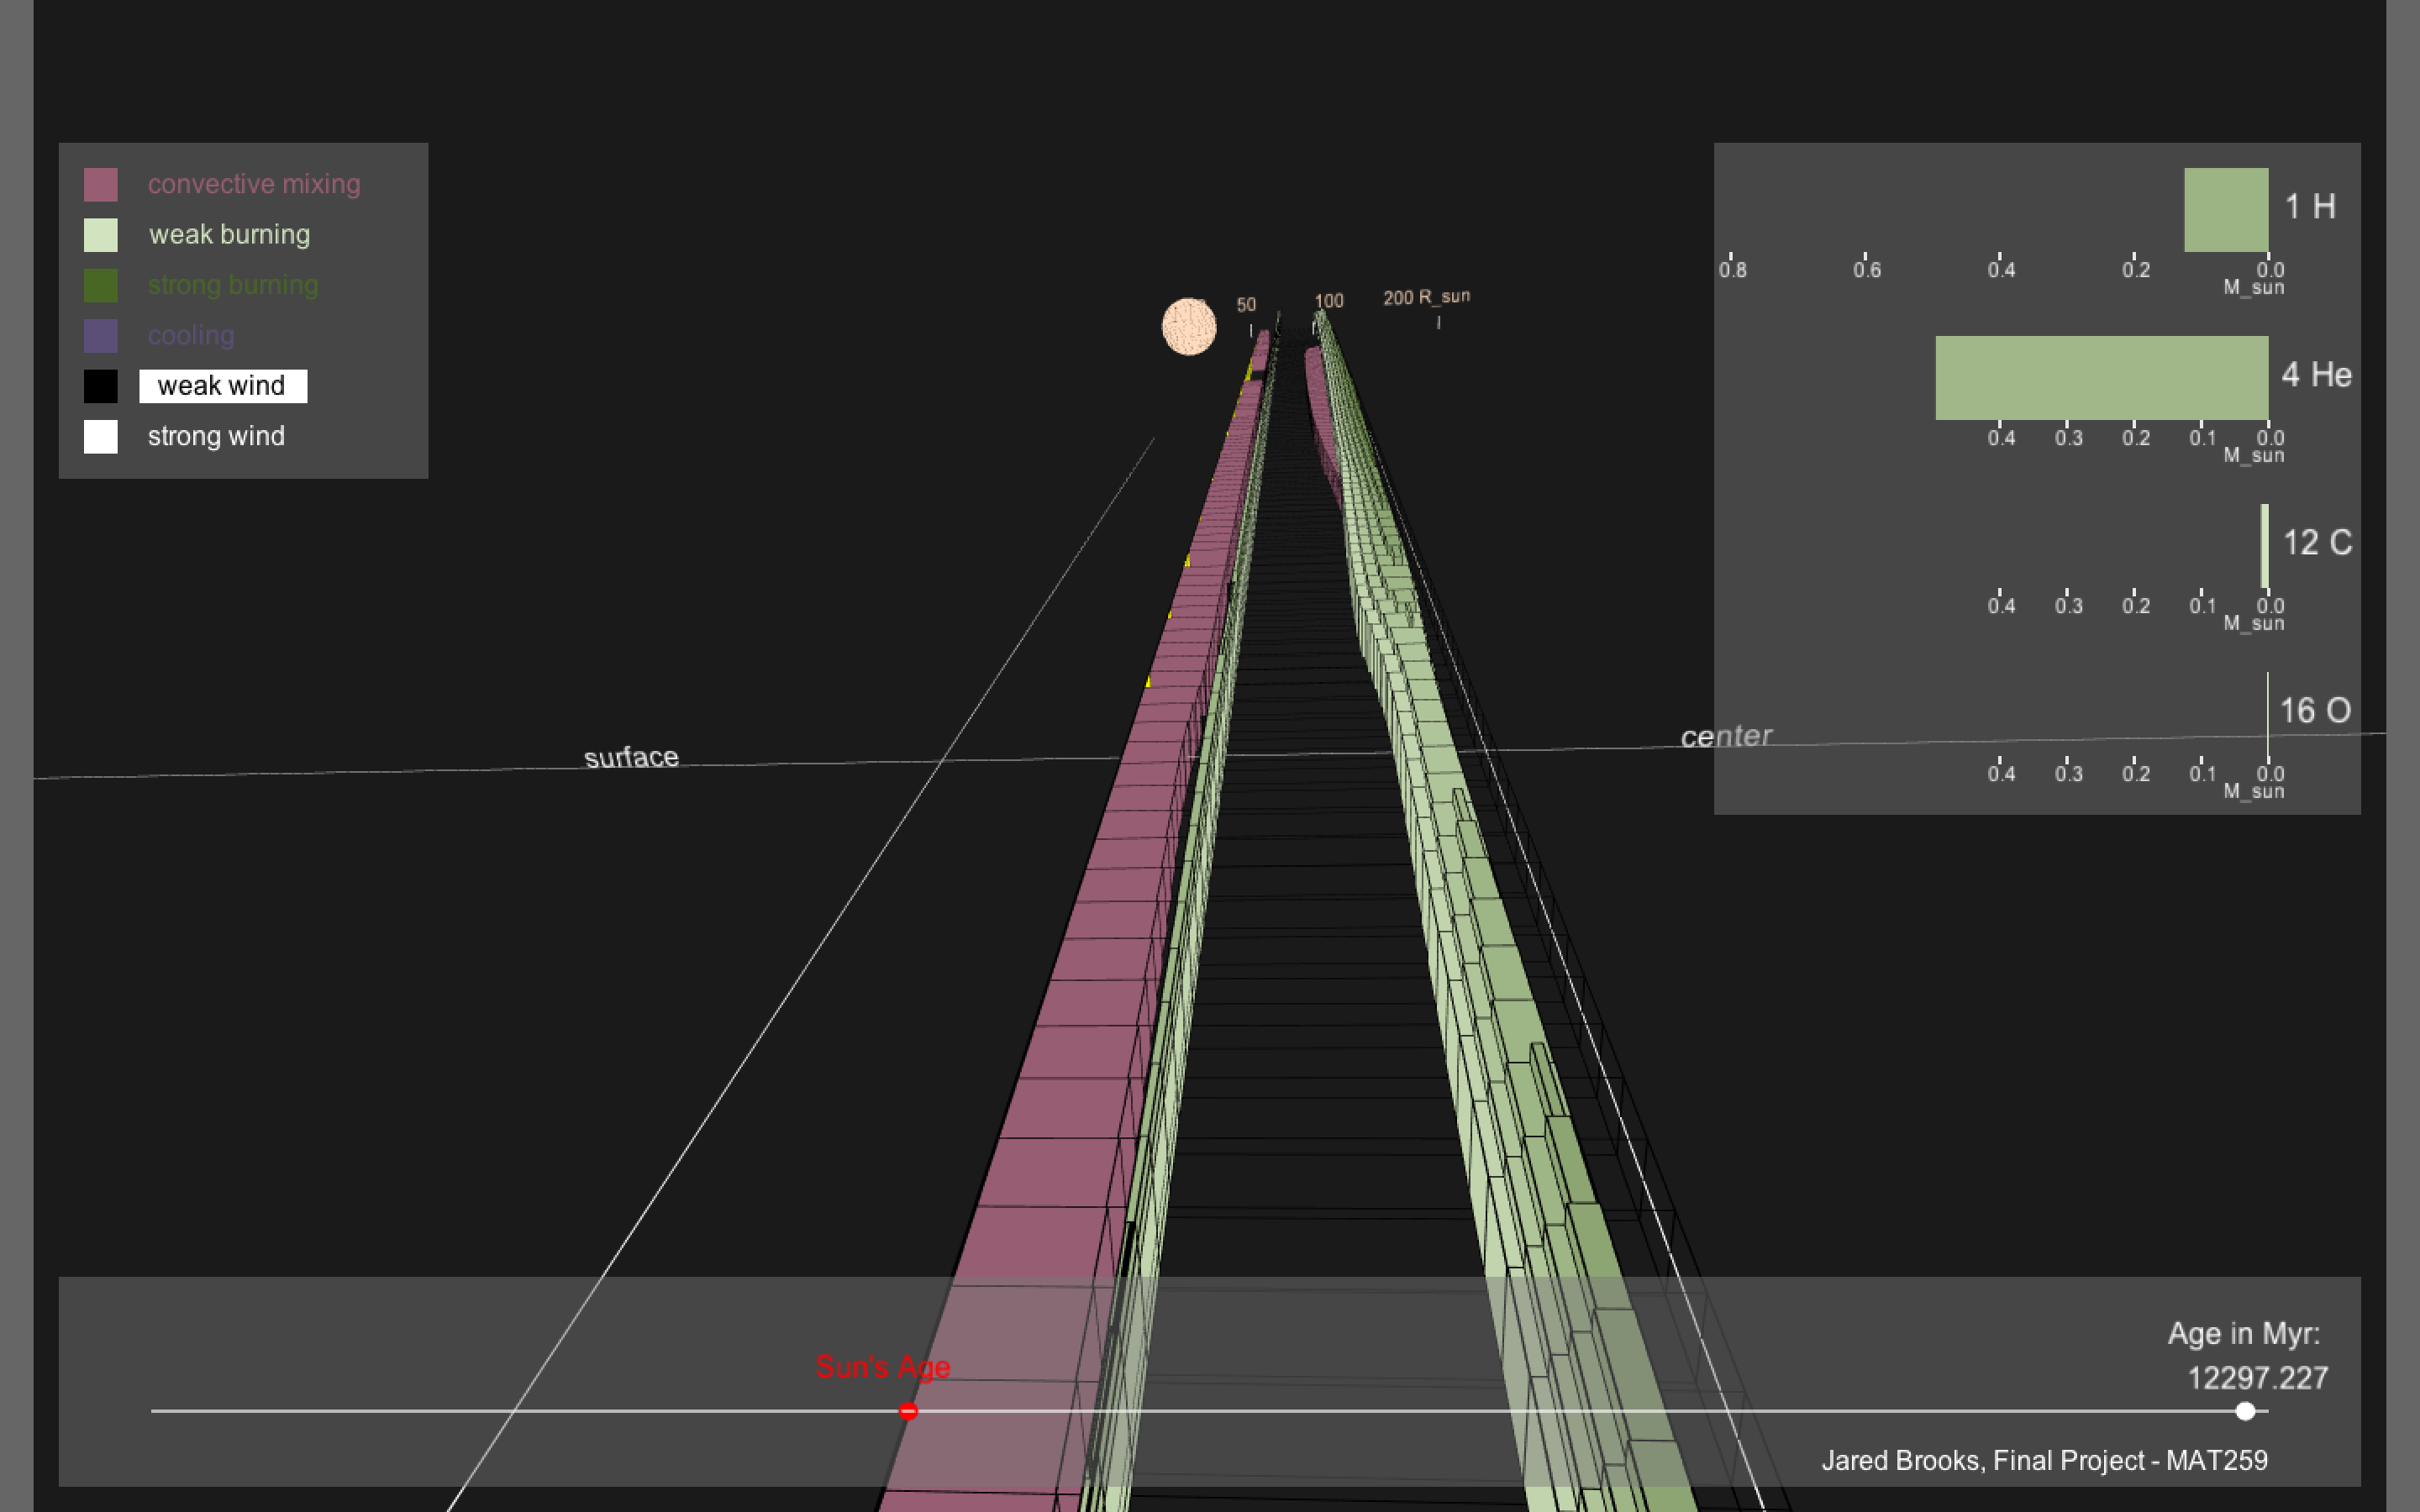
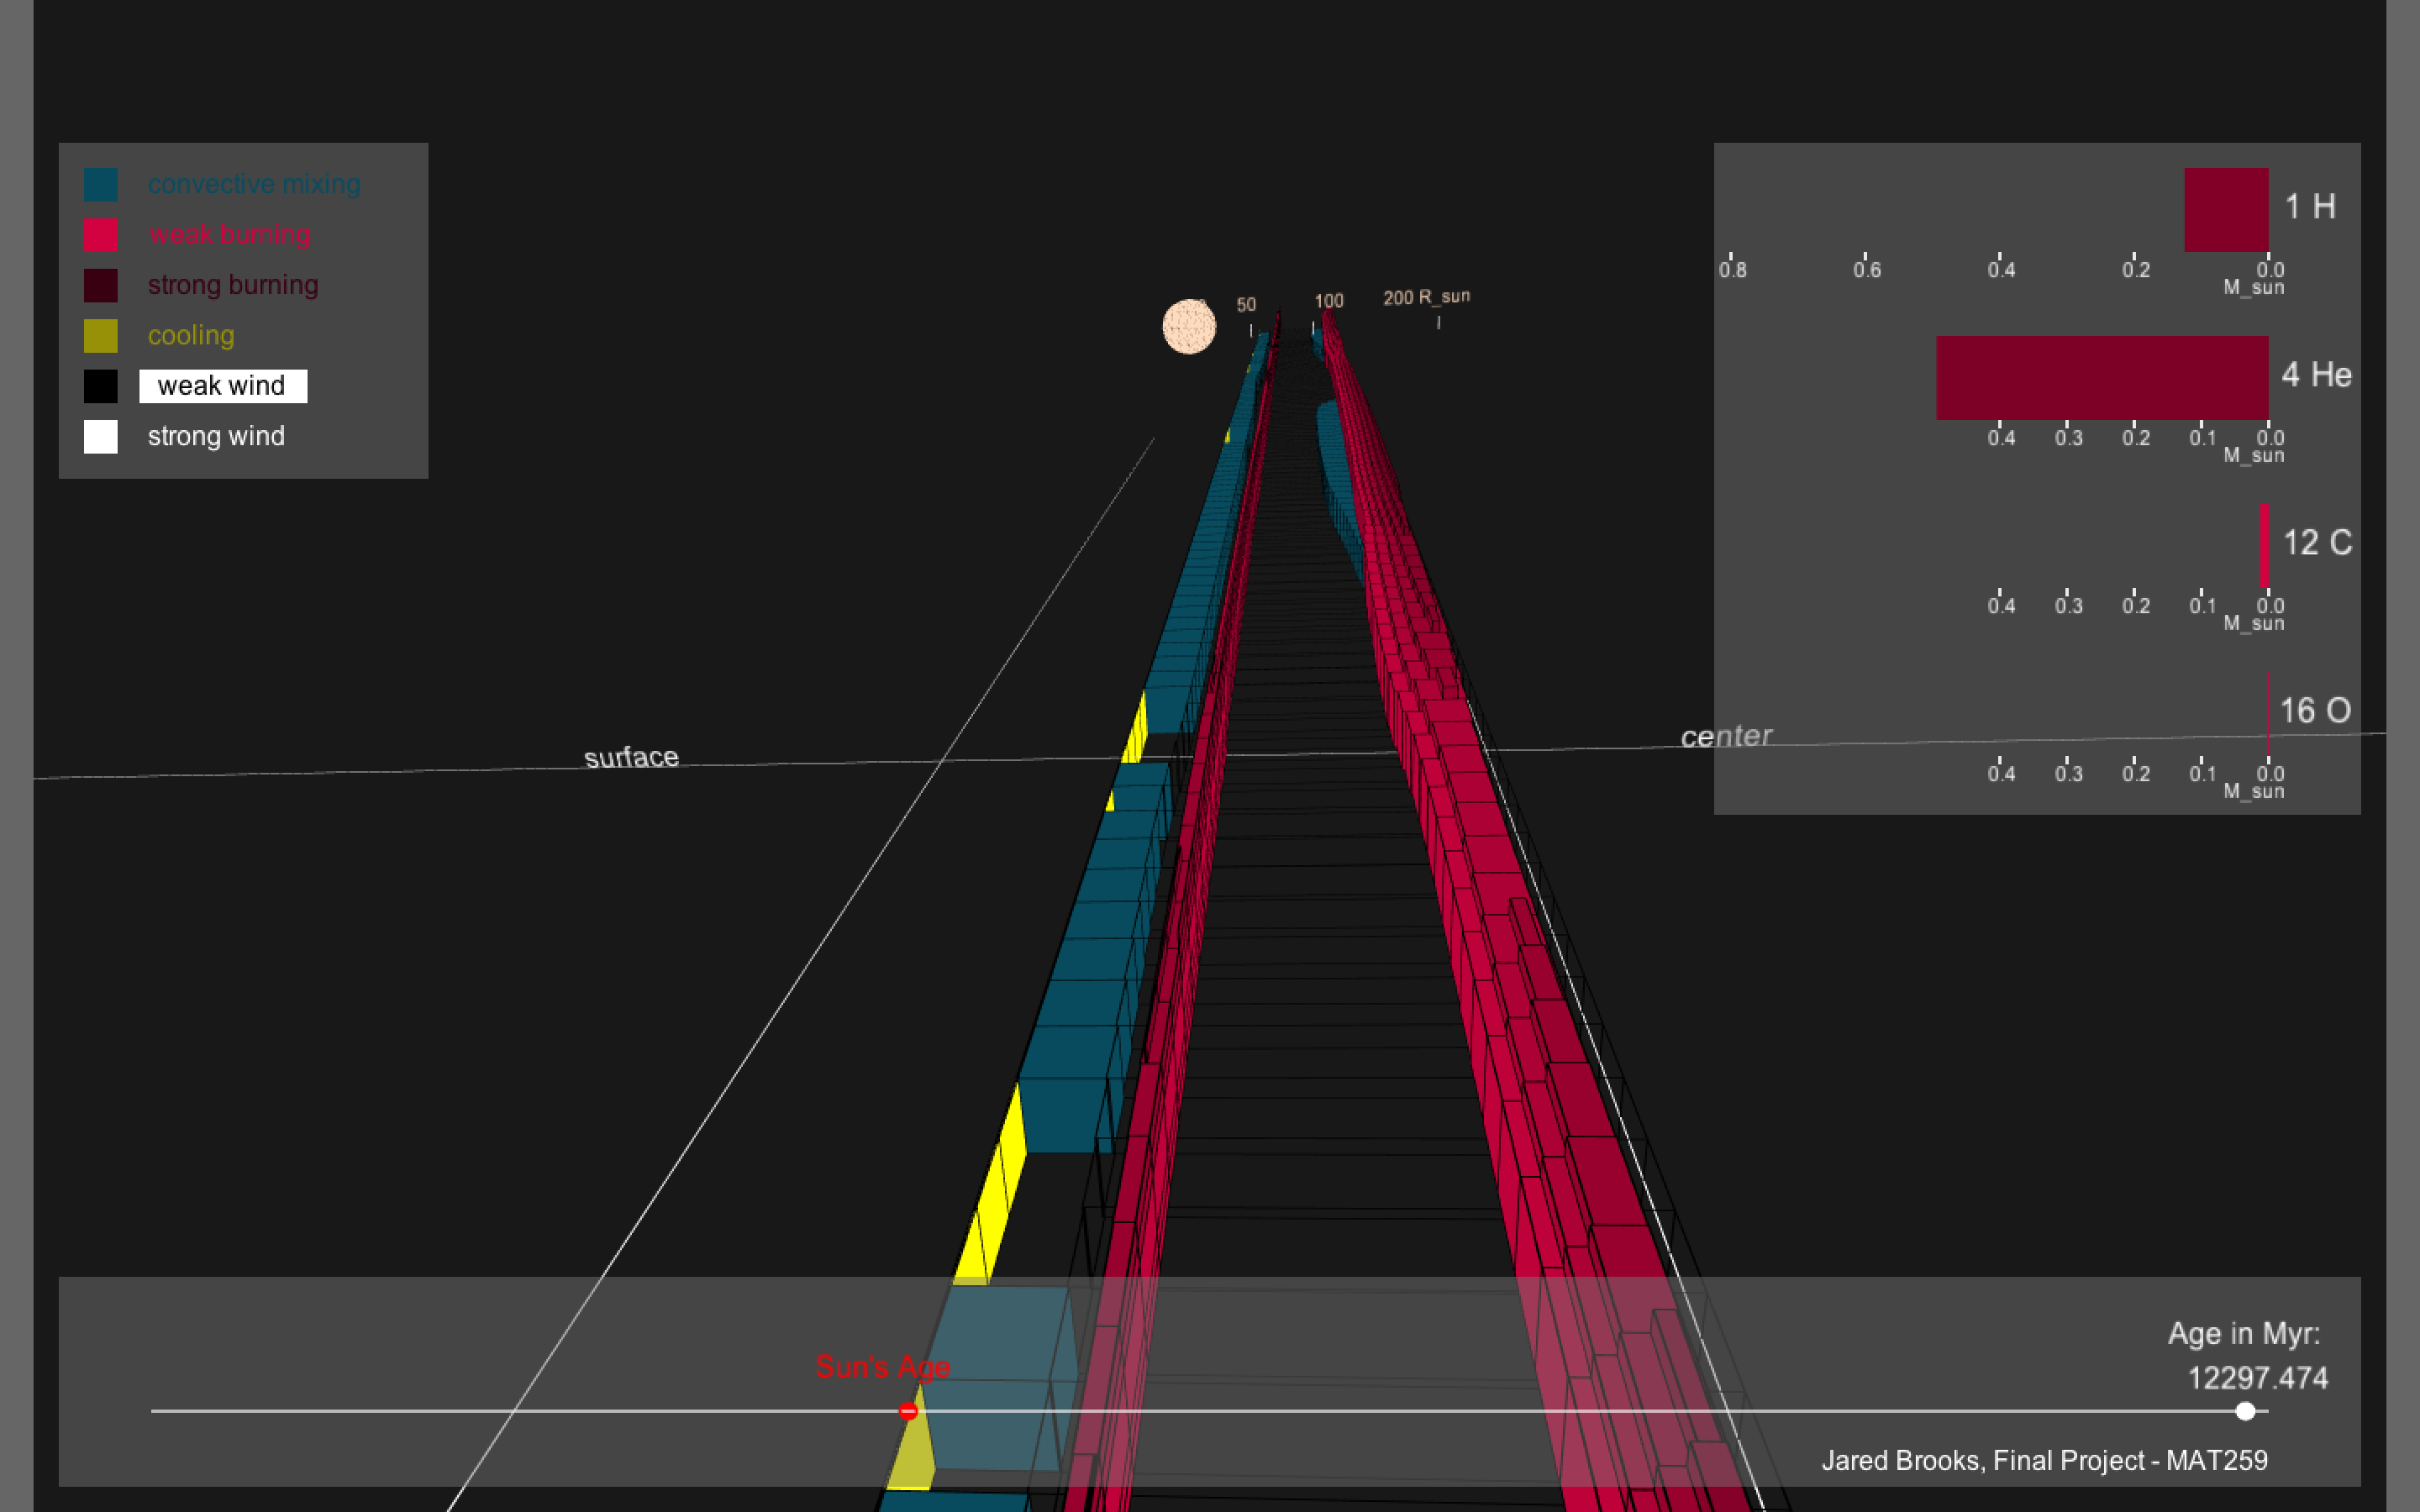
I also changed the color scheme and added the option to toggle between 5 different color schemes by pressing '1' through '5'.
Evaluation/Analysis
The visualization is a fun and engaging way to show people how a star like the Sun evolves through its life-cycle. I went through a lengthy process to try to figure out the most important data to show and the best way to show it, not all of which is covered here. I recieved helpful feedback from the professor and from my peers in the class, which was important as the data (and what it represents) is so familiar to me, I needed an outside perpective as to how others view and understand my project. All in all, I am happy with the way it turned out.
Code