Topic Modeling and Word Vector Visualization of Open Library Fiction Subjects
MAT 259, 2017
Hannah Wolfe
Concept
Visualize fiction titles using word2vec mapping for book's subjects in 3 dimensions, and graphing the titles and subjects on the resulting word cloud.
Dataset
The fiction titles and subjects came from Open Library:
Open Library Bulk Download
The books subjects were analyzed using LDA from the gensim python library to create 10 topics:
Gensim: LDA Model
The google news word vectors were used as a pregenerated Word2Vec model:
Google News Word Vectors Description Google News Word Vectors Download
I retrained the google news word vectors with the book subjects using Gensim:
Gensim: Word2Vec Model
The resulting word vectors were brought down to three dimensions using t-SNE from the scikit learn python library:
Scikit-Learn: t-SNE
Process
I first started the visualization with the fiction titles from my 3D library visualization. I used word2vec for mapping the words in 3 dimensions, and graphing the titles on the resulting word cloud. This differed from the p 3D library visualization because I was using pre-trained word vectors from google and continuing to train it with the book titles, labeling all the words in a title, and testing how much different amounts of training effected the visualization.
"aunt" selected when viewing the word cloud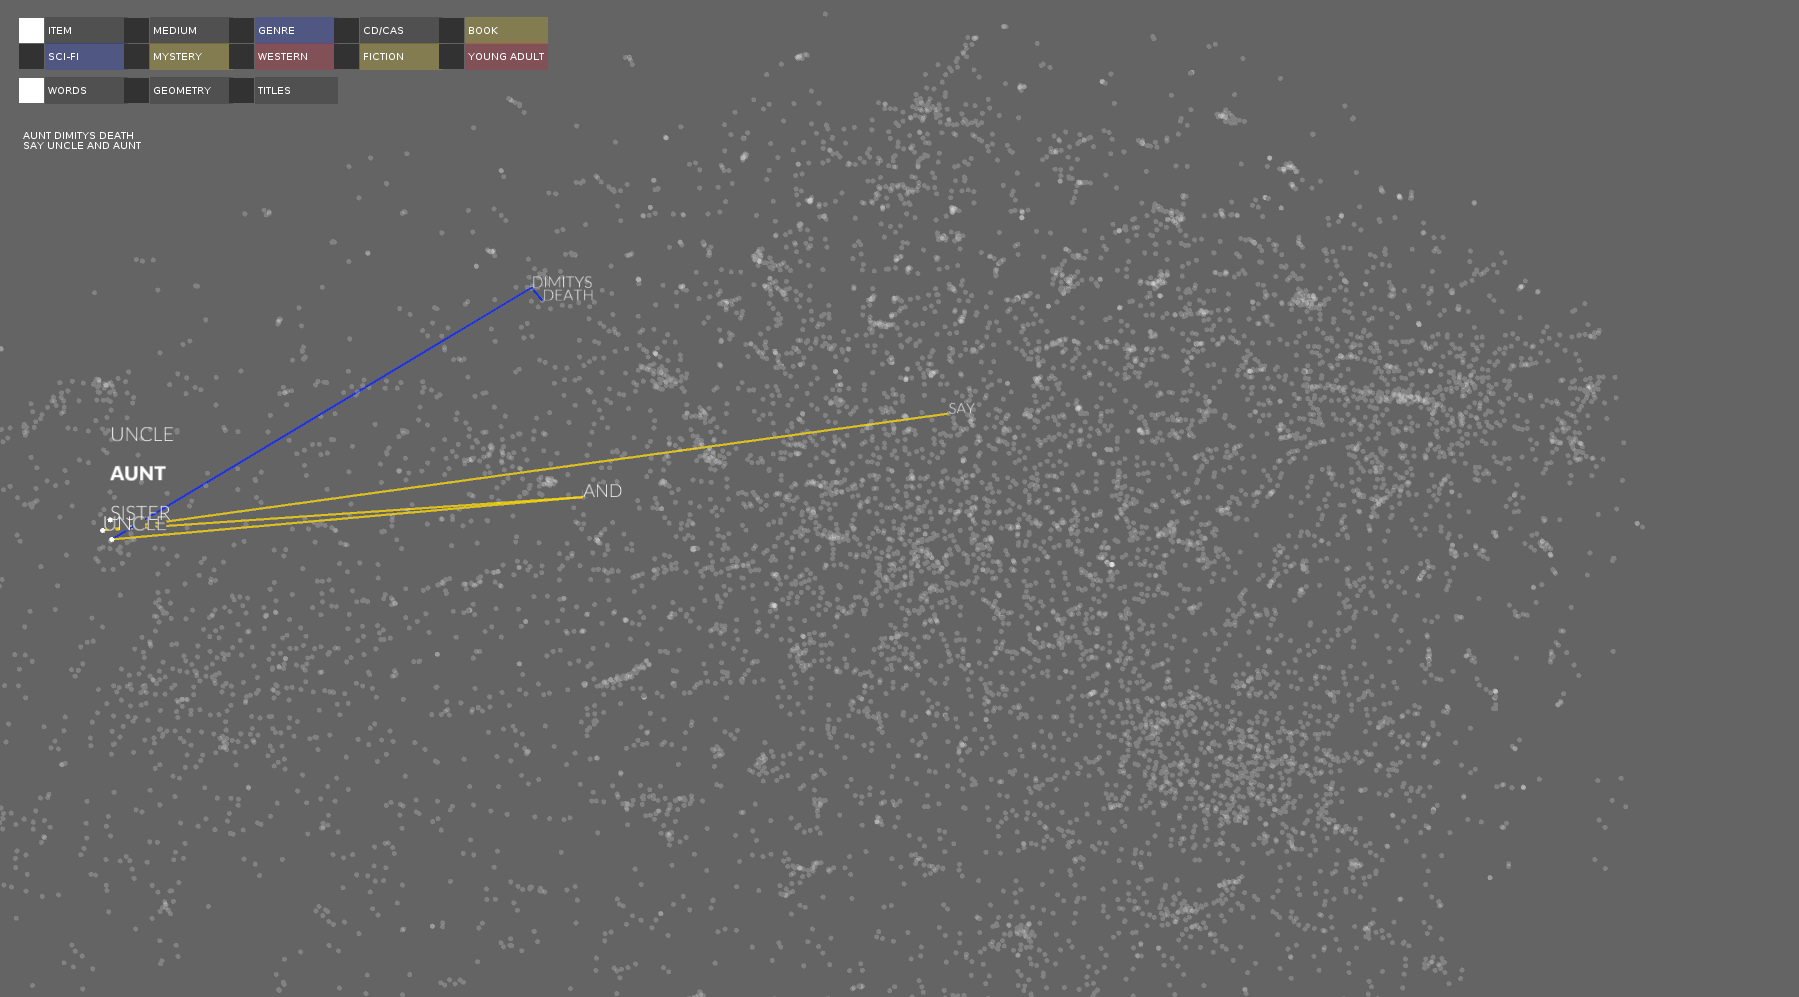
book selected when viewing the title cloud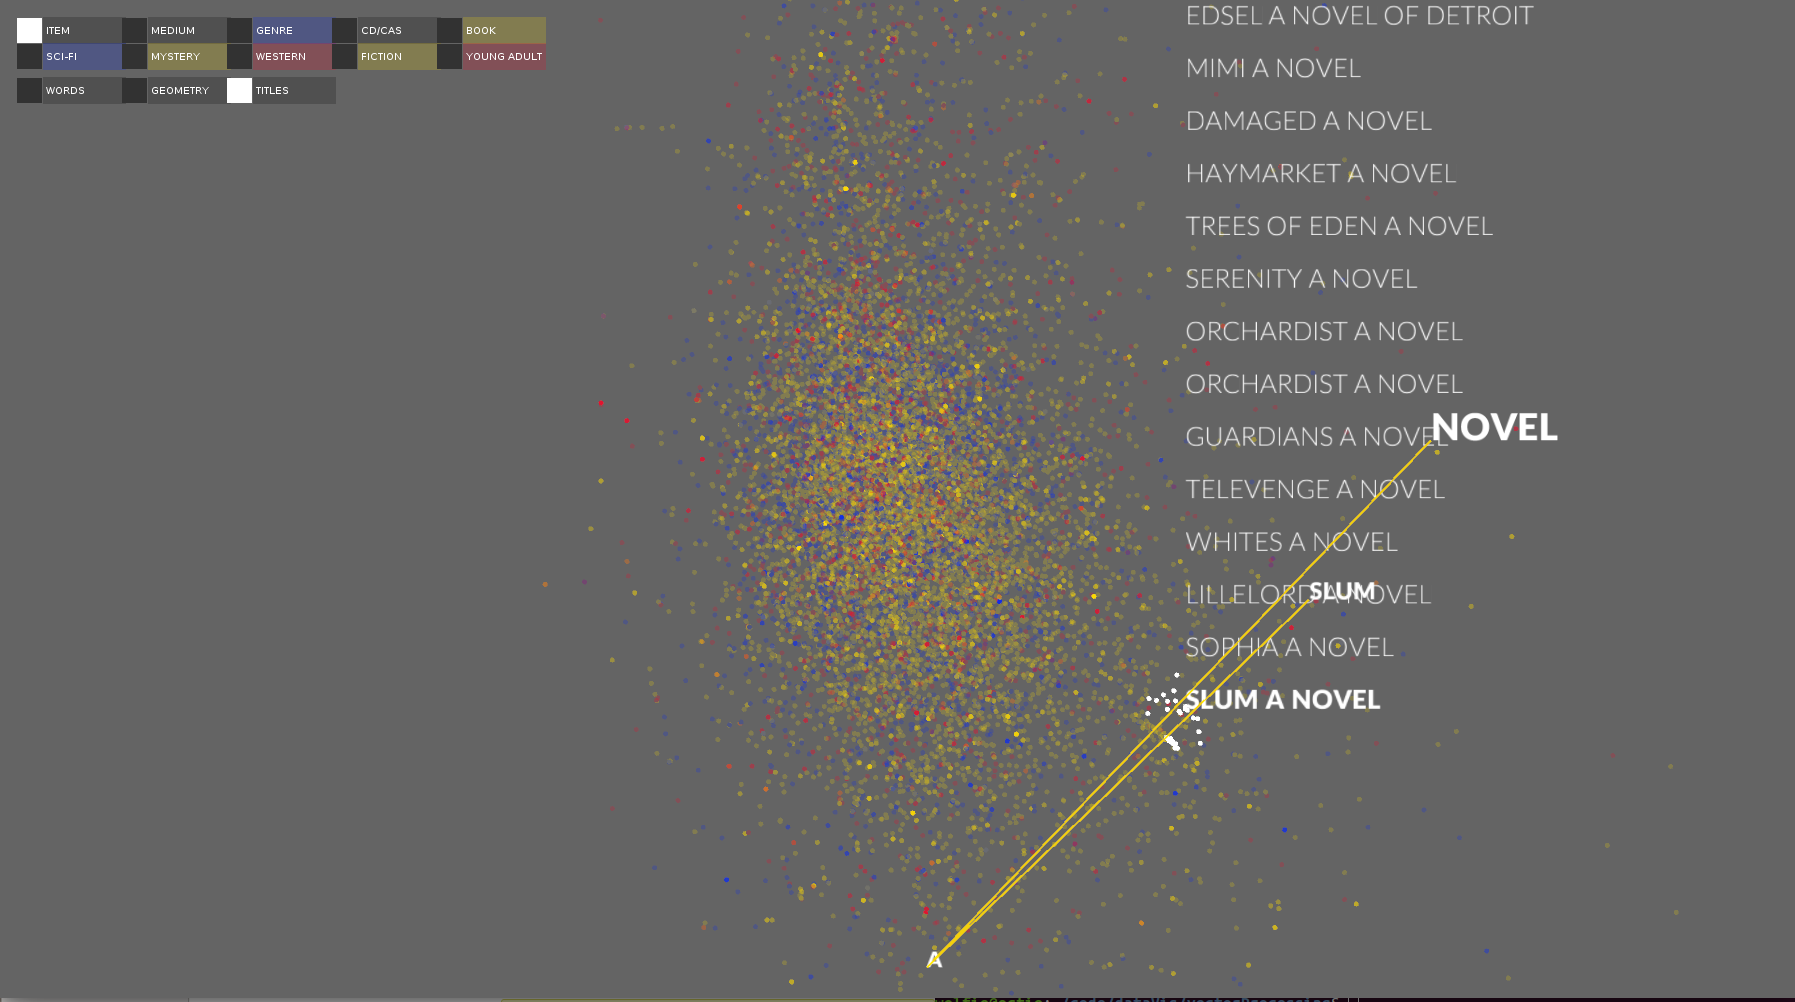
"fire" hovered over when viewing the title geometries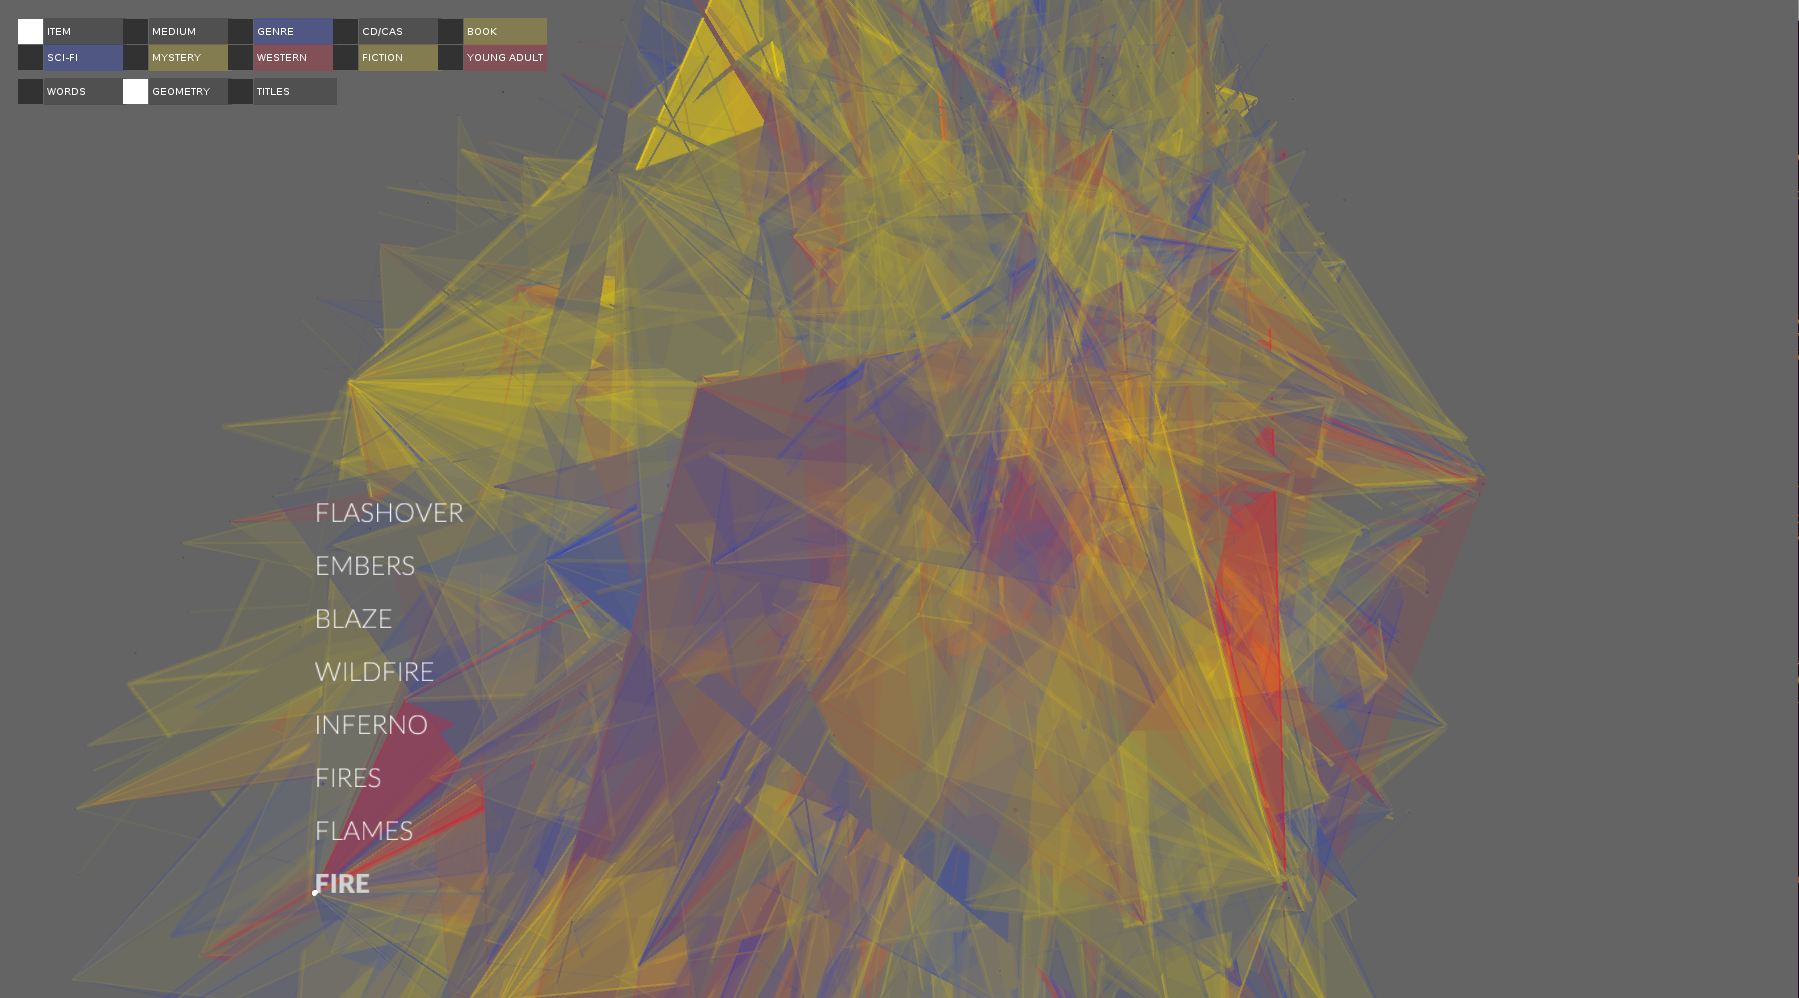
fire selected when viewing the title geometries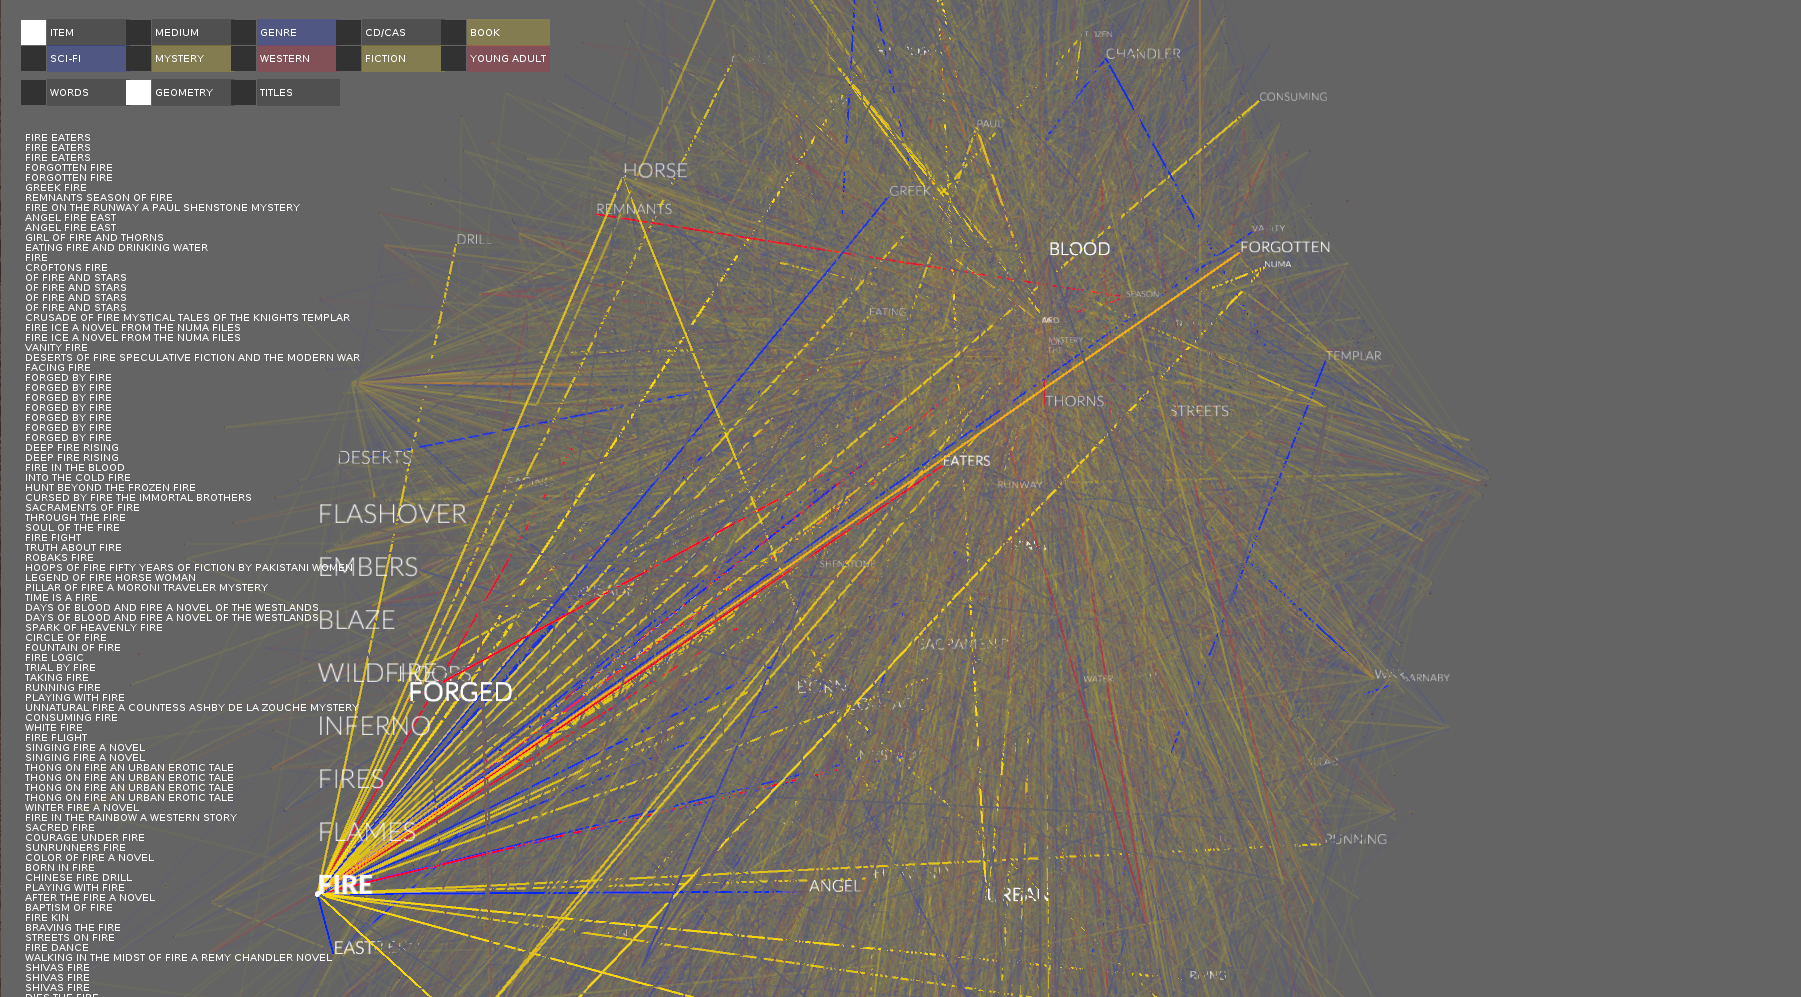
there is an interesting divide in the titles when looking at genre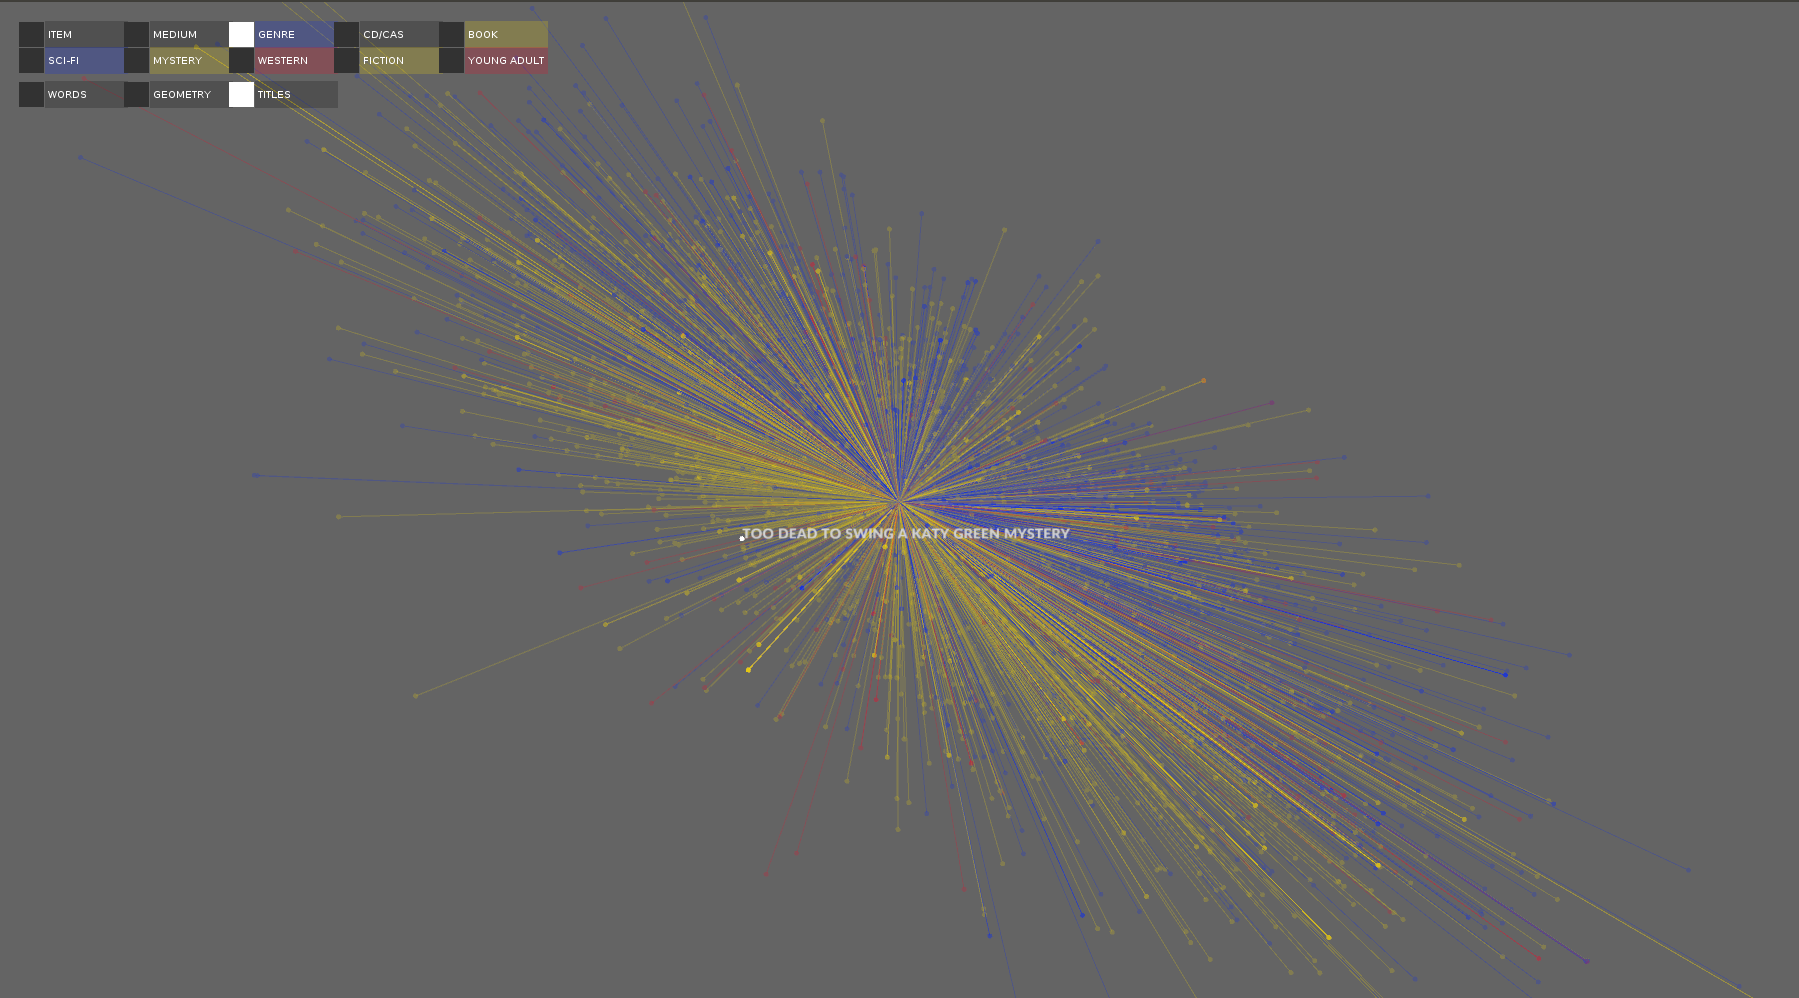
"aunt" selected when viewing the word cloud
book selected when viewing the title cloud
"fire" hovered over when viewing the title geometries
fire selected when viewing the title geometries
there is an interesting divide in the titles when looking at genre
Final result
For the final visualization I switched to using OpenLibrary's database of books. Because the books did not have genres in the database I did topic modeling on the subjects to create my own "genres." I ran the word2vec analysis on the book subjects. I then mapped the book location and path based on the books title instead of subject. Both the size and the darkness of the title dot represents how many books have the same subject vector.
All the topics visualized at once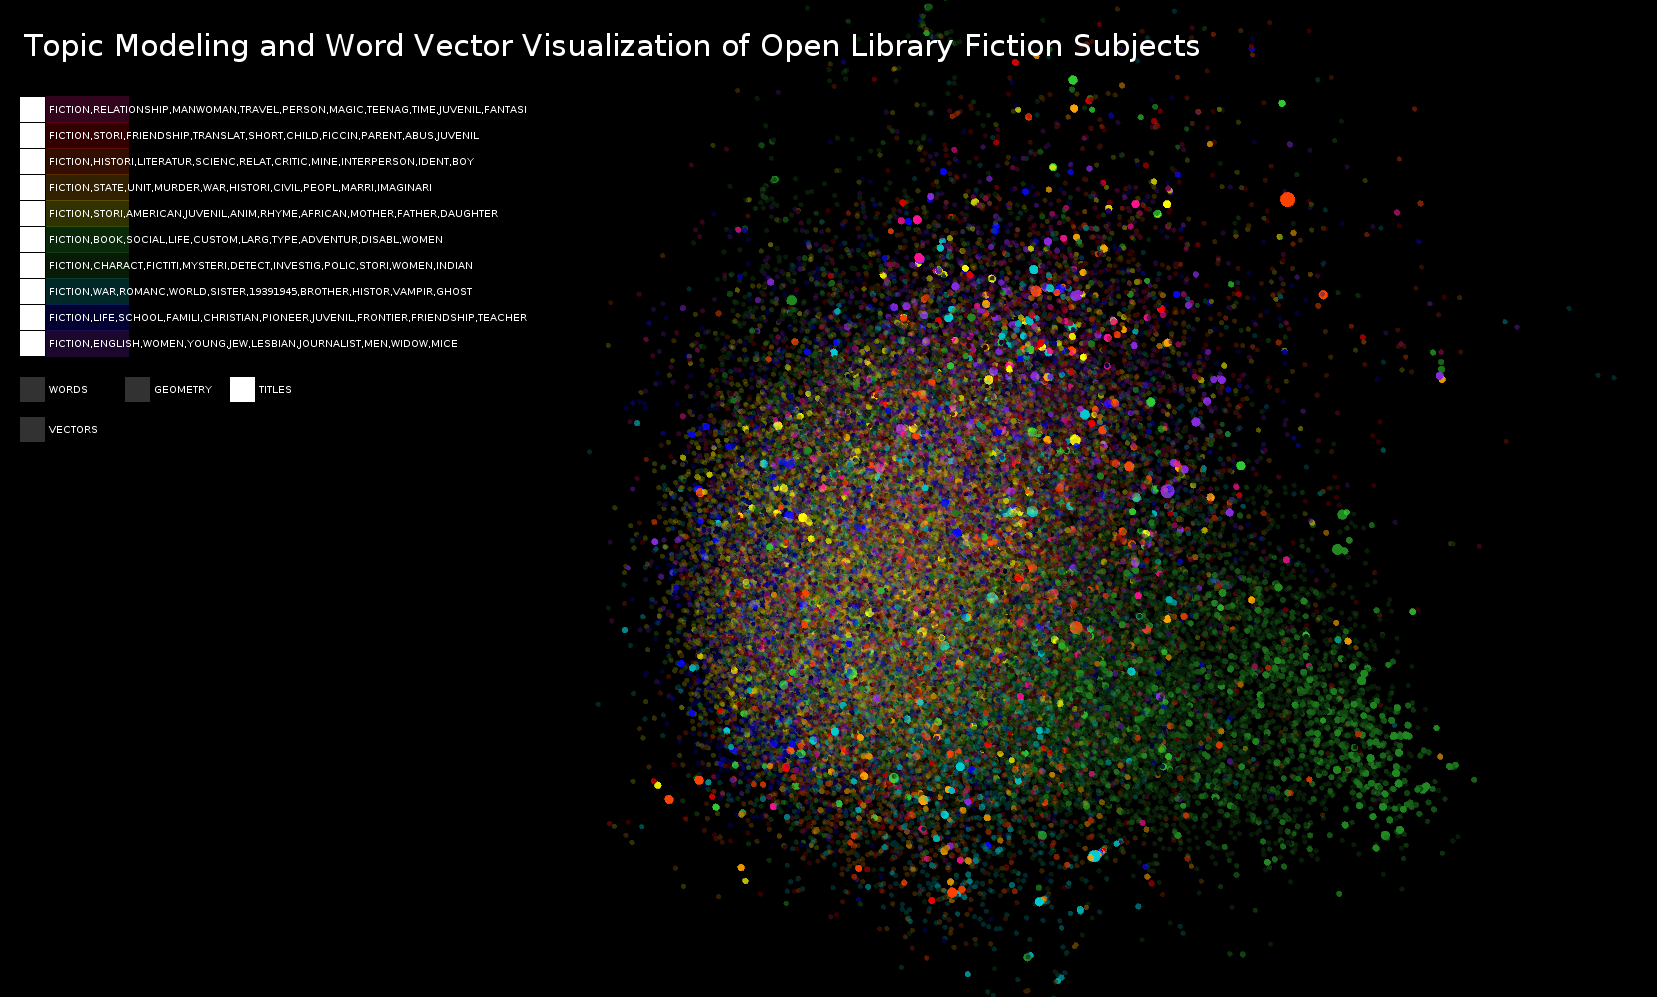
Two topics shown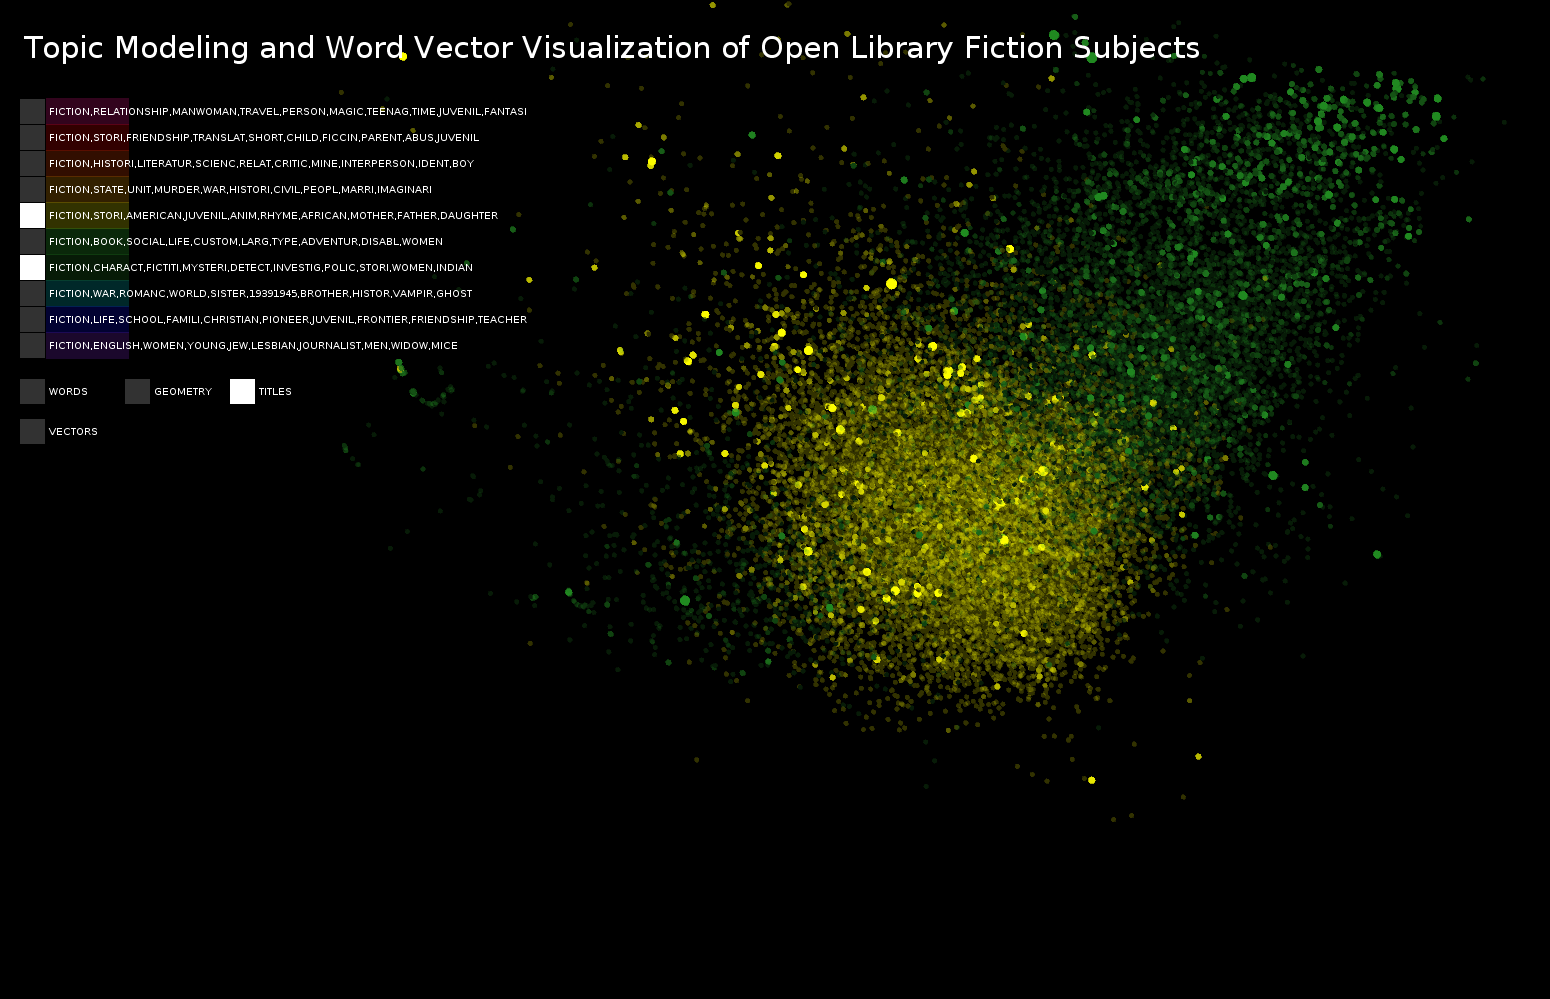
The subject path of a title selected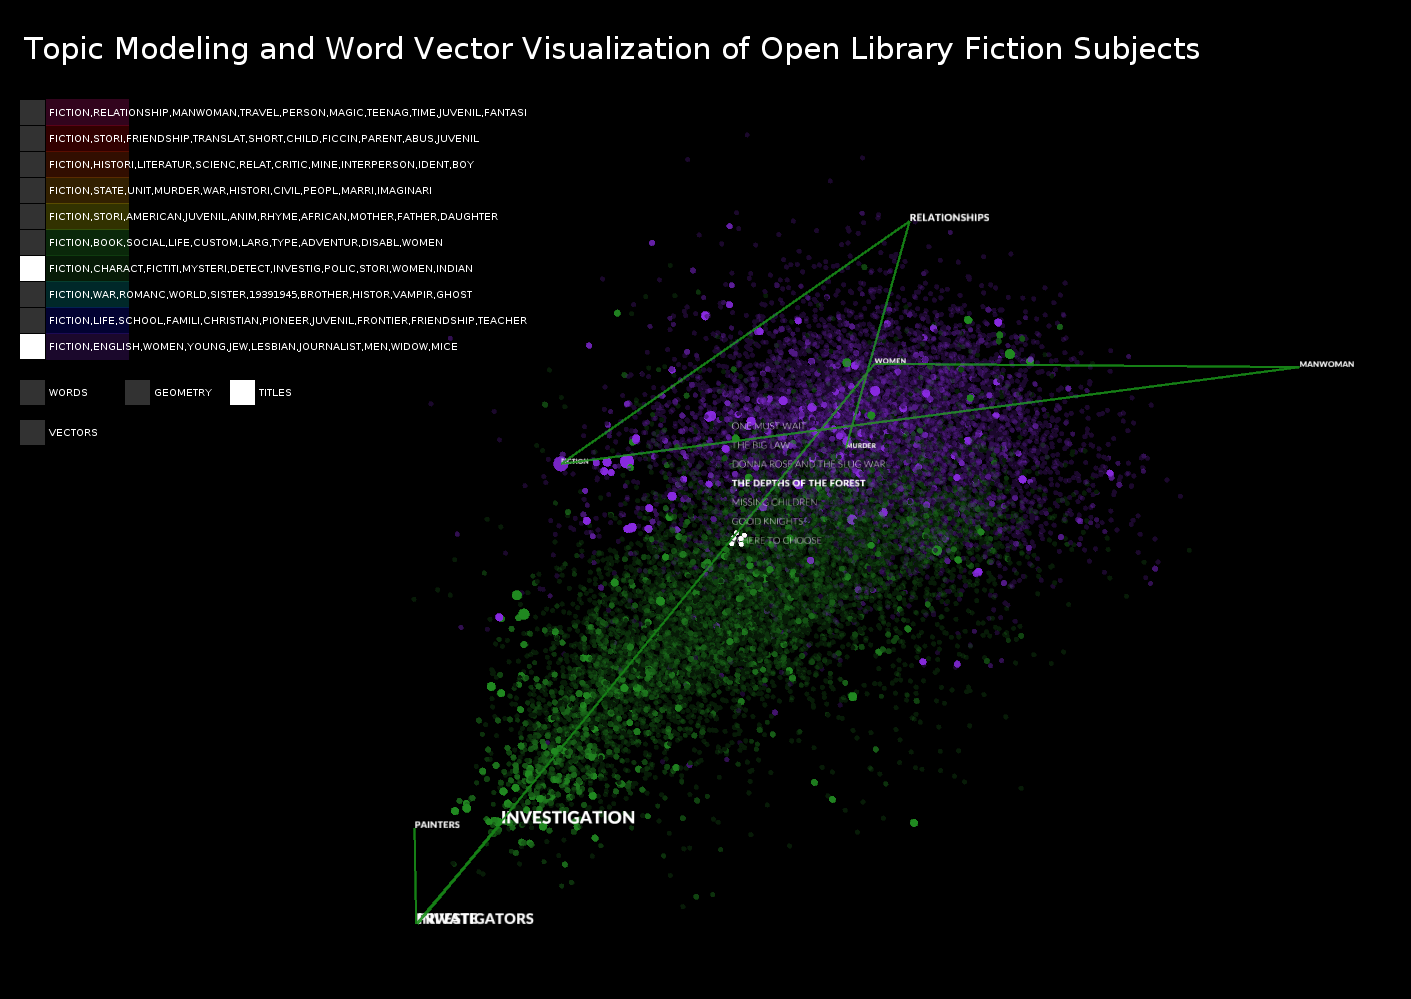
Two views of the same data with vectors turned on and off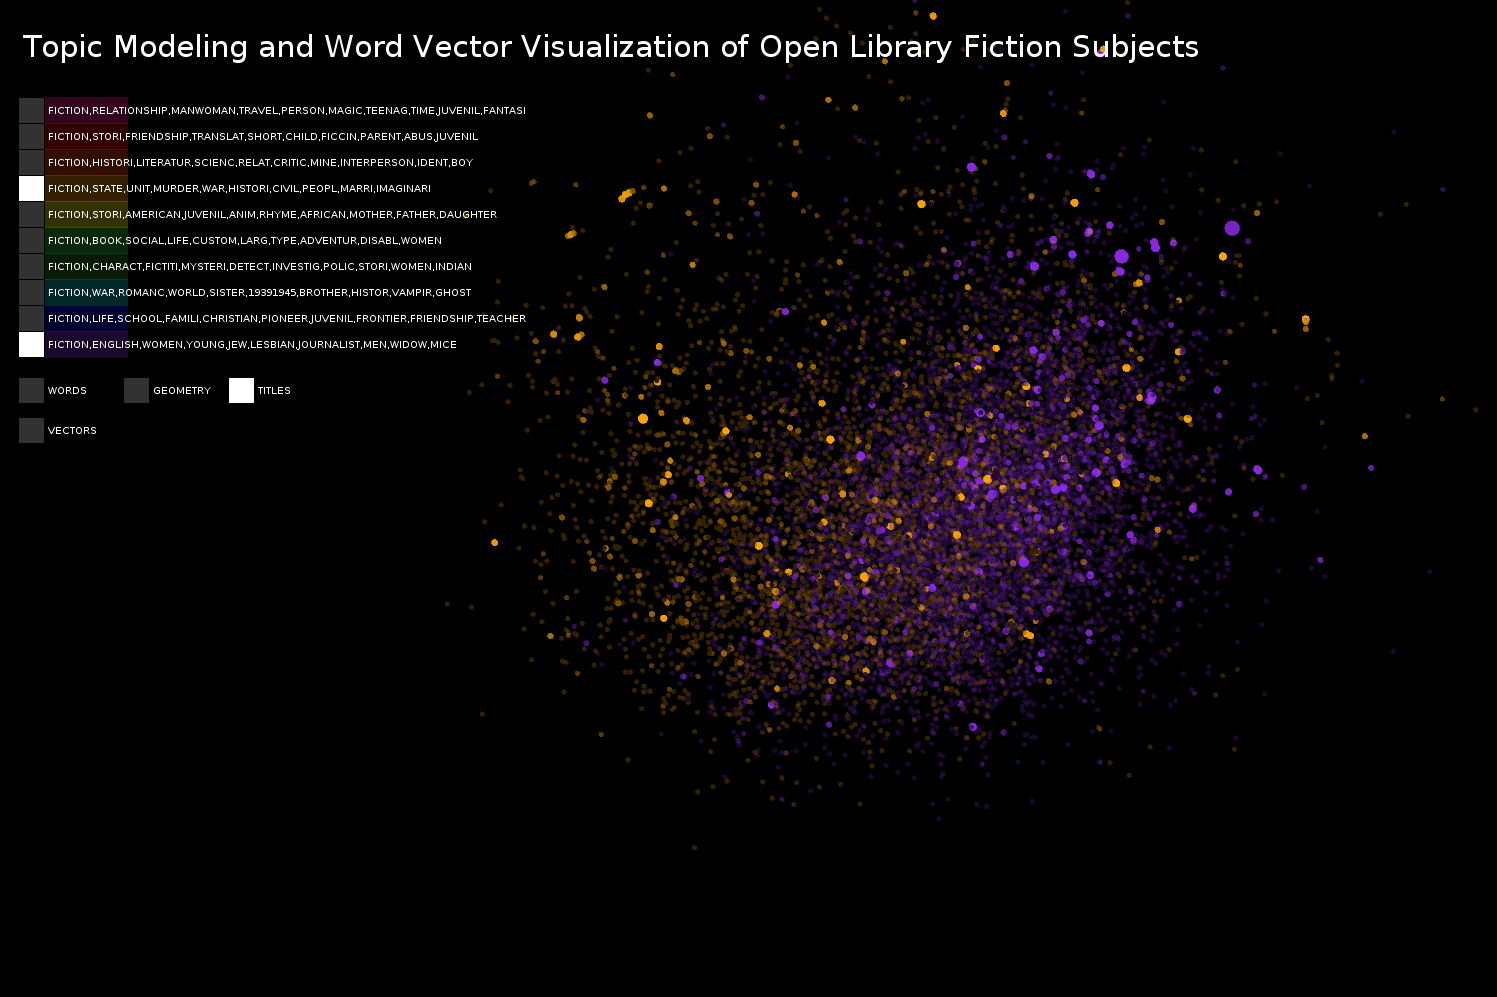
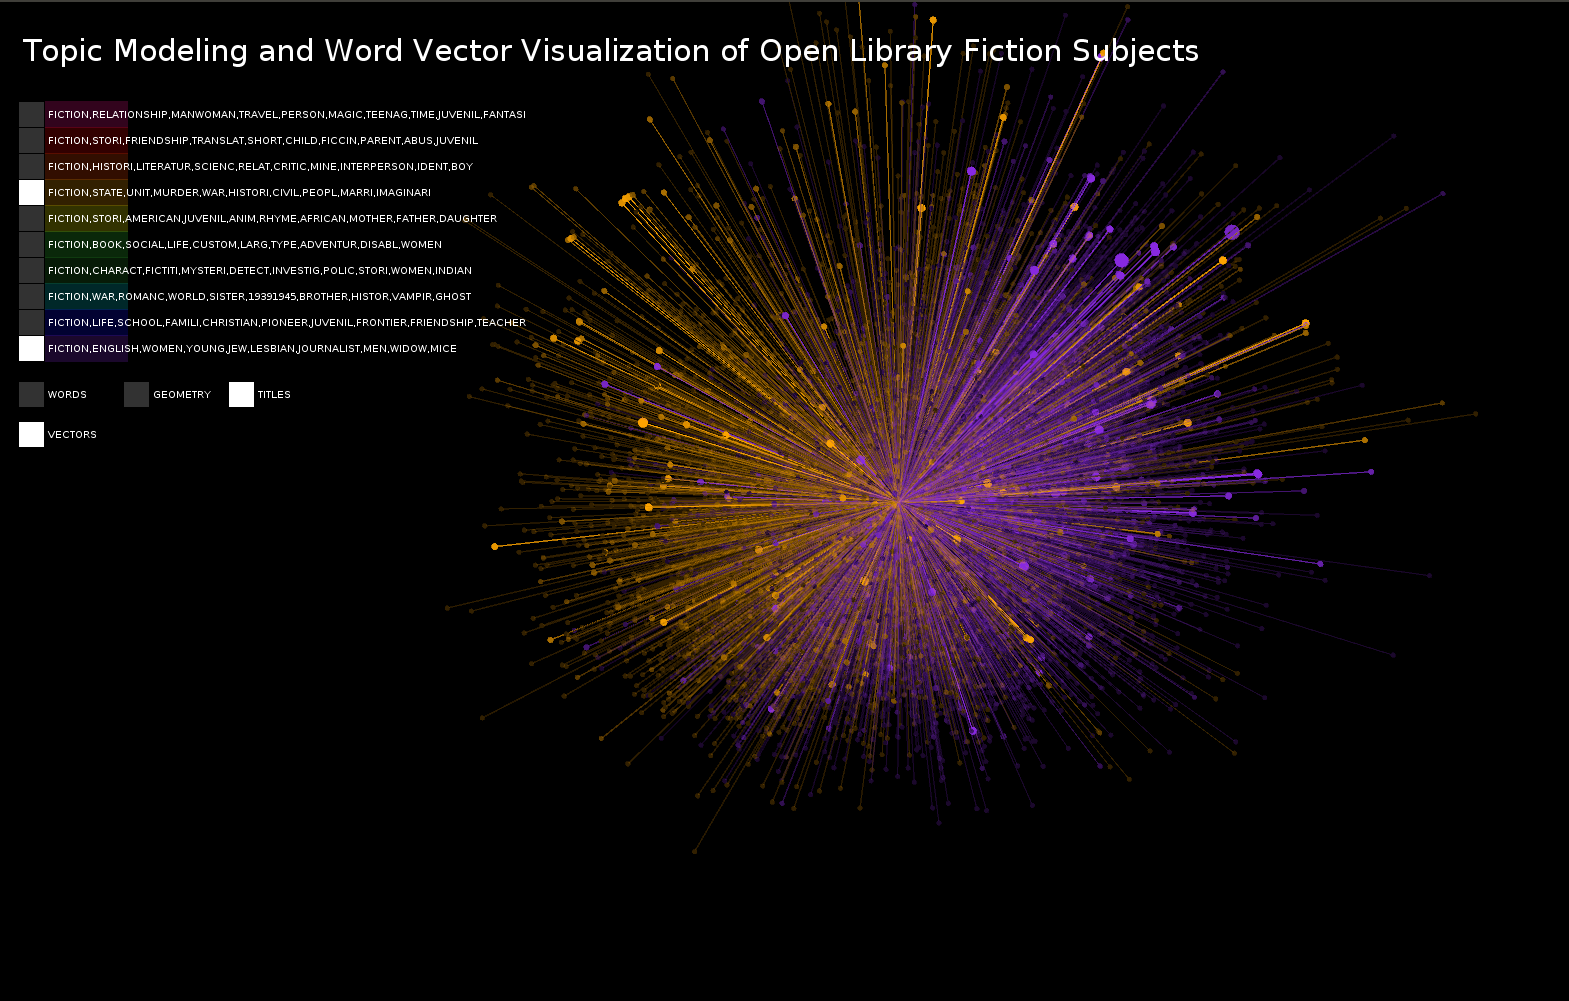
Two topics shown with vectors turned on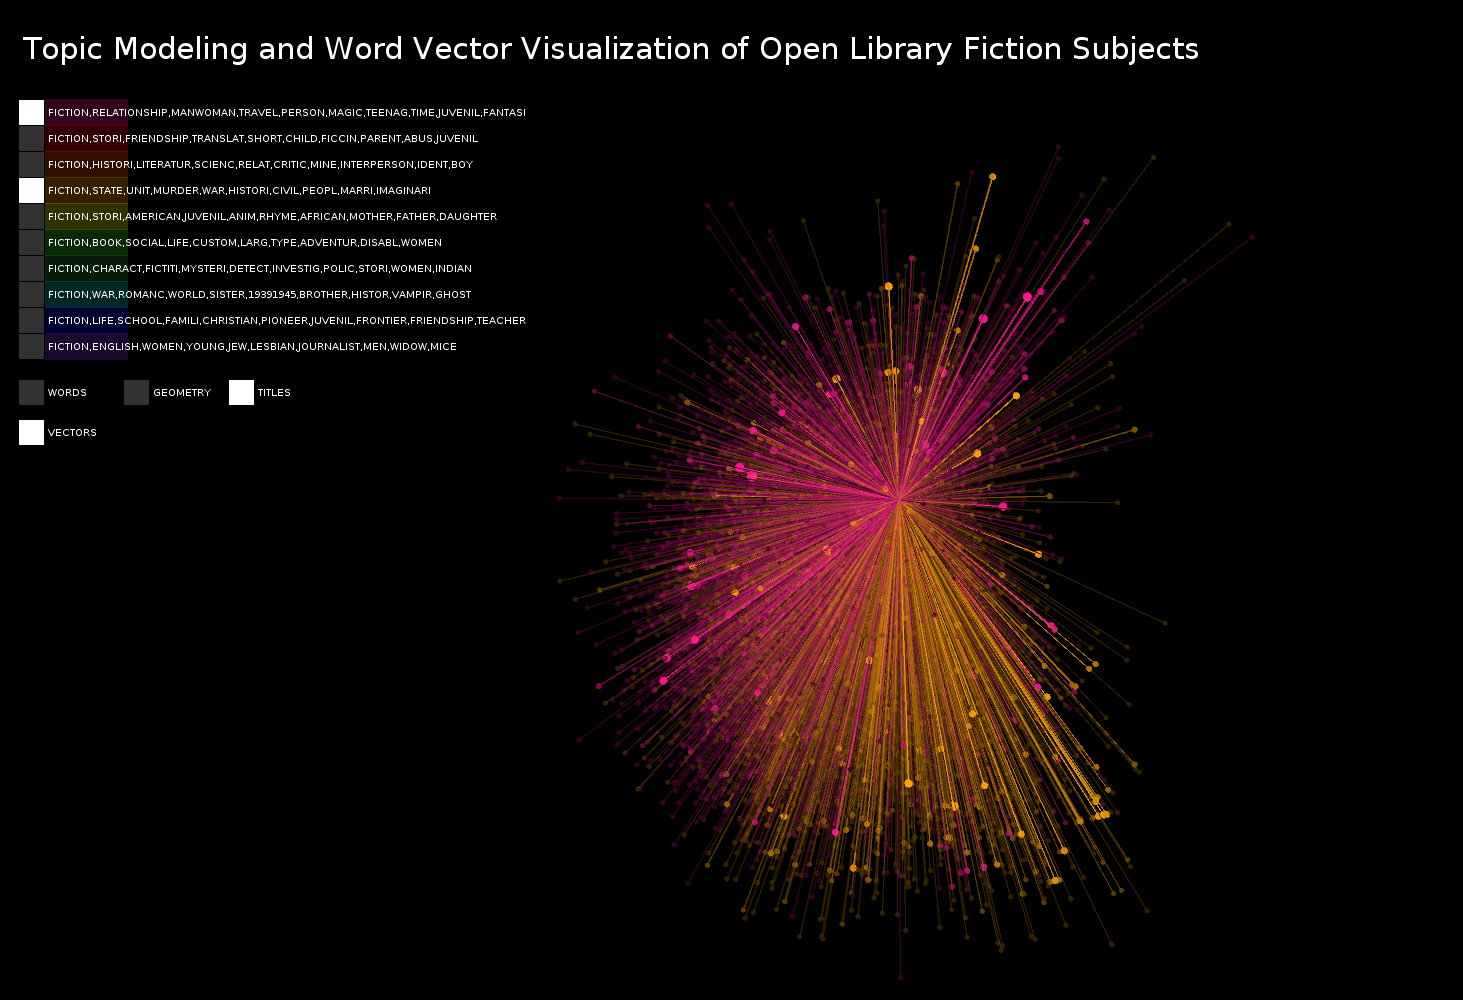
Subjects associated with "prairies"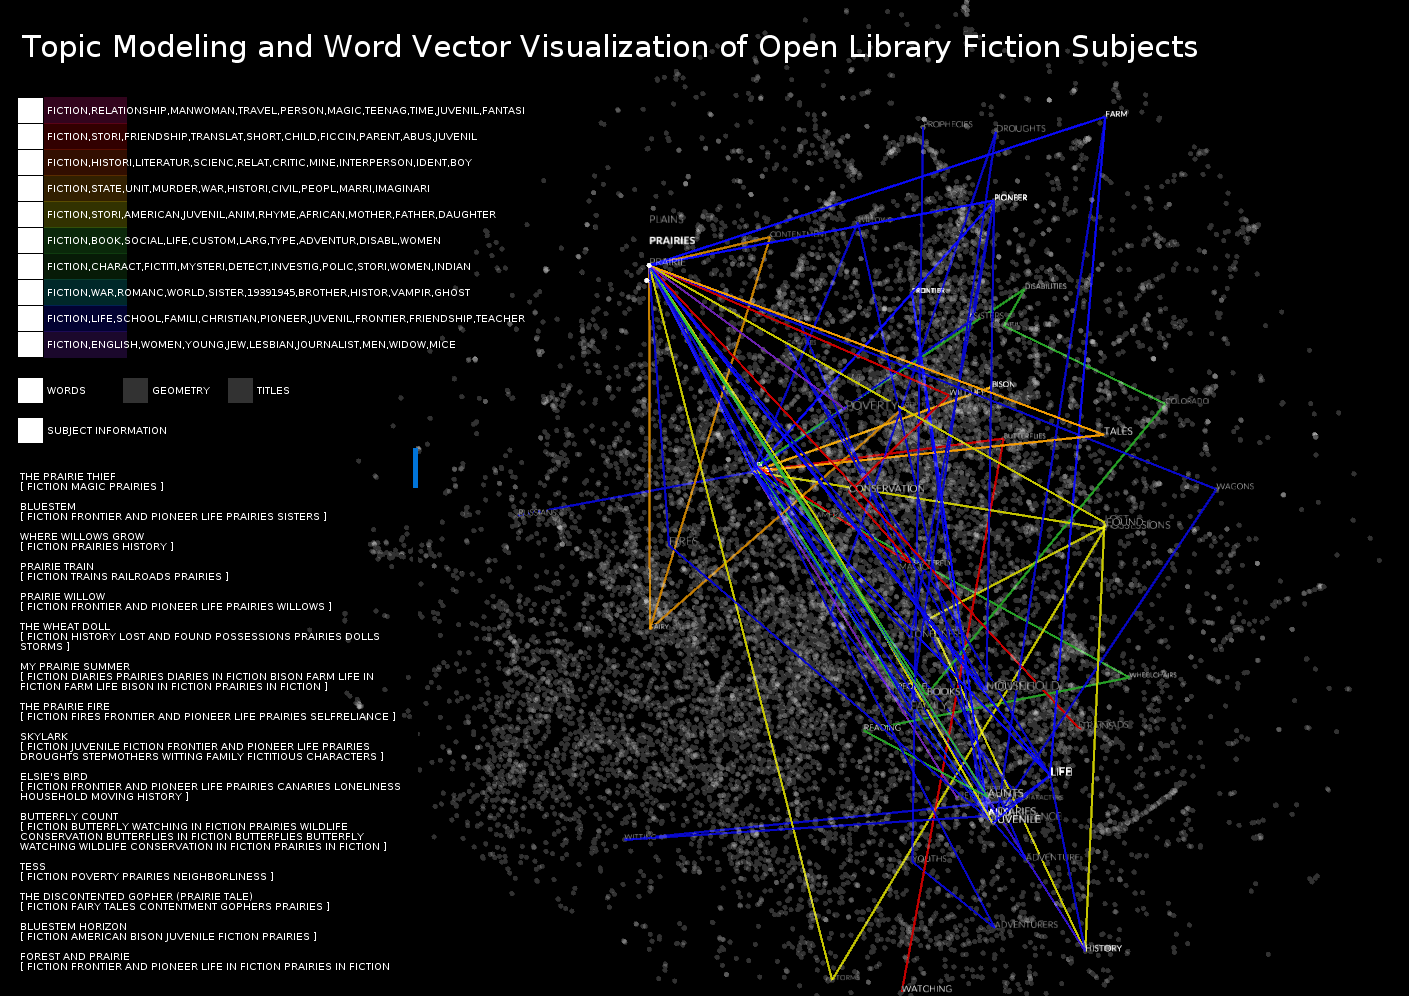
Subjects associated with "indians"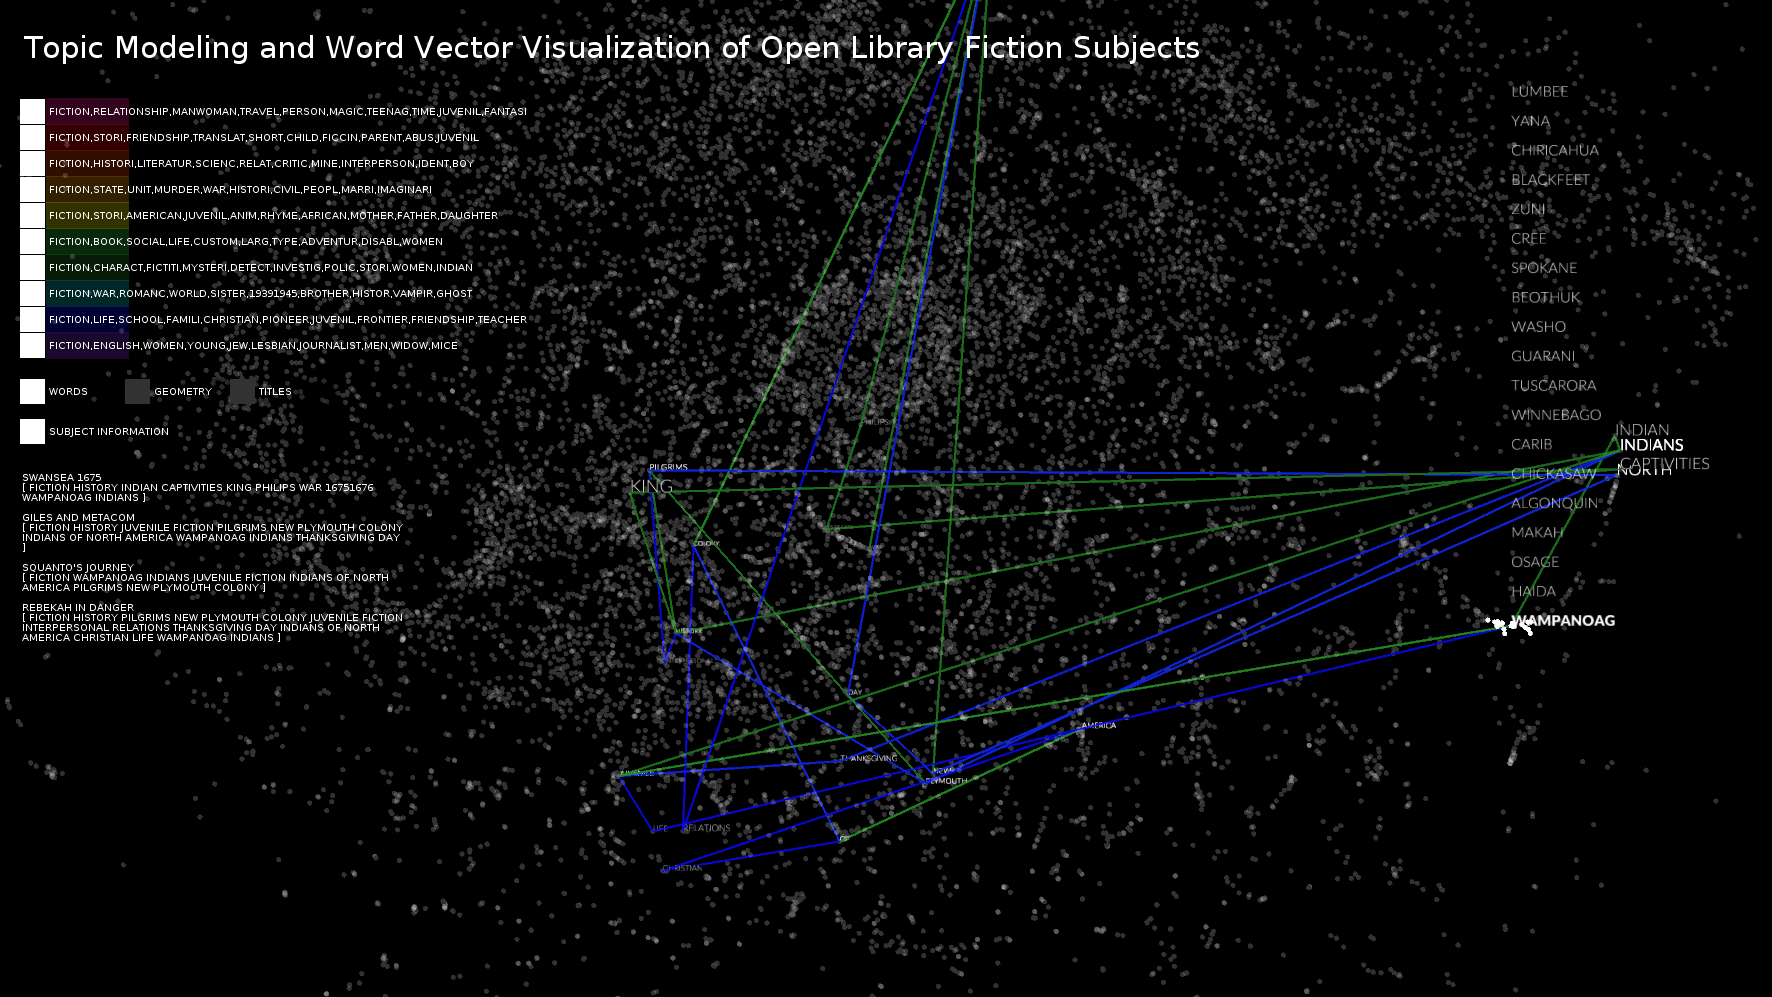
Geometry view with indians selected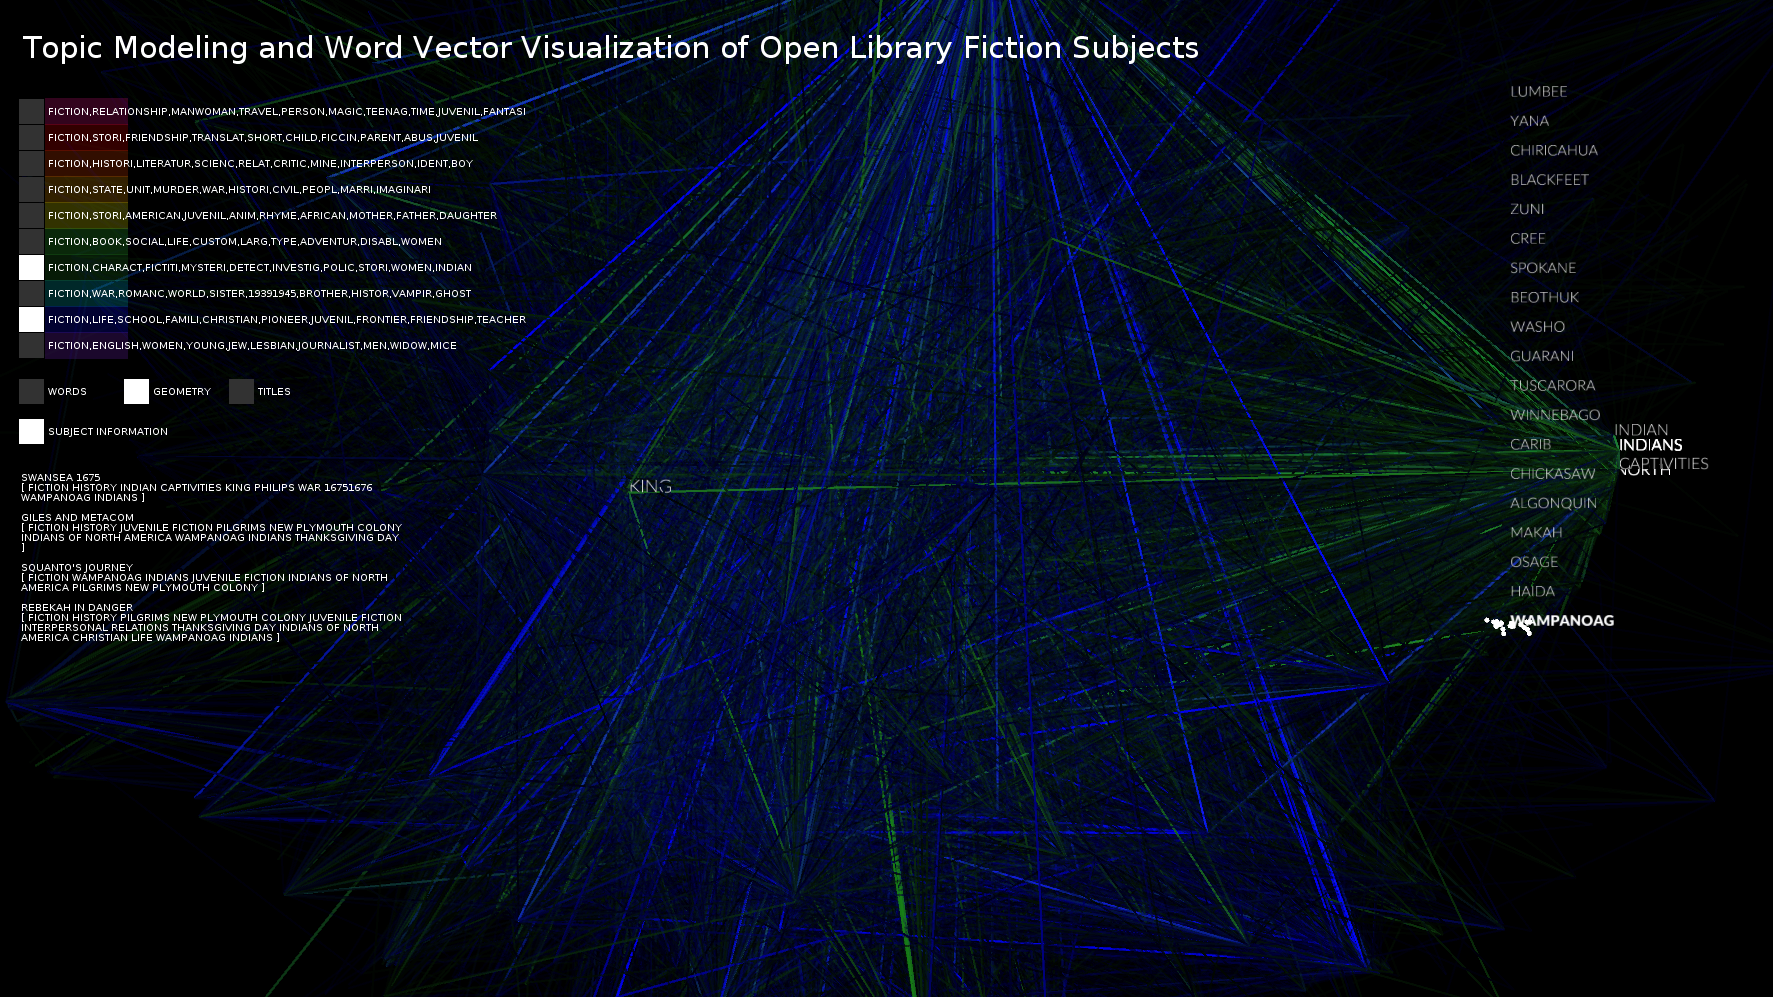
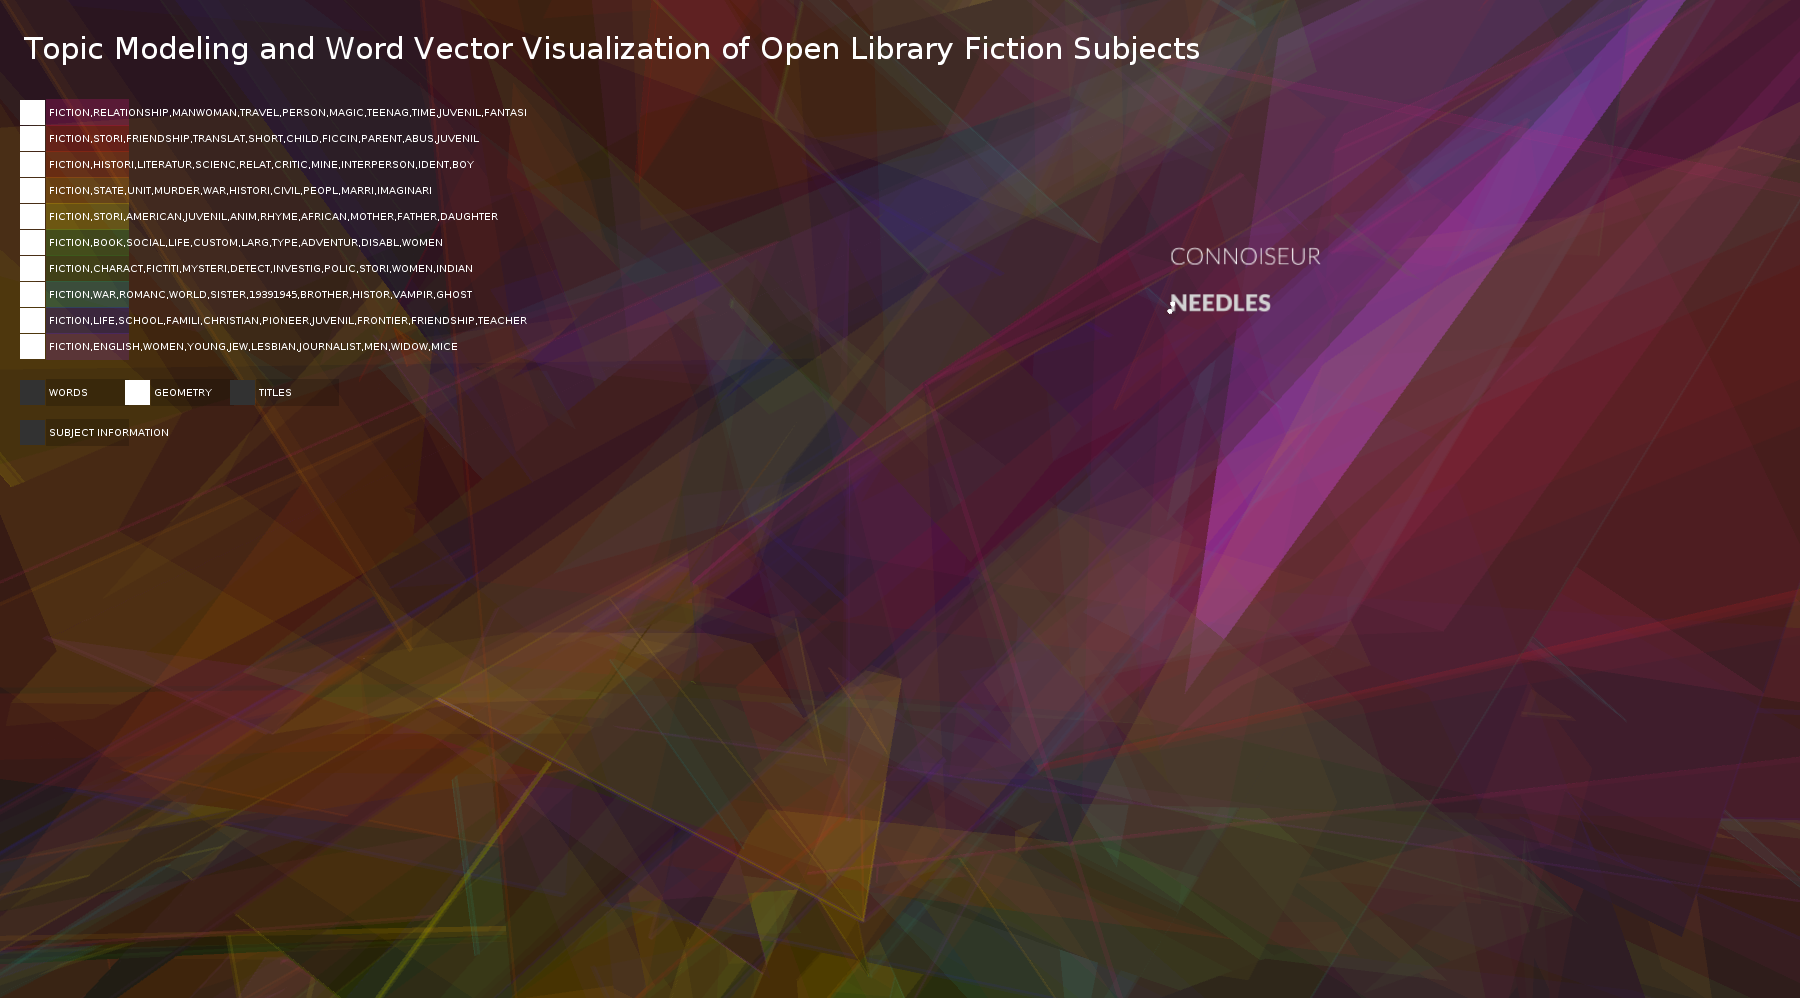
Pretty zoomed in of geometry view surrounding "needles"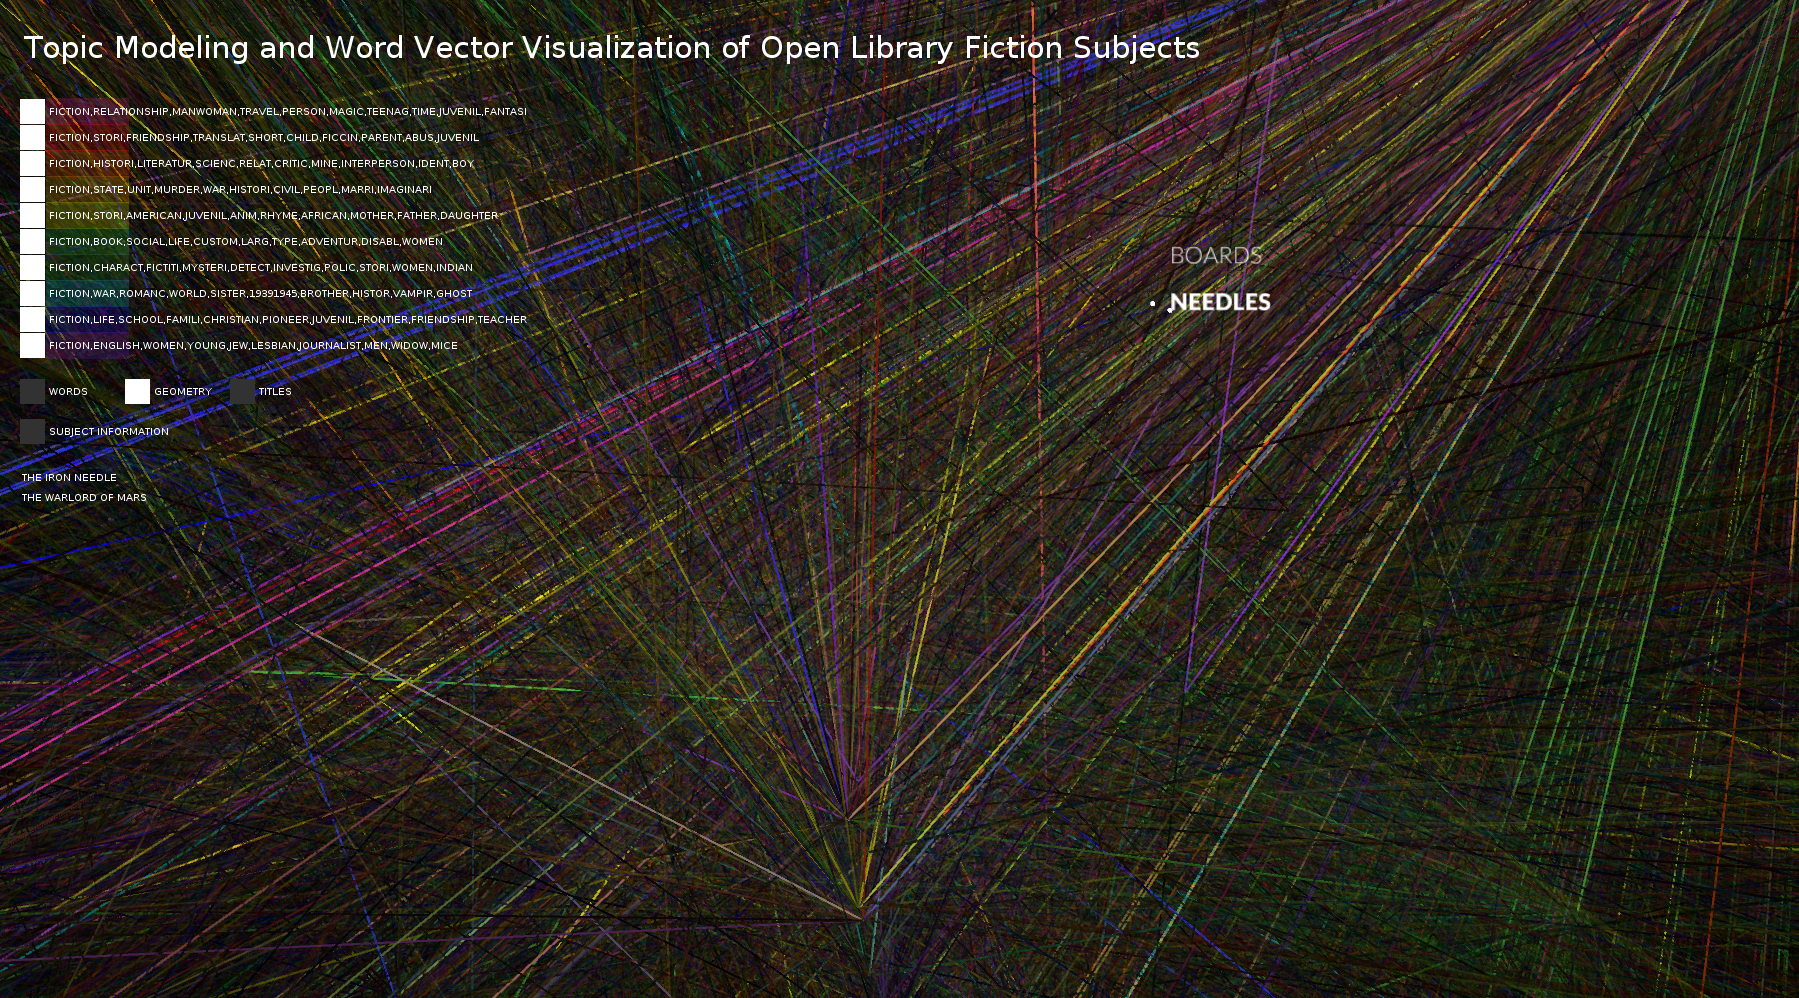
All the topics visualized at once
Two topics shown
The subject path of a title selected
Two views of the same data with vectors turned on and off
Two topics shown with vectors turned on
Subjects associated with "prairies"
Subjects associated with "indians"
Geometry view with indians selected
Pretty zoomed in of geometry view surrounding "needles"
Interaction
Each LDA defined subject is given a separate color which can be turned on and off.
The titles can be viewed in Title Mode, where the vectors can be turned on and off.
The word cloud can be used to see what books have subjects that include the second word, the word subject information can be turned on and off.
The geometry mode is pretty, slow and relatively useless.
When a point is hovered over the words/titles appear, the user can use the up and down arrow keys to cycle through the words/titles. The right and left arrow keys can be used to select a specific word/title and see the connections related to it.
Evaluation/Analysis
Overall the project works best in title view when comparing two separate datasets or when in word view seeing which books are similar. For example in the title view "Fiction/Character/Fictitious/Mystery/Detective/Investigator" or the mystery category that I think of it as deviates the most from all other groups, particularly from the "kids books" and "christian/life/friendship books". The "Fiction/State/Unit/Murder/War/Historical/Civil" group also separated itself a lot from the "Fiction/English/Women/Young/Jew/Lesbian" group, and Fiction/Relationship/MANWOMAN/Travel/Person/Magic/Teenager" group. I see this as "War/Mystery/Suspense" separating from books targeted at older and younger women focusing more on relationships. The vector mode can be useful for visually seeing the divides.
The word view is interesting because you can see what words are associated with which topics and the relationships between them. For example most books with prarie in the title are under "christian/family" books, while indians is a combination of those books (pilgrim/indians) and "war/mystery" books (war/indians).
I would be interested in seeing the visualization with different numbers of categories to see which fit the dataset the best. I chose 10 because I wanted them to be more like genres. I would love to do this project with more information, like a book summary to see if that would create better topic groups. I ran into the issue that I would run out of memory if I was running a TSNE with too many words which limited the size of the dataset. I would like to figure out how to get around the memory area and run the analysis on a bigger set of words.
Code