The Vinyl Frontier
MAT 259, 2016
Jason Freeberg
Concept
My original question was to investigate the volume of CD's checked out from the Seattle Public Library broken down by album genre. However, I came to find out that there is a massive number of CDs checked out every year, so I could not visualize such a broad range of CD's over any appropriate length of time.
I reformed my question to focus on the creator of the #1 best-selling album of all time: Michael Jackson. He makes for an interesting subject matter not only because of his popularity, but also because he passed away in mid-2009 and our data ranges from 2006 to 2017. My hypothesis was that there was a considerable uptick in the checkouts of his albums immediately following his passing.
I reformed my question to focus on the creator of the #1 best-selling album of all time: Michael Jackson. He makes for an interesting subject matter not only because of his popularity, but also because he passed away in mid-2009 and our data ranges from 2006 to 2017. My hypothesis was that there was a considerable uptick in the checkouts of his albums immediately following his passing.
Query
I queried the checkouts of his most common albums from 2008 to 2011. I joined that result set with the weekly checkouts of all those titles. The database was running quite slow, so I made the two queries separately and joined the results with R.
Ganular Query:
Weekly Query:
Ganular Query:
 SELECT DISTINCT # lots of duplicate transactions in this table, use distinct
    unix_timestamp(tr.checkOut) as checkOut,
    IFNULL(unix_timestamp(tr.checkIn), 0) as checkIn,
    o.title,
    year(tr.checkOut) as yearOut,
    month(tr.checkOut) as monthOut,
    weekOfYear(tr.checkOut) as weekOut
FROM
   spl_2016.transactions as tr
JOIN spl_2016.outraw as o
   ON tr.itemNumber = o.itemNumber
WHERE
    lower(o.title) IN(
      "number ones",
      "off the wall",
      "thriller",
      "bad",
      "dangerous",
      "history past present and future book 1",
      "invincible",
      "michael",
      "escape"
        )
    AND (IFNULL(
    	PERIOD_DIFF( date_format(tr.checkIn, "%YYYY%MM"), date_format(tr.checkOut, "%YYYY%MM") ) +
            (year(tr.checkIn) - year(tr.checkOut)) * 12, 0) <= 1) # only get checkouts under 1 month in length
   	AND year(tr.checkOut) >= 2007
    AND year(tr.checkOut) <= 2011
    AND (o.itemType REGEXP "cd" AND NOT o.itemtype REGEXP "(cas|bccd|acdisk|dvd|rec)") # Only CDs
    AND ROUND(o.deweyClass) IN(781, 782) # "vocal music" and "recorded music"
Weekly Query:
SELECT
    year(tr.checkOut) as yearOut,
    month(tr.checkOut) as monthOut,
    weekOfYear(tr.checkOut) as weekOut,
    if(o.bibnumber = 2149593, 1, 0) as thrillerCount
FROM
    spl_2016.transactions as tr
JOIN spl_2016.outraw as o
    ON tr.itemNumber = o.itemNumber
WHERE
	year(tr.checkOut) >= 2009 AND
    year(tr.checkOut) <= 2011 AND
    (o.itemType REGEXP "cd" AND NOT o.itemtype REGEXP "(cas|bccd|acdisk|dvd|rec)") AND # Only CDs
    ROUND(o.deweyClass) = 782 # 782 is "vocal music"
GROUP BY
    yearOut, monthOut, dayOut
Preliminary sketches
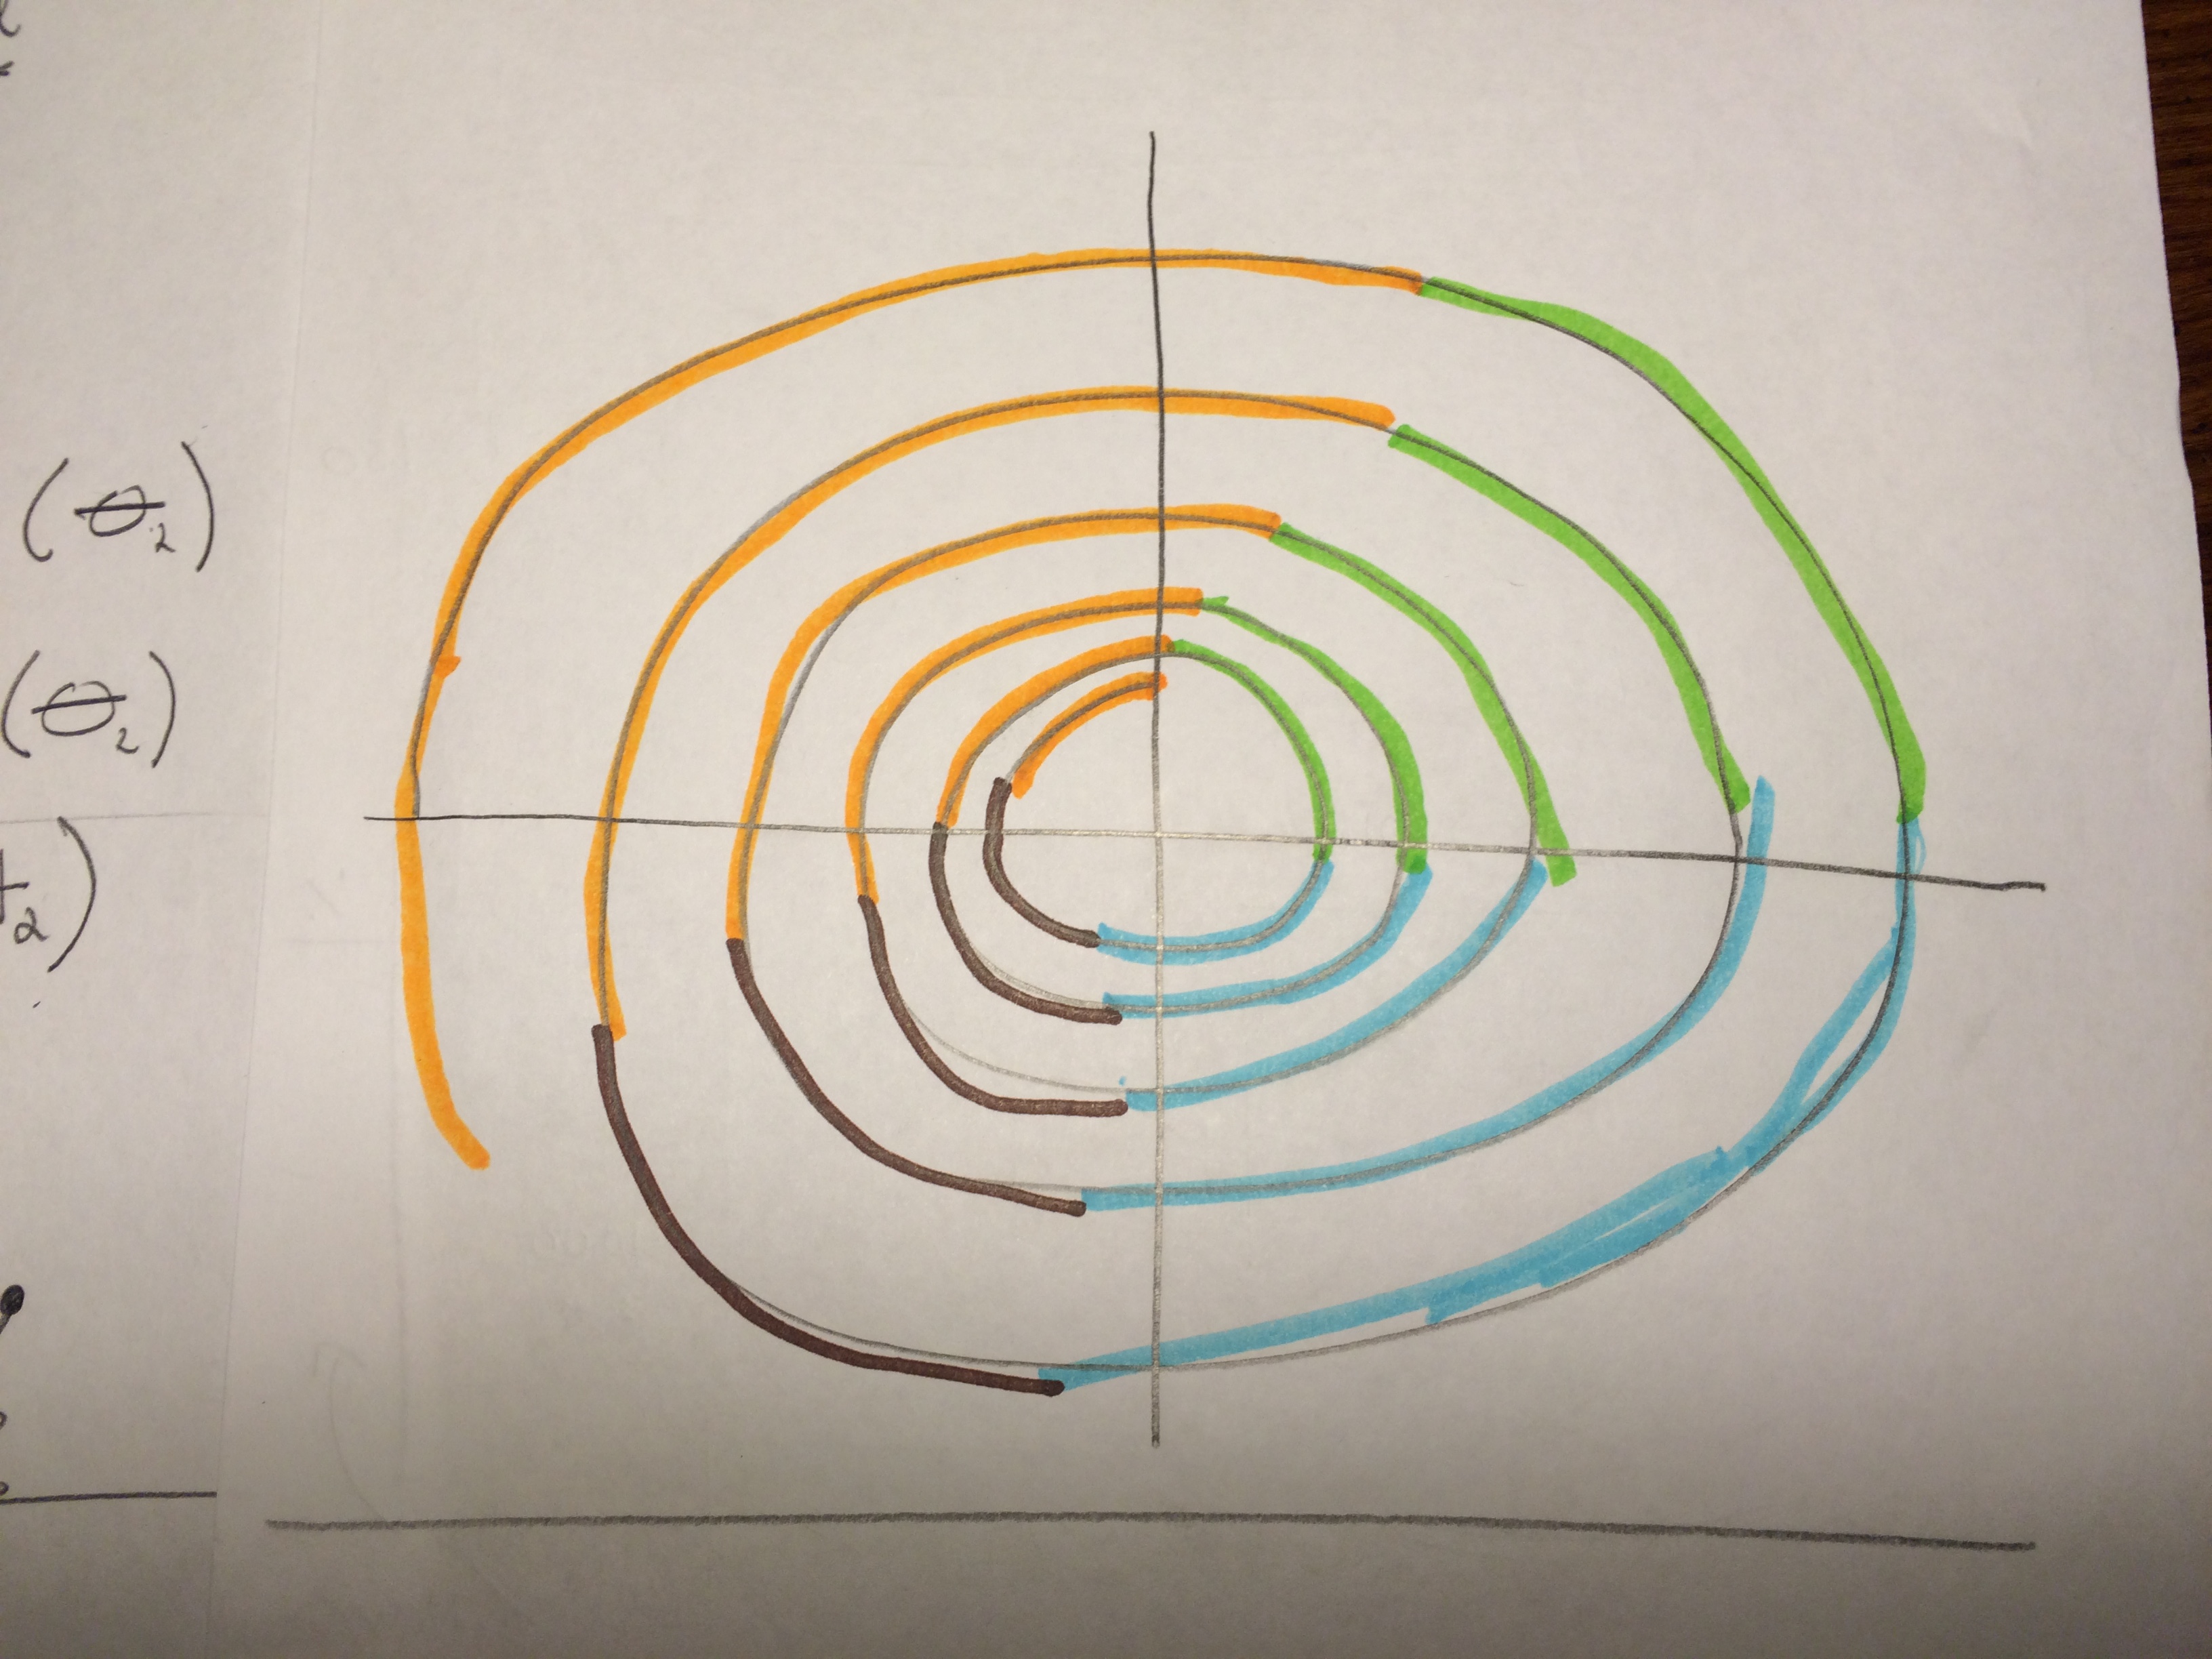
You could say that plotting the spirals really threw me for a loop. Pun intended. I wanted the visualization to represent the colored drawing below. However, due to the high number of rotations in the final visualization, the color organization did not quite come out the same.
Process
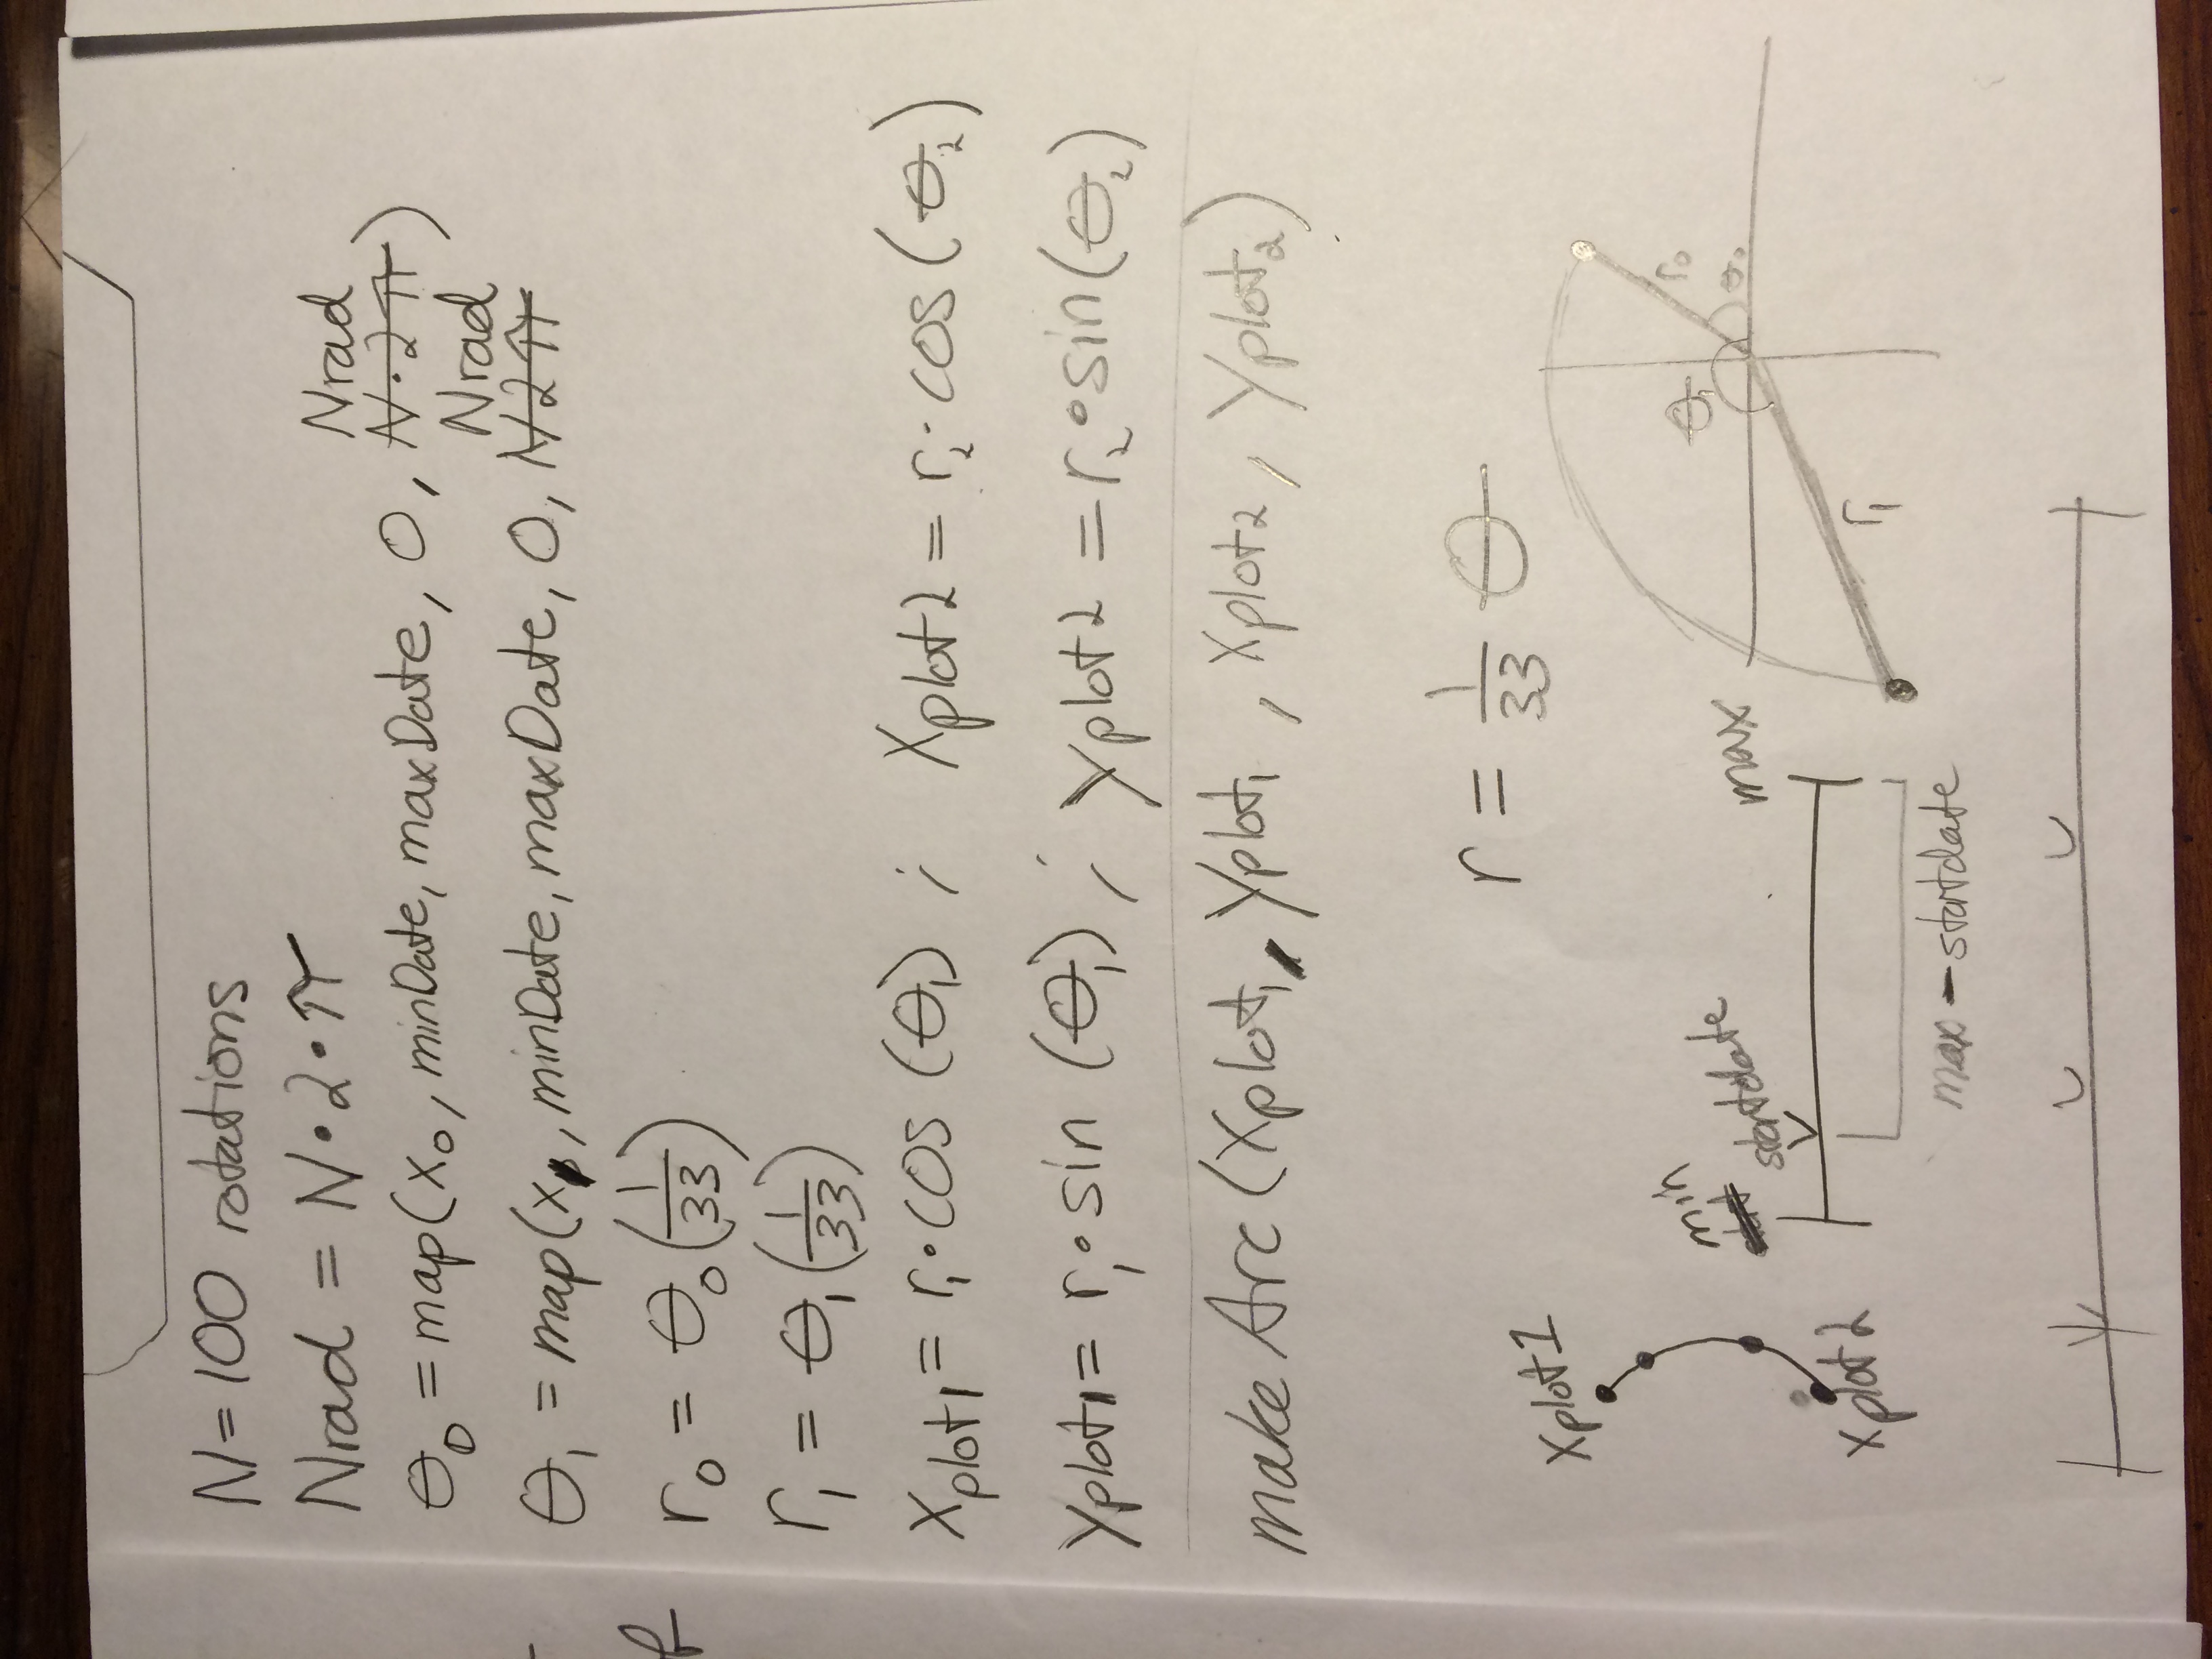
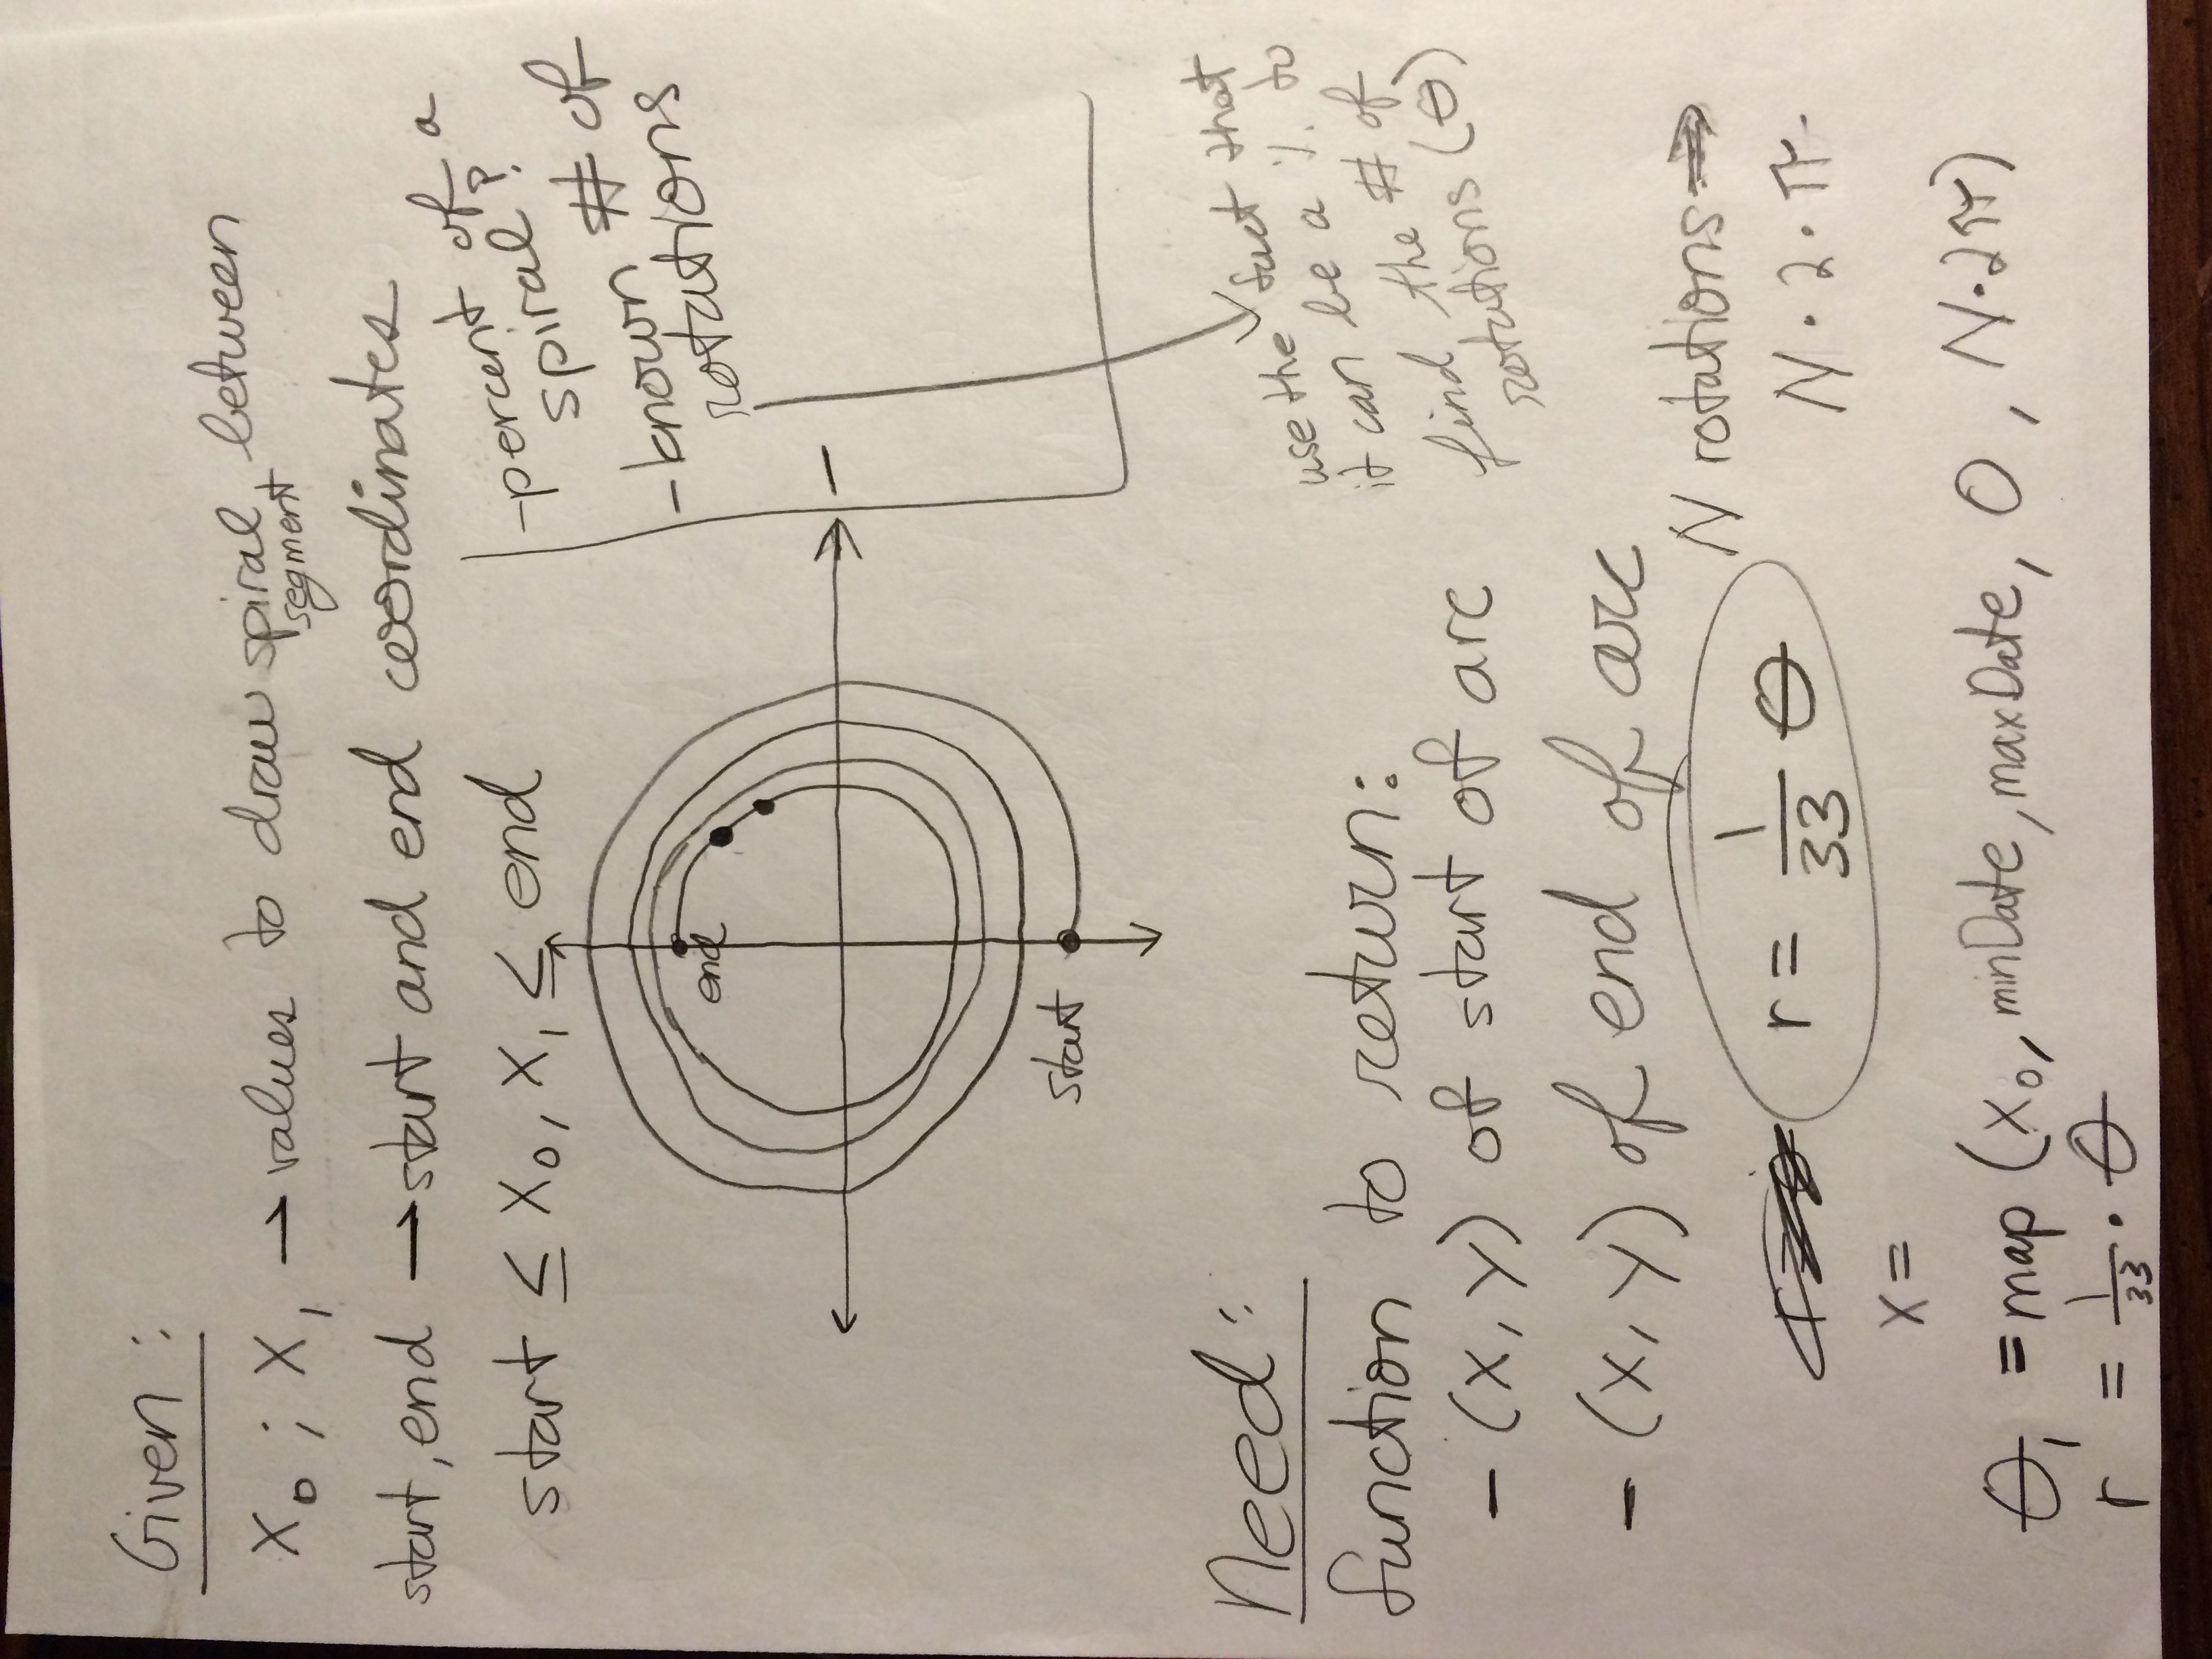
My first problem was learning how to plot a spiral in Processing--I had to review my polar coordinates from high school! I also wanted to make sure that any spirals in the back of the visualization were still visible from the front view. To make that happen, I counteracted the perspective and made the spiral segments grow exponentially as their position along the Z axis (and distance from the front view) increased.
Final result
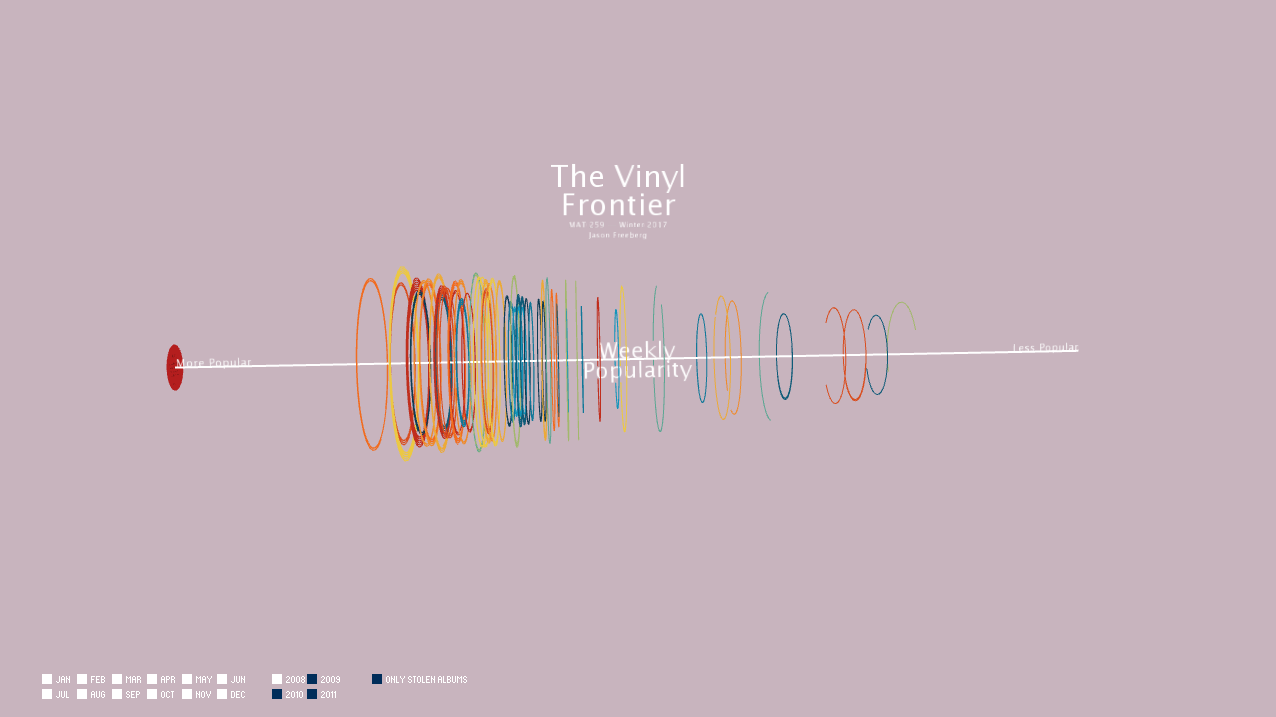
Vinyl records are a physical storage format for music, so I wanted the form of my data to represent one. To accomplish this, I imagined the space being organized by a cylindrical coordinate system. Each individual transaction is represented as a segment of the vinyl record's spiraling grooves. Each transaction is color-coded by month: winter months are in shades of blue and summer months are shown in reds and yellows. If a segment is very long and towards the outside of the object, then it was checked out closer to 2011. If it is shorter and near the center, it was checked out closer to 2008. Each spiral segment's position along the Z-axis is proportional to its popularity. Items close to the front were checked out in a very popular week, less popular weeks are toward the back.
Jackson's best-selling album was Thriller. I used that as my inspiration for the sonification of the data. When the user presses "p", the song, Thriller, will begin to play. The volume of the track is calculated directly from the weekly checkouts of the albums. For the data before Jackson's passing, the song plays quietly and with little fluctuation. As the song approaches the data for mid/late 2009, the song becomes much louder and fluctuates until the end of the song and data. It was really interesting to hear the data.
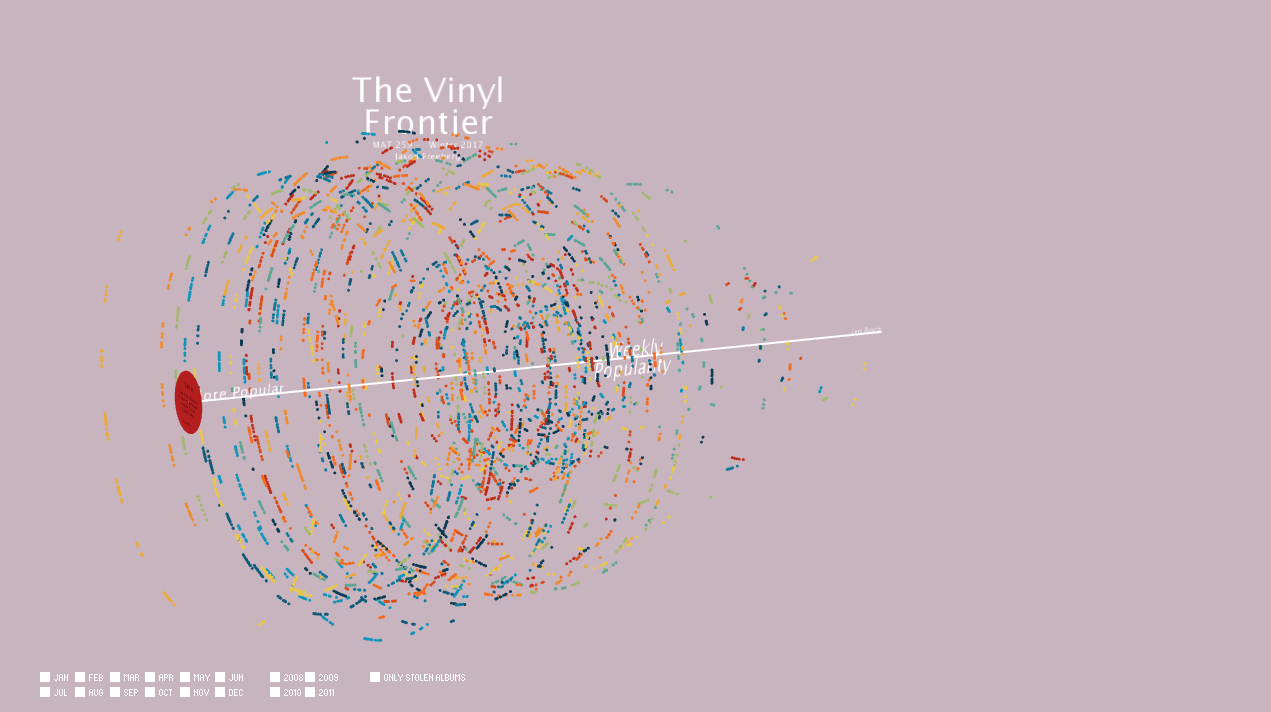
I used controlP5 to make a HUD with some options for the user. There are checkboxes for each month of the year and for the years 2008, 2009, 2010, 2011. On startup, all are selected. Deselecting a checkbox will remove that portion of data from the visualization. There is a last checkbox: "Plot Missing Items" which will plot each incomplete transaction as a dot. The dots are color-coded just like the lines.
Keyboard Interactivity: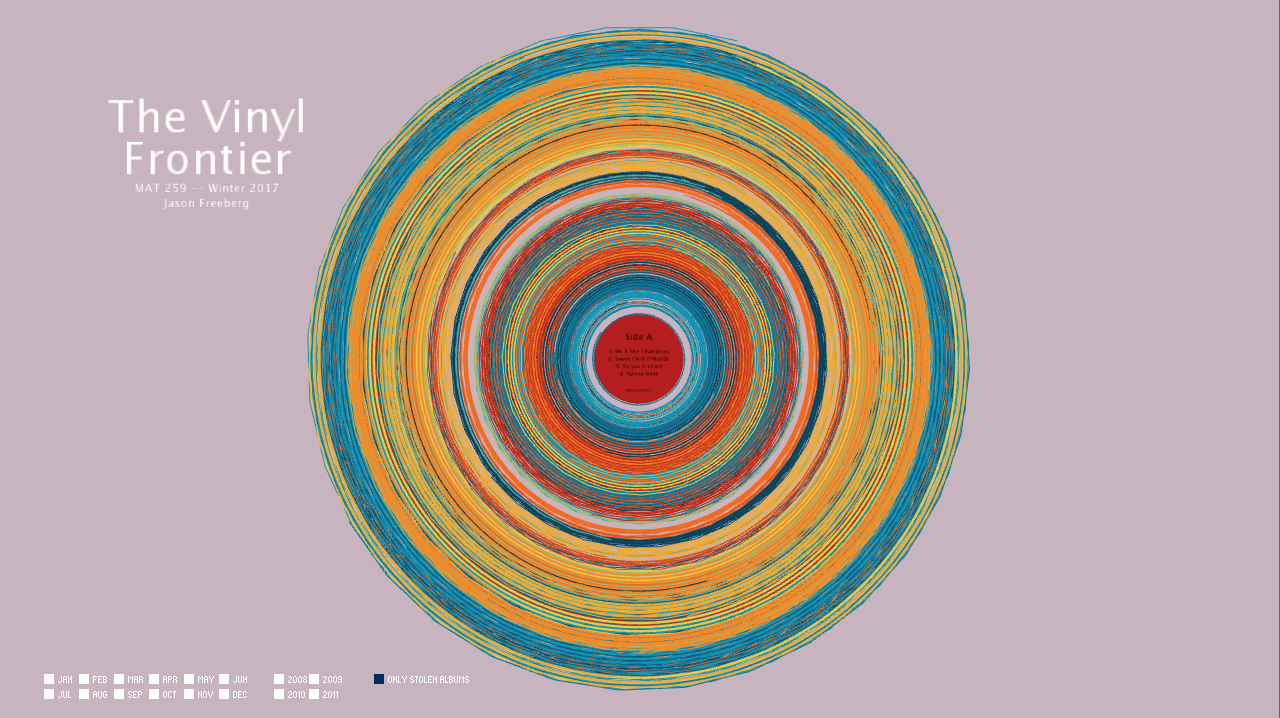


Jackson's best-selling album was Thriller. I used that as my inspiration for the sonification of the data. When the user presses "p", the song, Thriller, will begin to play. The volume of the track is calculated directly from the weekly checkouts of the albums. For the data before Jackson's passing, the song plays quietly and with little fluctuation. As the song approaches the data for mid/late 2009, the song becomes much louder and fluctuates until the end of the song and data. It was really interesting to hear the data.
I used controlP5 to make a HUD with some options for the user. There are checkboxes for each month of the year and for the years 2008, 2009, 2010, 2011. On startup, all are selected. Deselecting a checkbox will remove that portion of data from the visualization. There is a last checkbox: "Plot Missing Items" which will plot each incomplete transaction as a dot. The dots are color-coded just like the lines.
Keyboard Interactivity:
- Space: resets camera to default view
- P: plays "Thriller" in accordance to data
- R: rewinds the song.
- Y: Reset year selections
- M: Reset month selections
Evaluation/Analysis
As expected, when we look at the checkouts year-by-year, we can clearly see the surge in Jackson's popularity following his death. The same result can be heard from the sound component. Furthermore, it seems that Jackson's popularity carried through the remaining portion of the data. Some months in 2011 were very popular for Jackson.
Overall I am quite happy with the result. The single hardest technical aspect was plotting the spiral segments efficiently, as they are a series of connected line segments in a PShape object and expensive to render. The hardest non-technical aspect was narrowing my question from my original, which was far too general. If time allowed, I would have added labeling to accompany the song component and more labeling to help guide the viewer's understanding of the data's organization.
Overall I am quite happy with the result. The single hardest technical aspect was plotting the spiral segments efficiently, as they are a series of connected line segments in a PShape object and expensive to render. The hardest non-technical aspect was narrowing my question from my original, which was far too general. If time allowed, I would have added labeling to accompany the song component and more labeling to help guide the viewer's understanding of the data's organization.
Code